Simulink.sdi.setSubPlotLayout - Set subplot layout in Simulation Data Inspector - MATLAB (original) (raw)
Main Content
Set subplot layout in Simulation Data Inspector
Syntax
Description
Examples
Change the subplot layout to 4 rows and2 columns.
Simulink.sdi.setSubPlotLayout(4,2);
Create a run, add data to it, and then view the data in the Simulation Data Inspector.
Create Data for Run
Create two timeseries objects to contain data for a sine signal and a cosine signal. Give each timeseries object a descriptive name.
time = linspace(0,20,100);
sine_vals = sin(2pi/5time); sine_ts = timeseries(sine_vals,time); sine_ts.Name = "Sine, T=5";
cos_vals = cos(2pi/8time); cos_ts = timeseries(cos_vals,time); cos_ts.Name = "Cosine, T=8";
Create Run and Add Data
Use the Simulink.sdi.view function to open the Simulation Data Inspector.
To import data into the Simulation Data Inspector from the workspace, create a Simulink.sdi.Run object using the Simulink.sdi.Run.create function. Add information about the run to its metadata using the Name and Description properties of the Run object.
sinusoidsRun = Simulink.sdi.Run.create; sinusoidsRun.Name = "Sinusoids"; sinusoidsRun.Description = "Sine and cosine signals with different frequencies";
Use the add function to add the data you created in the workspace to the empty run.
add(sinusoidsRun,"vars",sine_ts,cos_ts);
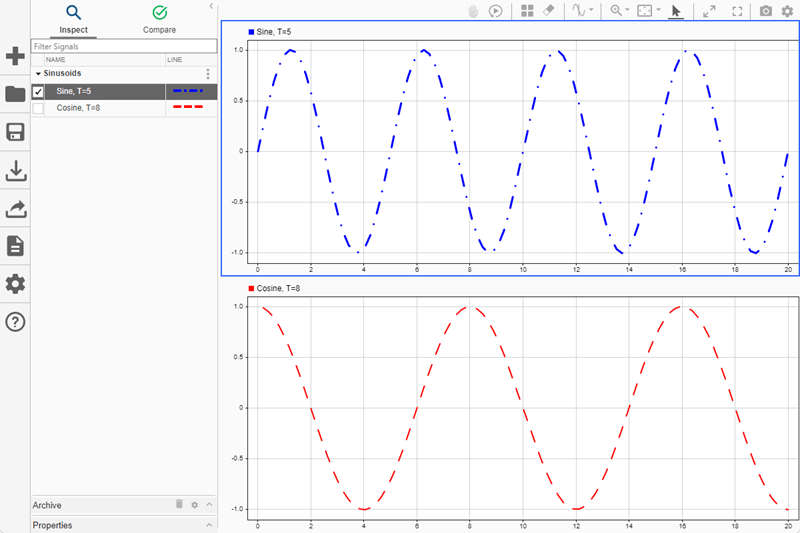
Plot Data in Simulation Data Inspector
Use the getSignalByIndex function to access Simulink.sdi.Signal objects that contain the signal data. You can use the Simulink.sdi.Signal object properties to specify the line style and color for the signal and plot the signal in the Simulation Data Inspector. Specify the LineColor and LineDashed properties for each signal.
sine_sig = getSignalByIndex(sinusoidsRun,1); sine_sig.LineColor = [0 0 1]; sine_sig.LineDashed = "-.";
cos_sig = sinusoidsRun.getSignalByIndex(2); cos_sig.LineColor = [1 0 0]; cos_sig.LineDashed = "--";
Use the Simulink.sdi.setSubPlotLayout function to configure a 2-by-1 subplot layout in the Simulation Data Inspector plotting area. Then, use the plotOnSubplot function to plot the sine signal on the top subplot and the cosine signal on the lower subplot.
Simulink.sdi.setSubPlotLayout(2,1);
plotOnSubPlot(sine_sig,1,1,true); plotOnSubPlot(cos_sig,2,1,true);
Close Simulation Data Inspector and Save Data
When you finish inspecting the plotted signal data, you can close the Simulation Data Inspector and save the session to an MLDATX file.
Simulink.sdi.close("sinusoids.mldatx")
Input Arguments
Number of rows in the subplot grid layout, specified as a positive integer between 1 and 8, inclusive.
Example: 2
Number of columns in the subplot grid layout, specified as a positive integer between 1 and 8, inclusive.
Example: 2
Limitations
- You cannot set a three-plot layout or apply overlays programmatically. Instead, in the Simulation Data Inspector, select Visualizations and layouts
 . Then, choose your three-plot or overlay layout.
Version History
Introduced in R2016a
See Also
Functions
- Simulink.sdi.clearAllSubPlots | Simulink.sdi.clearPreferences | Simulink.sdi.setBorderOn | Simulink.sdi.setMarkersOn | Simulink.sdi.setTicksPosition | Simulink.sdi.setTickLabelsDisplay | Simulink.sdi.setGridOn | plotOnSubPlot | Simulink.sdi.saveView | Simulink.sdi.save