Execution of a Stateflow Chart - MATLAB & Simulink (original) (raw)
When a Stateflow® chart wakes up, the chart follows a workflow and executes actions. A Stateflow chart wakes up:
- At each time step
- When the Stateflow chart receives an event
When a chart wakes up for the first time, the chart is initialized and becomes active, as described in Workflow for Entering a Chart or State. When there are no more actions to take, the chart goes to sleep until a new time step or event wakes up the chart.
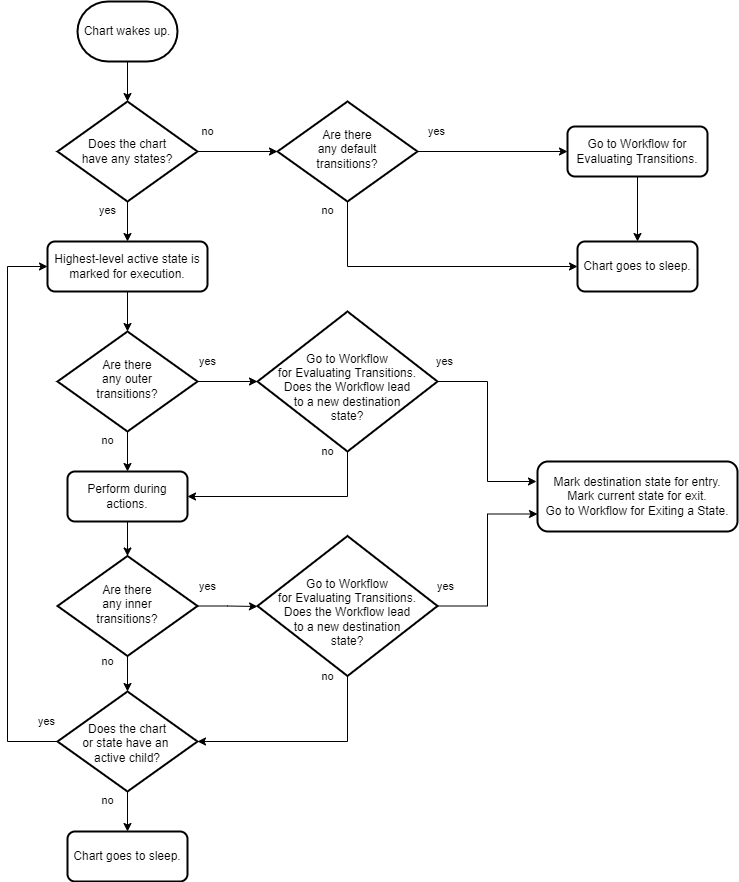
Workflow for Stateflow Chart Execution
This flow chart shows the progression of events that Stateflow takes when executing a chart or state. In this flow chart, the current state refers to the state in which a decision or a process takes place.
Default Transitions
A default transition is a transition that has no source. In a Stateflow chart that does not contain any states, a default transition marks the start of a flow chart. For more information, see Create Flow Charts in Stateflow.
If a Stateflow chart does not contain any states, the chart evaluates the default transition paths each time the chart wakes up. After marking a default transition for evaluation, the chart follows the steps shown in Workflow for Evaluating Transitions.
Note
Charts evaluate default transition paths inside a state only during state entry, and not each time the chart wakes up.
Outer Transition
An outer transition is a transition that exits the source state. A Stateflow chart marks outer transitions for evaluation as the first step in executing a state. After marking an outer transition for evaluation, the chart follows the steps shown in Workflow for Evaluating Transitions.
During Actions
A during action is an action defined in a state label actions by using the prefix during or du. For more information, see Define Actions in a State.
A state performs during actions when the chart wakes up, the state is active, and there are no valid outer transitions.
Inner Transitions
An inner transition is a transition that does not exit the source state. For more information, see Control Chart Execution by Using Inner Transitions.
A Stateflow chart marks inner transitions for evaluation after a state performsduring actions. After marking an inner transition for evaluation, the chart follows the steps shown in Workflow for Evaluating Transitions.
Chart Execution with a Valid Transition
In this example, the Stateflow chart has been initialized and the entry actions have been performed for StateA and StateA1. A new time step occurs and the chart wakes up.
At this time step, x = 5, y = 2, andz = 0.
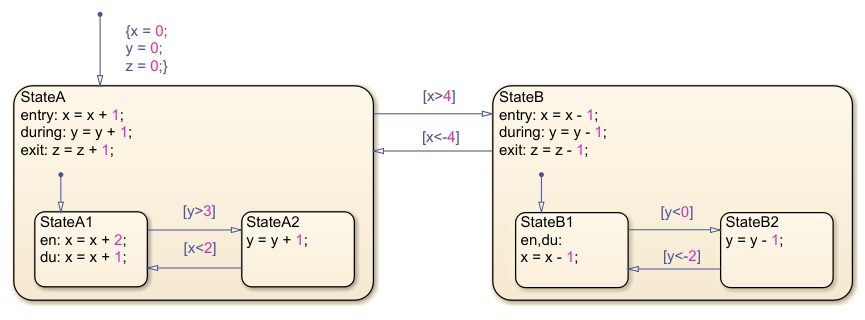
The chart executes these steps:
- The chart has an active substate,
StateA. StateAhas an outer transition toStateB. The chart determines that the transition is valid.- The chart marks
StateBfor entry andStateAis marked for exit. - To exit
StateA, the chart follows the steps shown inWorkflow for Exiting a State. - To enter
StateB, the chart follows the steps shown inWorkflow for Entering a Chart or State
Chart Execution Without a Valid Transition
In this example, the Stateflow chart has been initialized and the entry actions have been performed for StateA and StateA1. A new time step occurs and the chart wakes up.
At this time step, x = 3, y = 0, andz = 0.
The chart executes these steps:
- The chart has an active substate,
StateA. StateAhas an outer transition toStateB. The chart determines that the transition is invalid.- The chart performs the
duringactions forStateA. Nowy = 1. StateAdoes not have any inner transitions.- The active substate of
StateAisStateA1. StateA1has an outer transition toStateA2. The chart determines that the transition is invalid.- The chart performs the
duringactions forStateA1. Nowx = 4. StateA1does not have any active substates.- The chart goes to sleep.