Control States in Charts Enabled by Function-Call Input Events - MATLAB & Simulink (original) (raw)
Main Content
This example shows how to control the state of a Stateflow® chart that is enabled by a function-call input event by setting the States When Enabling chart property. This property determines the values of states and data when the input event reenables the chart:
Held— Maintain most recent values of the states and data.Reset— Revert to the initial values of the states and data.
For new charts, the default setting is Held. For more information, see Activate a Stateflow Chart by Sending Input Events.
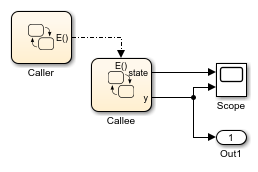
Example of a Chart Enabled by a Function-Call Input Event
In this model, the Caller chart uses the event E to wake up and execute the Callee chart.
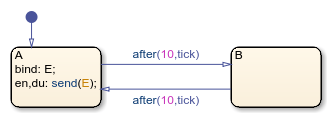
The Caller chart contains two states, A and B. When you bind the output event E in state A:
- Entering
Aenables theCalleechart. - Exiting
Adisables theCalleechart. - Reentering
Areenables theCalleechart.
The temporal logic operator after changes the active state every ten time steps, so the Callee chart is repeatedly enabled and disabled.
The Callee chart contains two states, C and D. Each time that the chart executes, the output data y increments by one. The state C is initially active. After one time step, the value of y is positive and the chart takes the transition to state D.
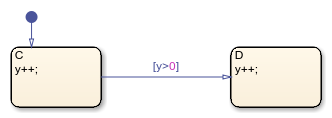
Chart Simulation When Property Is Held
In the Callee chart, the States When Enabling property is set to Held. During simulation, when the function-call input event reenables the chart at times  and
and  , state
 D stays active and output y maintains its most recent value.

Chart Simulation When Property Is Reset
In the Callee chart, change the States When Enabling property to Reset. During simulation, when the function-call input event reenables the chart at times and , state C becomes active and output y reverts to its initial value of zero.
