Compute Output Based on Size of Input Signal - MATLAB & Simulink (original) (raw)
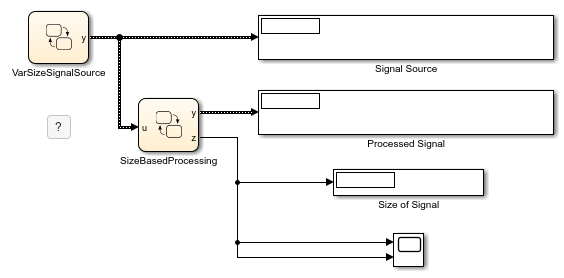
This example shows how to define variable-size output data in Stateflow® charts. In this model, the chart VarSizeSignalSource generates a variable-size signal. The chart SizeBasedProcessing analyzes this signal and produces a related variable-size signal. Display blocks show the values and size of the two signals.
For more information on variable-size data, see Declare Variable-Size Data in Stateflow Charts.
Generate Variable-Size Output Data
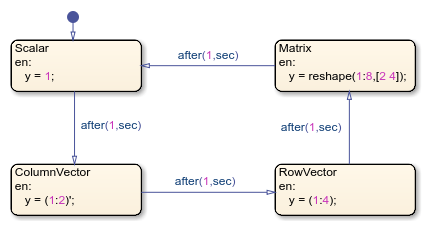
The Stateflow chart VarSizeSignalSource uses MATLAB® as the action language. The temporal logic in this chart triggers the transitions between four states. Each state generates an output value with a different size: a scalar, a two-element column vector, a four-element row vector, and a 2-by-4 matrix.
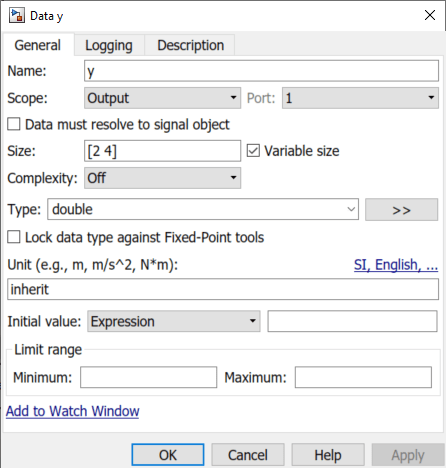
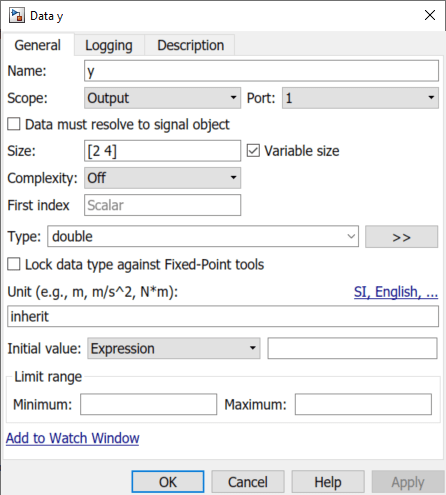
The chart behaves like a source block. It has no input and one variable-size output, y. For variable-size outputs, you must explicitly specify the upper bounds for each dimension. In this case, the Variable size property for y is enabled and its Size property is set to [2 4], the maximum size for the signal.
In charts that use MATLAB as the action language, state and transition actions can read and write directly to variable-size data. For example, the entry actions of the states in this chart explicitly compute the value of y.
Process Variable-Size Input Data
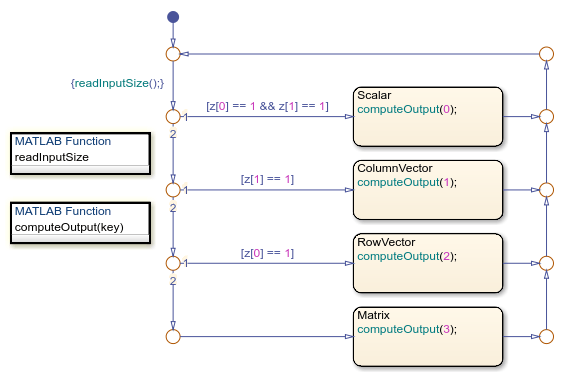
The Stateflow chart SizeBasedProcessing uses C as the action language. These charts can exchange variable-size data with other charts and blocks in the model. However, state and transition actions in C charts cannot read from or write to variable-size data directly. All computations involving variable-size data must occur in MATLAB functions, Simulink® functions, and truth tables that use MATLAB as the action language.
This chart has two variable-size data objects:
- Input
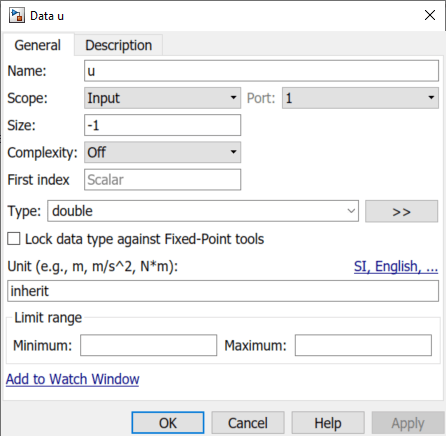
uis the variable-size signal generated by theVarSizeSignalSourcechart. Because the chart property Support variable-size arrays is enabled, this chart accepts variable-size input data from other blocks in the Simulink model. The Size property foruis set to-1to indicate that the chart inherits the maximum size for this input from the output in chartVarSizeSignalSource.
- Output
yis a variable-size signal whose size and value depends on whetheruis a scalar, a vector, or a matrix. The Size property foruis set to[2 4], the maximum size for the signal.
Because this chart uses C as the action language, the names of the variable-size data do not appear in the state actions or transition logic. Instead, the transition logic in the chart calls the MATLAB function readInputSize to determine the size of the input u. Similarly, the actions in the states call the MATLAB function computeOutput to produce values of various size for the variable-size output y. Because MATLAB functions can access chart-level data directly, you do not have to pass the variable-size data as inputs or outputs to these functions.
Determine Size of Input
The MATLAB function isScalarInput determines the size of the chart input u. This signal, which is generated by chart VarSizeSignalSource, can be a scalar, a 2-by-1 column vector, a 1-by-4 row vector, or a 2-by-4 matrix. The function stores the dimensions of u as the chart-level output z.
function readInputSize %#codegen z = size(u); end
Produce Variable-Size Output
The MATLAB function computeOutput computes the value of the chart output y based on the size and value of the chart input u.
- If
uis a scalar, the function assigns toya scalar value of zero. - If
uis a column vector, the function computes of the sine of each of its elements and stores them iny. - If
uis a row vector, the function computes of the cosine of each of its elements and stores them iny. - If
uis a matrix, the function computes of the square root of each of its elements and stores them iny.
In each case, the value of the output y has the same size as the input u.
function computeOutput(key) %#codegen switch key case 0 % scalar y = 0; case 1 % column vector y = sin(u); case 2 % row vector y = cos(u); case 3 % matrix y = sqrt(u); end end
Simulate the Model
The tabs located above the Explorer Bar enable you to switch between the Simulink model and the two Stateflow charts. During simulation:
- The chart animations show the active state for each chart cycling between the
Scalar,ColumnVector,RowVector, andVectorPartial, andMatrixstates. - In the Simulink model, the display blocks
Signal SourceandProcessed Signalperiodically show between one and eight values for the variable-size signals. - The display block
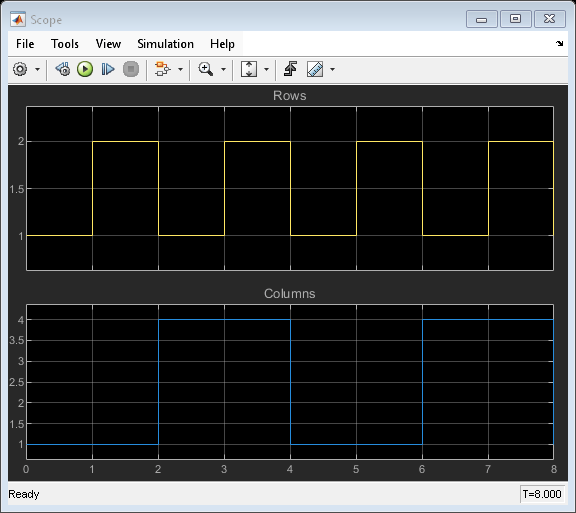
Size of Signaland the Scope block show the number of rows and columns in the variable-size signals.