Execute Stateflow Chart Objects Through Scripts and Models - MATLAB & Simulink (original) (raw)
Main Content
A standalone Stateflow® chart is a MATLAB® class that defines the behavior of a finite state machine. Standalone charts implement classic chart semantics with MATLAB as the action language. You can program the chart by using the full functionality of MATLAB, including those functions that are restricted for code generation in Simulink®. For more information, see Create Stateflow Charts for Execution as MATLAB Objects.
This example shows how to execute a standalone Stateflow chart by using a MATLAB script or a Simulink model.
Count Ways to Make Change for Currency
The file sf_change.sfx defines a standalone Stateflow chart that counts the number of ways to make change for a given amount of money. The chart contains these data objects:
xis the amount of money to change. The default value is 100.coinValuesis a vector of coin denominations arranged in increasing order.coinNamesis an array of corresponding coin names. The default values represent standard American coins (pennies, nickels, dimes, and quarters).tallyis the number of valid change configurations.tabulais an array containing the different valid change configurations.chg,done,i, andnare local data used by the change-counting algorithm.textWidthandquietModeare local data that control how the chart displays its results.
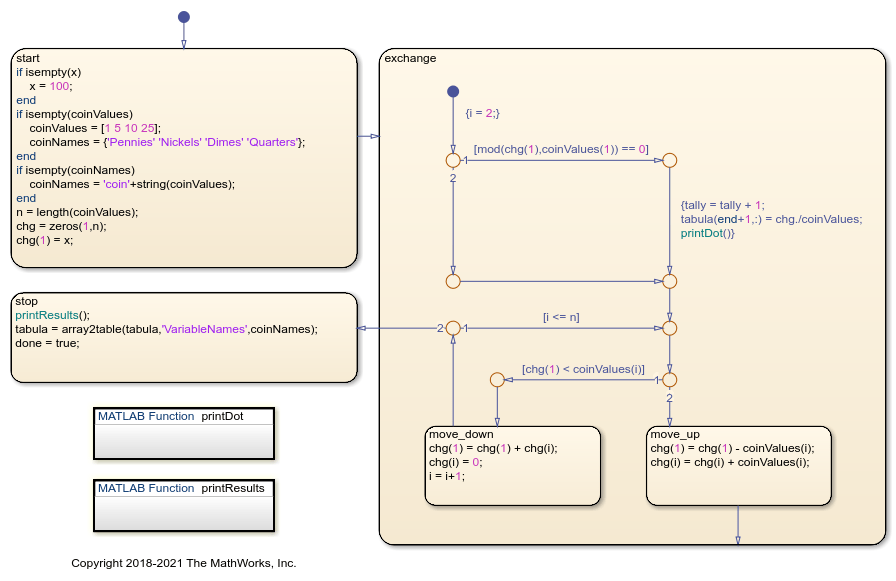
The chart begins with a potential change configuration consisting entirely of the lowest-value coins, specified by an index of 1. At each execution step, the state exchange modifies this configuration in one of two ways:
The substate
move_upexchanges some lowest-value coins for a coin with a higher value, specified by the indexi.The substate
move_downexchanges all of the coins with the value specified by the indexifor lowest-value coins. Thenmove_upexchanges some lowest-value coins for a coin with a value specified by the indexi+1or higher.
A potential change configuration is valid when the number of cents represented by the lowest-value coins is divisible by the value of that type of coin. When the chart encounters a new valid configuration, it increments tally and appends the new configuration to tabula.
When no more coin exchanges are possible, the state stop becomes active. This state prints the results of the computation, transforms the contents of tabula to a table, and sets the value of done to true.
Execute Standalone Chart in a MATLAB Script
To run the change-counting algorithm to completion, you must execute the standalone chart multiple times. For example, the MATLAB script sf_change_script.m creates a chart objectchartObj and initializes the value of the local datax to 27. The configuration option'-warningOnUninitializedData', which the script sets tofalse, eliminates the warning that tabula is an empty array in the new chart object. The while loop executes the chart until the local data done becomestrue. Finally, the script displays the value oftabula.
chartObj = sf_change('-warningOnUninitializedData',false,x=27);
while ~chartObj.done step(chartObj); end
disp(chartObj.tabula)
When you run this script, the standalone chart calculates the number of ways to make change for 27 cents by using standard American coins:
............. There are 13 ways to make change for 27 cents. Pennies Nickels Dimes Quarters _______ _______ _____ ________
  27          0         0         0
  22          1         0         0
  17          2         0         0
  12          3         0         0
   7          4         0         0
   2          5         0         0
  17          0         1         0
  12          1         1         0
   7          2         1         0
   2          3         1         0
   7          0         2         0
   2          1         2         0
   2          0         0         1
To determine the number of ways to make change for a different amount, or to use a different system of currency, change the values of x andcoinValues. For example, to use British currency, initializecoinValues to [1 2 5 10 20 25 50].
Execute Standalone Chart by Using Simulink Model
You can execute a standalone Stateflow chart from within a Simulink model. For example, the model sf_change_model contains two Stateflow charts that use the standalone chart sf_change to count the number of ways to make change for 27 cents in two different currency systems. You can simulate the model, but the functions that execute the standalone chart do not support code generation.
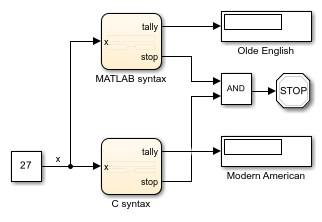
Each chart contains these states:
Initializecreates a local chart objectchartObjthat implements the change-counting algorithm for the input valuex.Executecalls thestepfunction to execute the standalone chart and stores the result as the output datatally.Finishdisplays the results of the algorithm in the Diagnostic Viewer window and sets the value of the output datadonetotrue.
When both charts reach their respective Finish state, the simulation of the model stops and the Display blocks show the final values of the two tallies.
Execution Using MATLAB as the Action Language
The chart MATLAB syntax uses MATLAB as the action language. To execute the standalone Stateflow chart, this chart must follow these guidelines:
The local variable
chartObjthat contains the handle to the chart object has typeInherit: From definition in chart.Before creating the chart object, the
Initializestate calls thecoder.extrinsicfunction to declaresf_changeas an extrinsic function that is restricted for code generation in Simulink. See Call Extrinsic MATLAB Functions in Stateflow Charts.The
ExecuteandFinishstates access the local data for the standalone chart by calling thegetfunction.
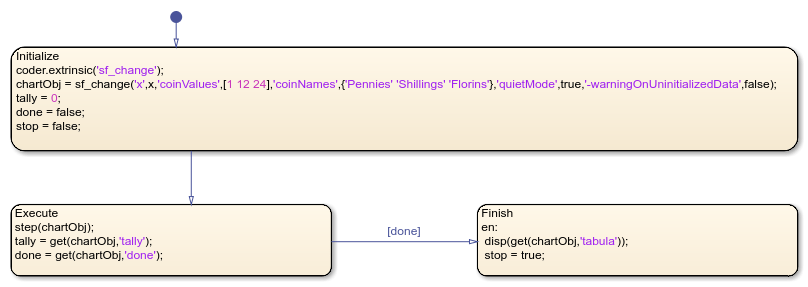
When you simulate this chart with an input of x = 27, the Display block Olde English shows a tally of 4. The Diagnostic Viewer window shows these results:
Pennies Shillings Florins
 27           0           0
 15           1           0
  3           2           0
  3           0           1
Execution Using C as the Action Language
The chart C syntax uses C as the action language. To execute the standalone Stateflow chart, this chart must follow these guidelines:
The local variable
chartObjthat contains the handle to the chart object has typeml.The
Initializestate calls themlfunction to create the chart object.The
ExecuteandFinishstates use themlnamespace operator to access thestep,get, anddisplfunctions to execute the standalone chart, access its local data, and display the results of the algorithm.
For more information, see Access MATLAB Functions and Workspace Data in C Charts.
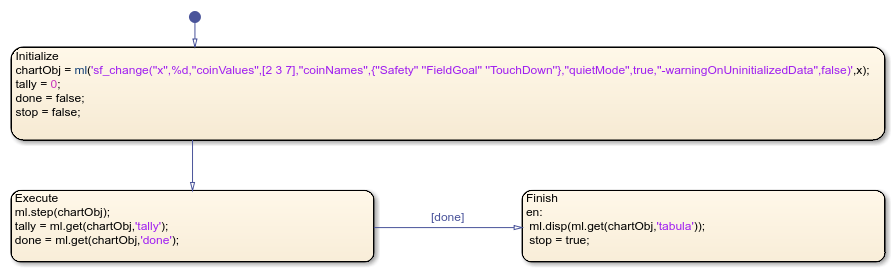
When you simulate this chart with an input of x = 27, the Display block Modern American shows a tally of 13. The Diagnostic Viewer window shows these results:
Safety FieldGoal TouchDown
 12          1            0
  9          3            0
  6          5            0
  3          7            0
  0          9            0
 10          0            1
  7          2            1
  4          4            1
  1          6            1
  5          1            2
  2          3            2
  3          0            3
  0          2            3