Navigating the viewer (original) (raw)
This guide will familiarize you with the basics of using the Rerun Viewer with an example dataset. By the end you should be comfortable with the following topics:
Here is a preview of the dataset that we will be working with:
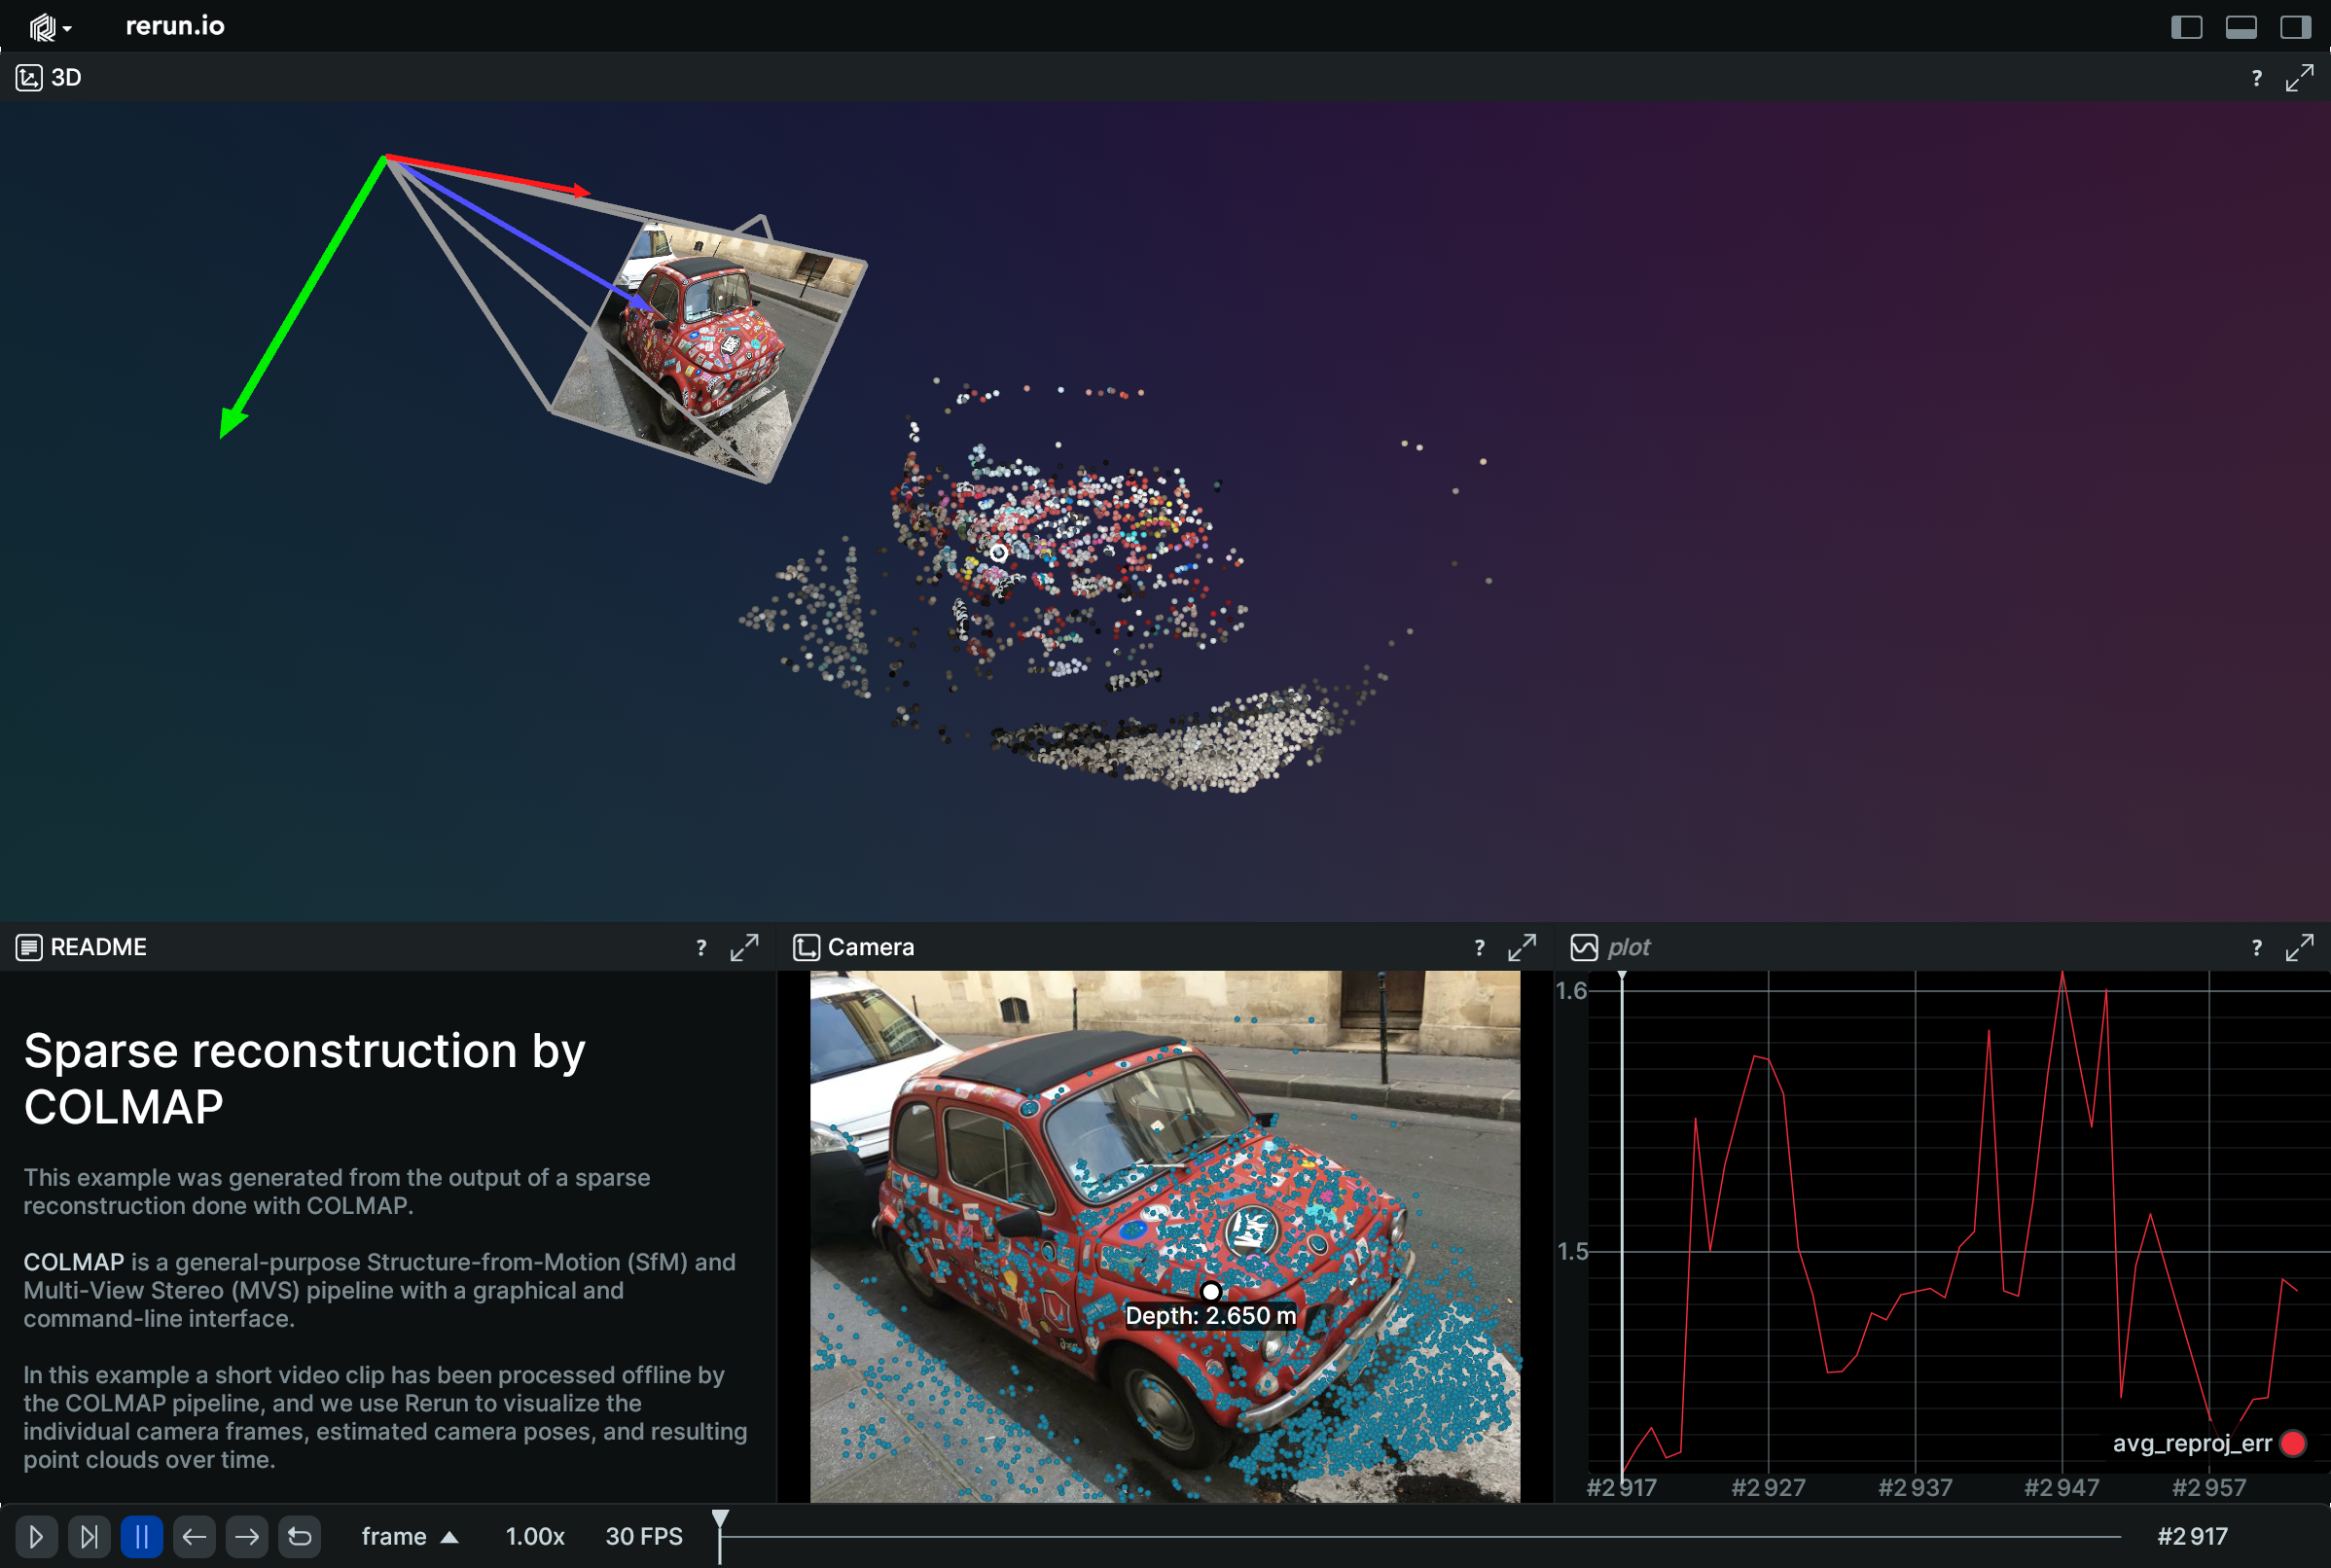
The demo uses the output of the COLMAP structure-from-motion pipeline on a small dataset. Familiarity with structure-from-motion algorithms is not a prerequisite for following the guide. All you need to know is that at a very high level, COLMAP processes a series of images, and by tracking identifiable "keypoints" from frame to frame, it is able to reconstruct both a sparse representation of the scene as well as the positions of the camera used to take the images.
Prerequisites prerequisites
Although the Rerun SDK is available in both Python and Rust, this walkthrough makes use the Python installation. Even if you plan to use Rerun with Rust, we still recommend having a Rerun Python environment available for quick experimentation and working with examples. You can either follow the Python Quickstart or simply run:
You can also find rerun-sdk on conda.
Launching an example launching-an-example
If you have already followed the Python Quickstart you may have already check the "Helix" integrated example. This time, we will use the "Structure from Motion" example.
Start by running the viewer:
Note: If this is your first time launching Rerun you will see a notification about the Rerun anonymous data usage policy. Rerun collects anonymous usage data to help improve the SDK, though you may choose to opt out if you would like.
This will bring you the Rerun viewer's Welcome screen:
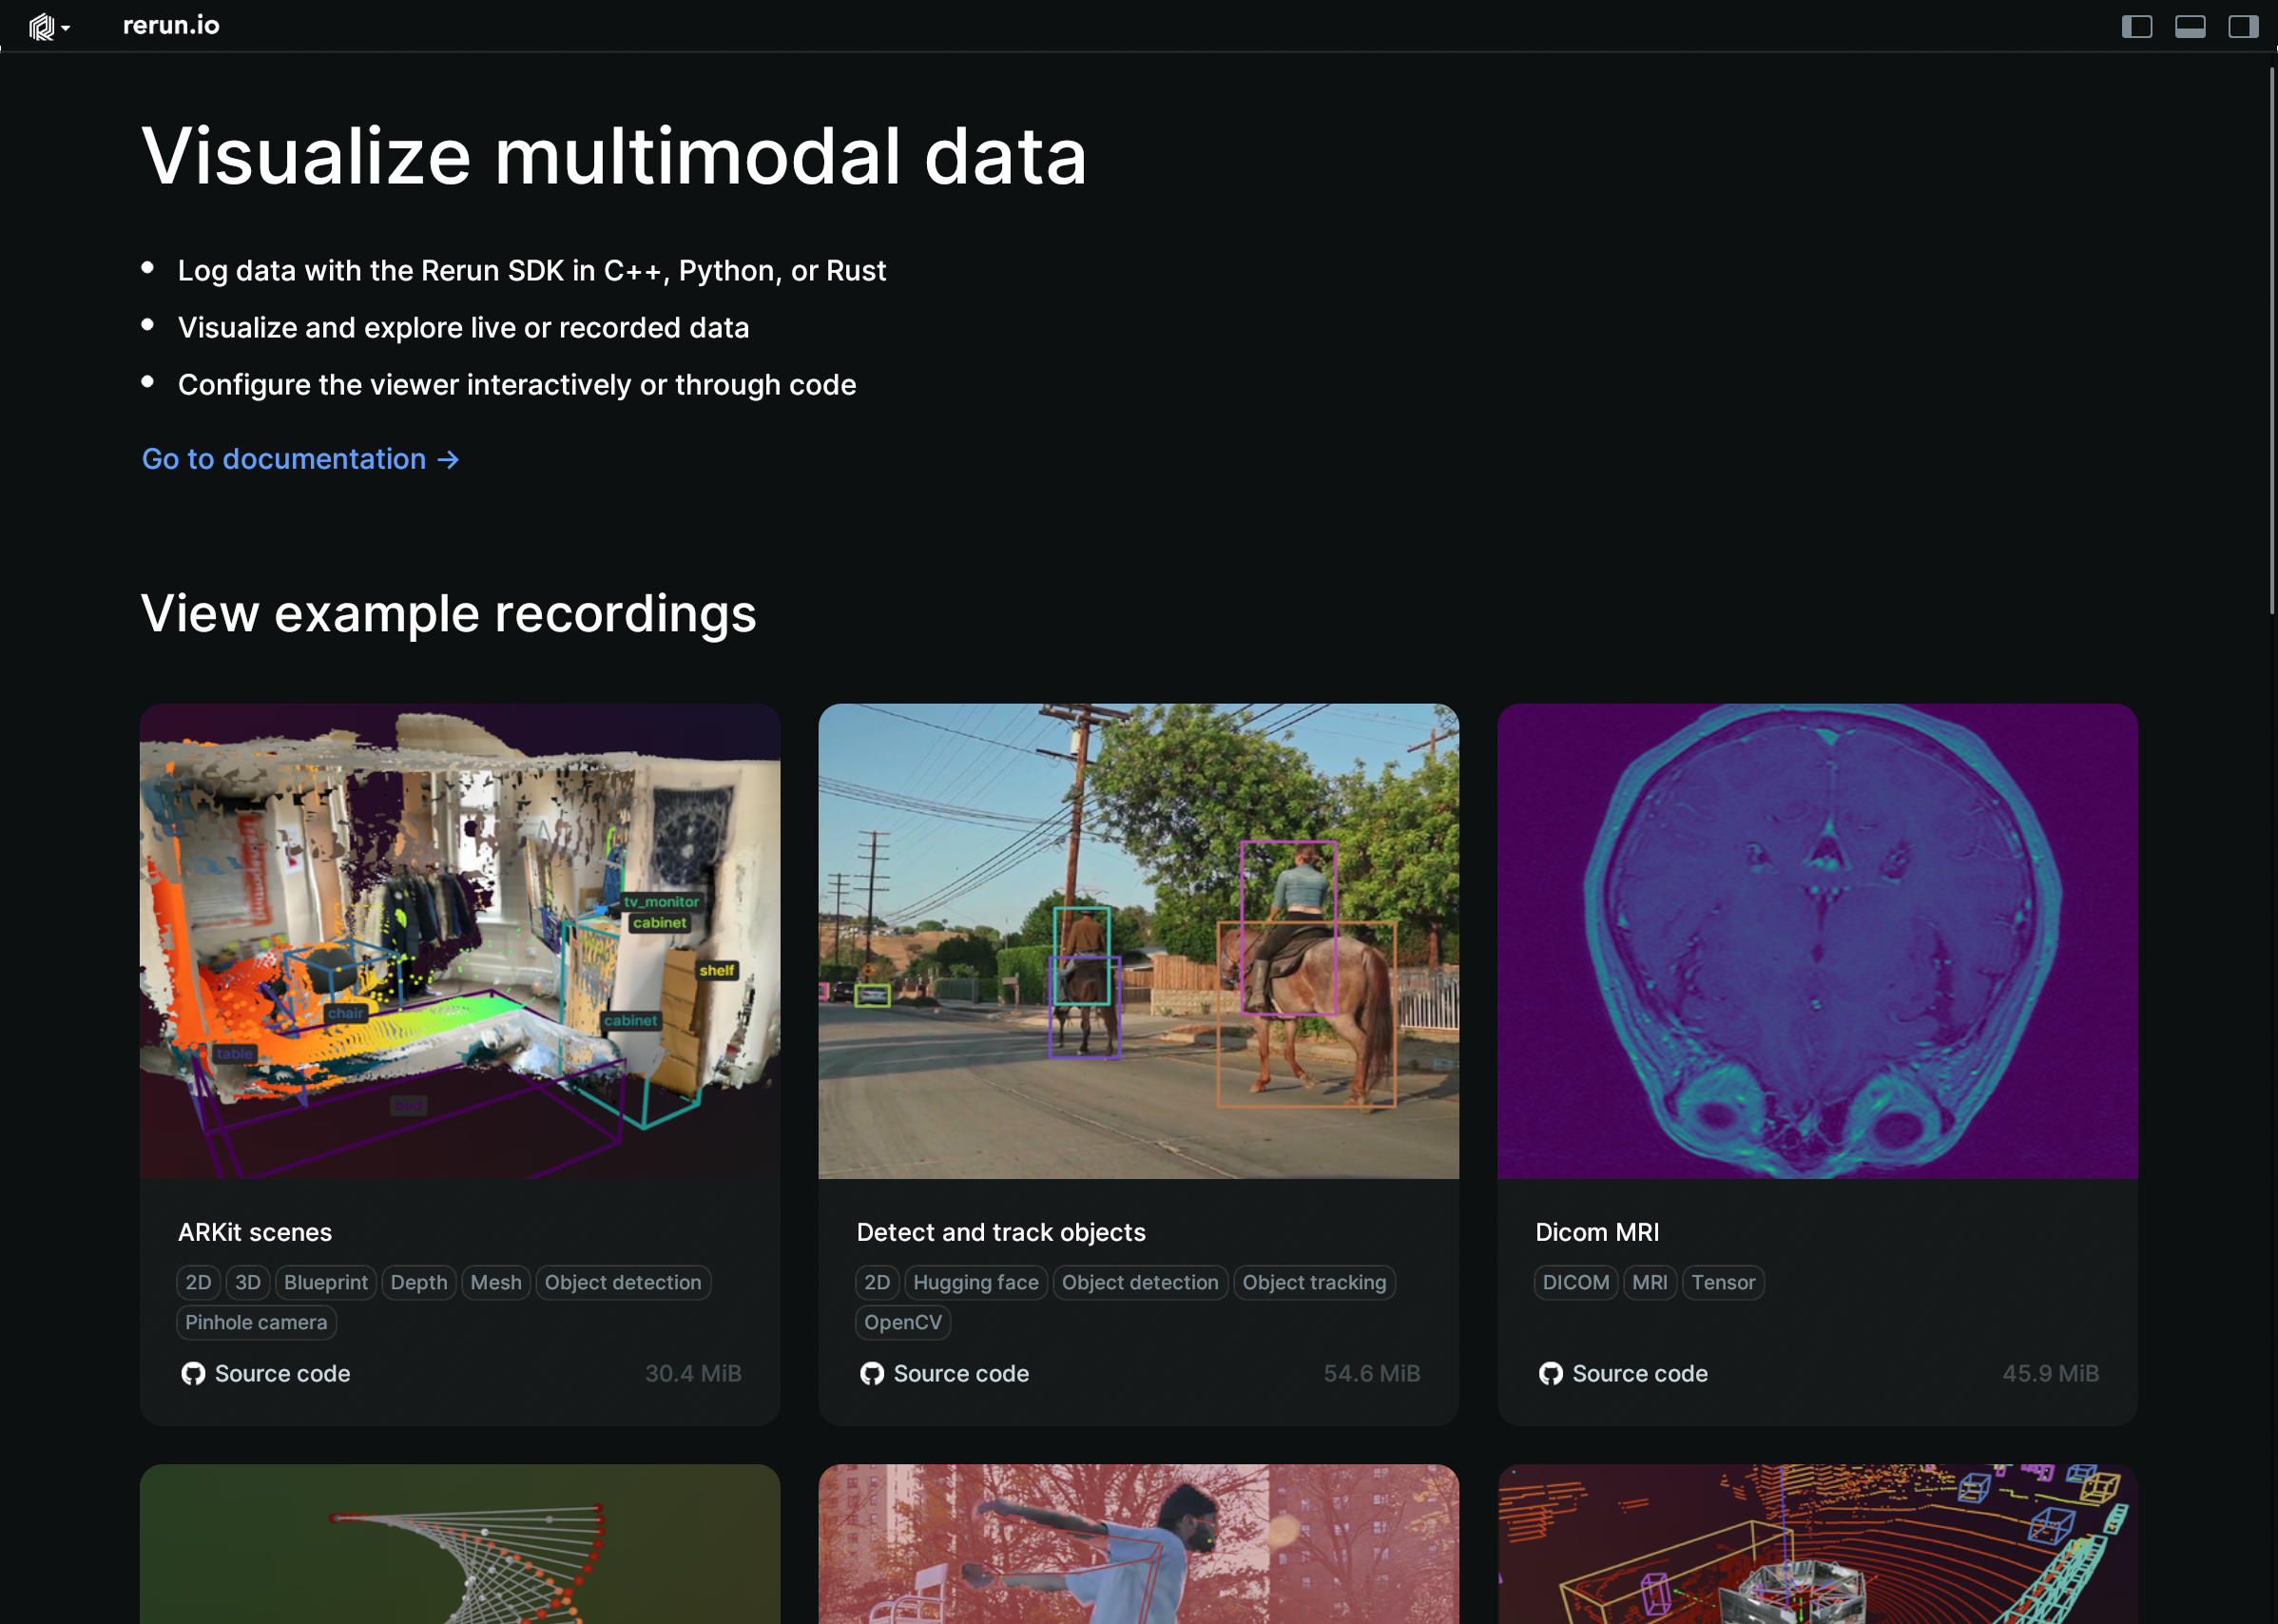
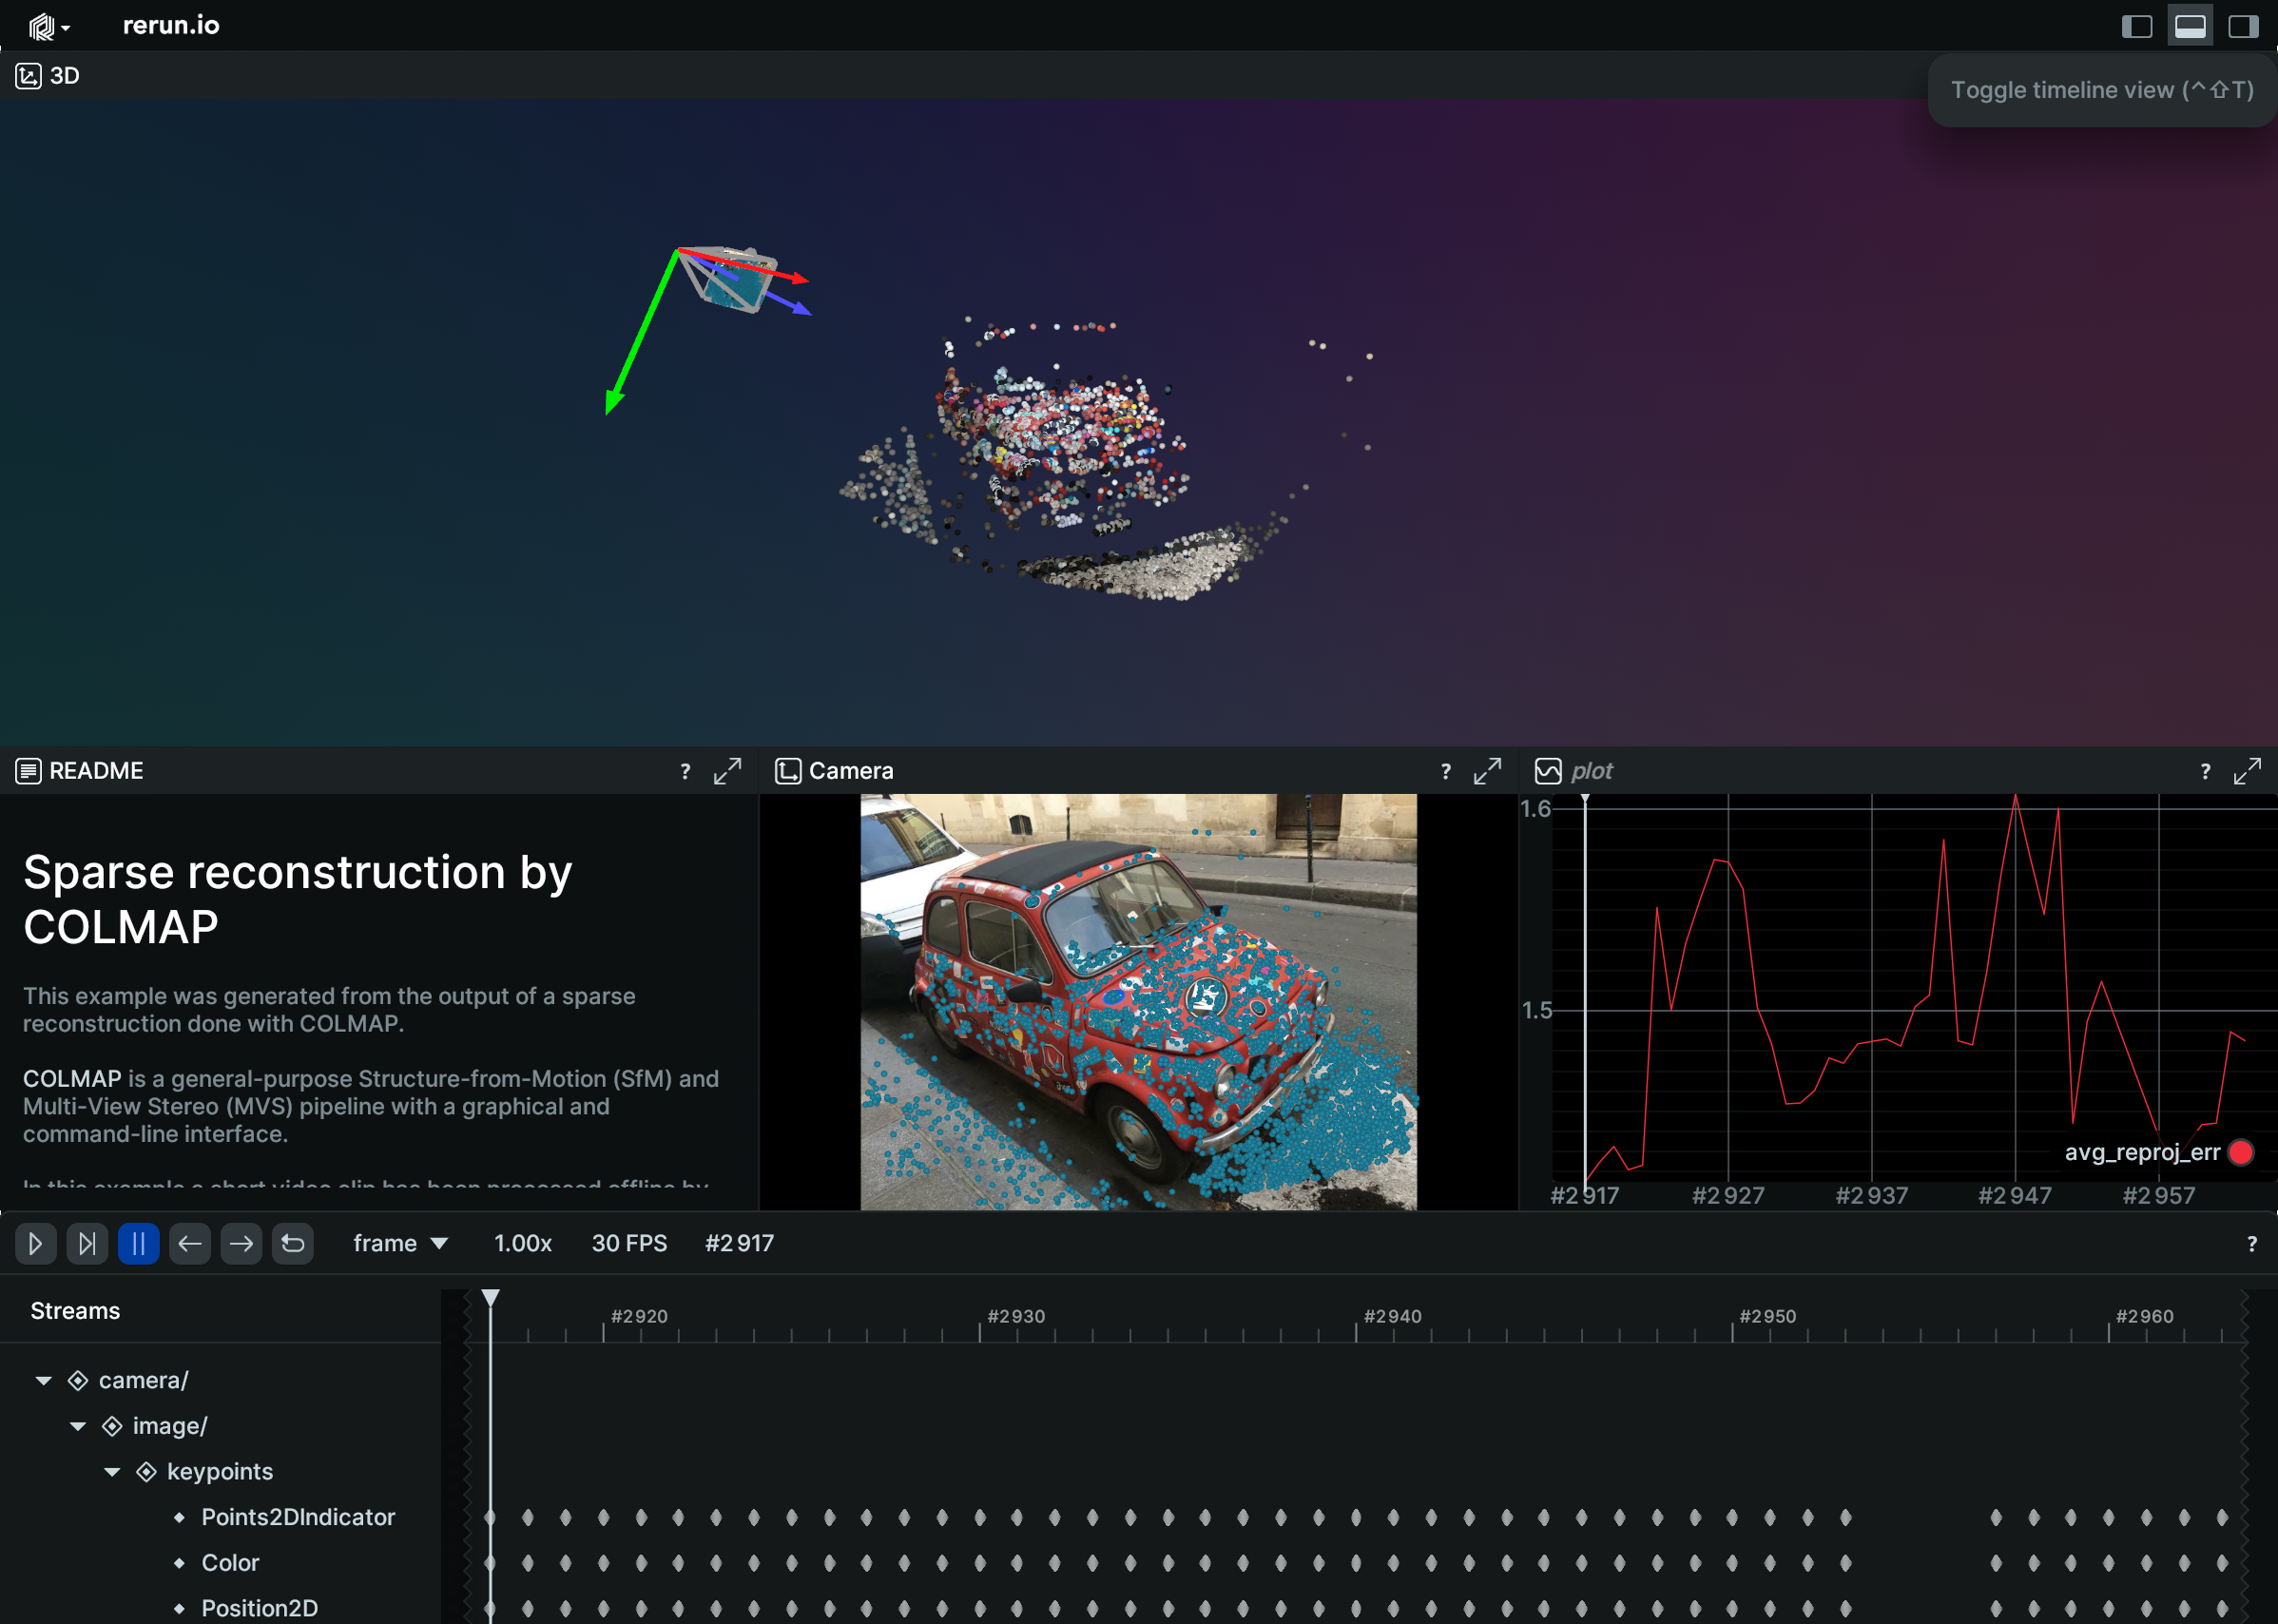
From there you can chose the "Structure from Motion" example. A window that looks like this will appear:
Depending on your display size, the panels may have a different arrangements. Further in this guide you will learn how you can change that.
The Viewer panels the-viewer-panels
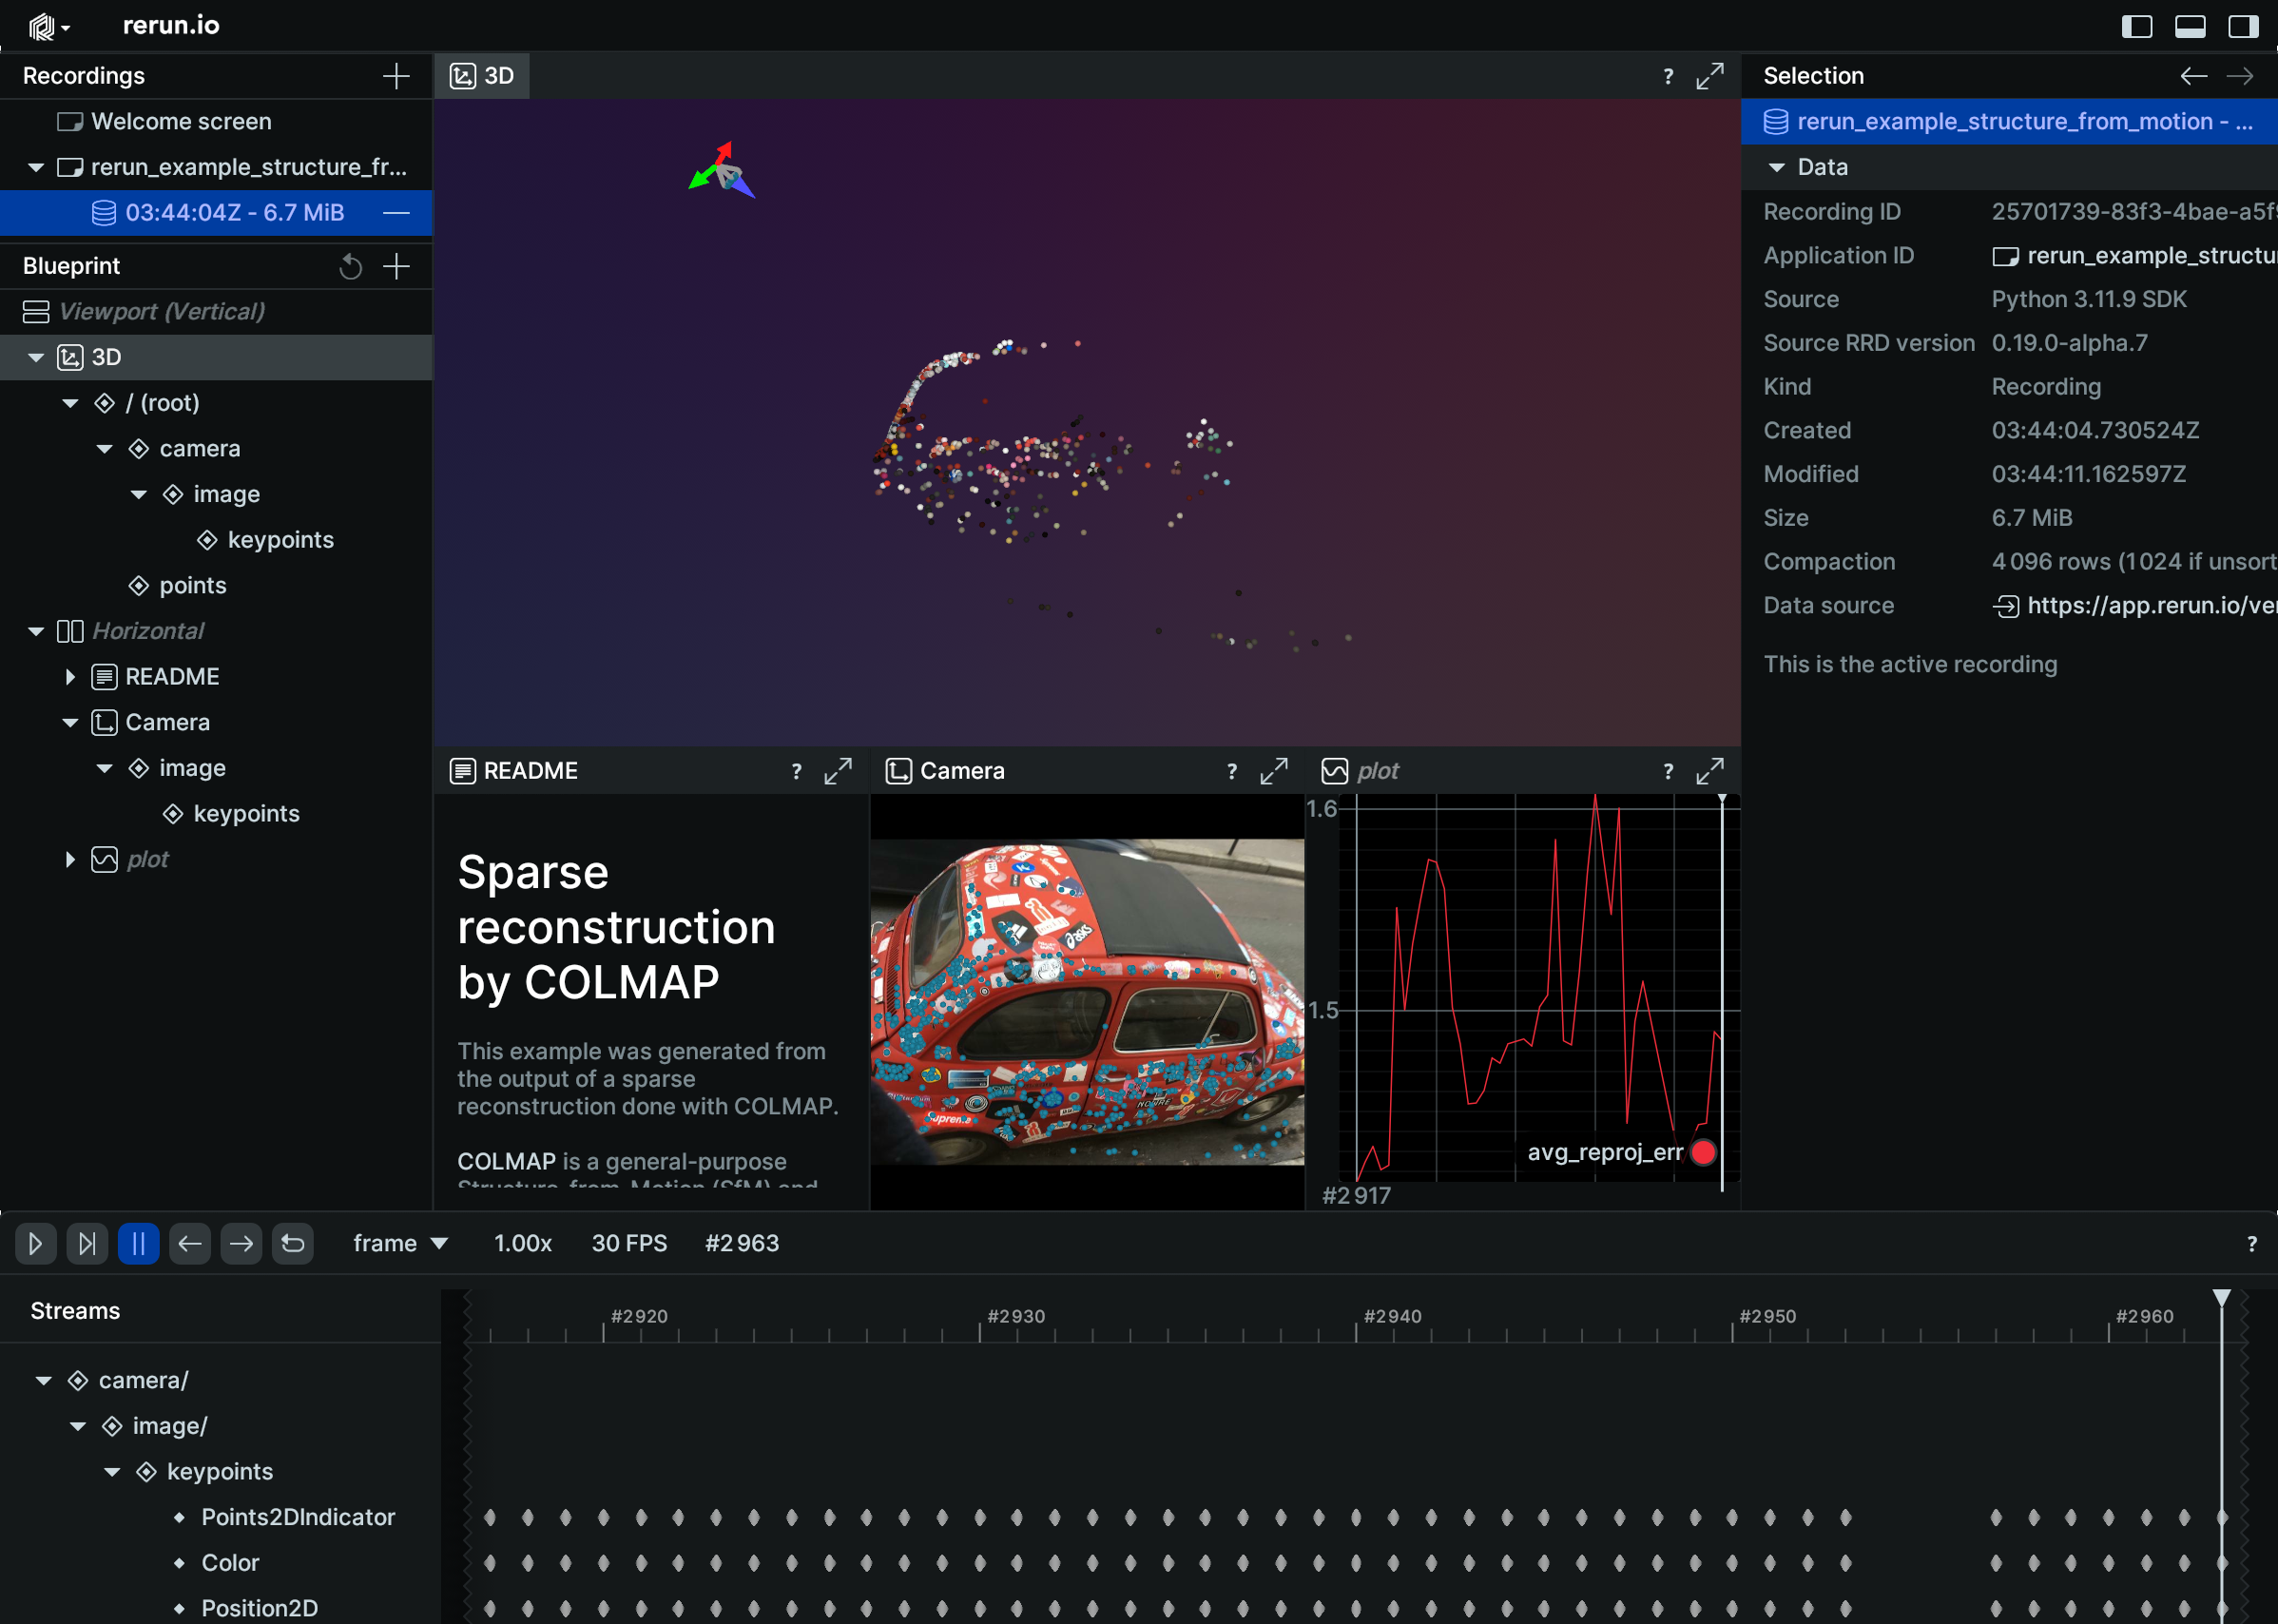
This window has five main sections:
- Viewport (center): Displays the rendered views for your session.
- Recordings panel (top left): Lists loaded recordings and their applications, and allows navigation back to the welcome screen.
- Blueprint panel (below Recordings): Controls the different views.
- Selection panel (right): Shows detailed information and configuration for selected items.
- Timeline panel (bottom): Controls the current point in time being viewed.
Each of the three sides has a button in the upper-right corner. Click these to show or hide the corresponding panels.
There are several ways to rearrange the viewer layout to your liking: through the Viewer user interface, via the Blueprint API, or by loading an .rbl file.
Exploring data exploring-data
In Rerun, data is modeled using entities (essentially objects) that contain batches of componentsthat change over time. Each entity is identified by an entity path, which uses a hierarchical syntax to represent relationships between entities. Let's explore an example of this hierarchy in our scene:
/camera/image/keypointsis an entity stream that contains 3 component streams (Points2DIndicator,Color,Position2D).Points2DIndicatorcomponent indicates that together, they form a Points2D archetype, representing point clouds that were detected and tracked in images.- The images themselves are represented by the parent entity
/camera/image. This entity consist of 6 components: 4 form an Image archetype, while the remaining 2 correspond to a pinhole projection. The images are captures by the camera, and a pinhole projection defines the relationship between 2D and 3D space. - Both the images and pinhole projection are hierarchically dependent on the camera's position, which is described by the
/cameraentity. This entity includes a series of transforms that together form a Transform3D archetype.
The hierarchy of logged entity streams and their component streams is found under Streams in the Timeline panel. A similar list appears in the Blueprint panel, but the key difference is that the Blueprint panel focuses on how data is arranged and visualized in the Viewport, while the Streams panel shows when and what events were logged. In other words, an entity may be logged once but displayed in multiple views.
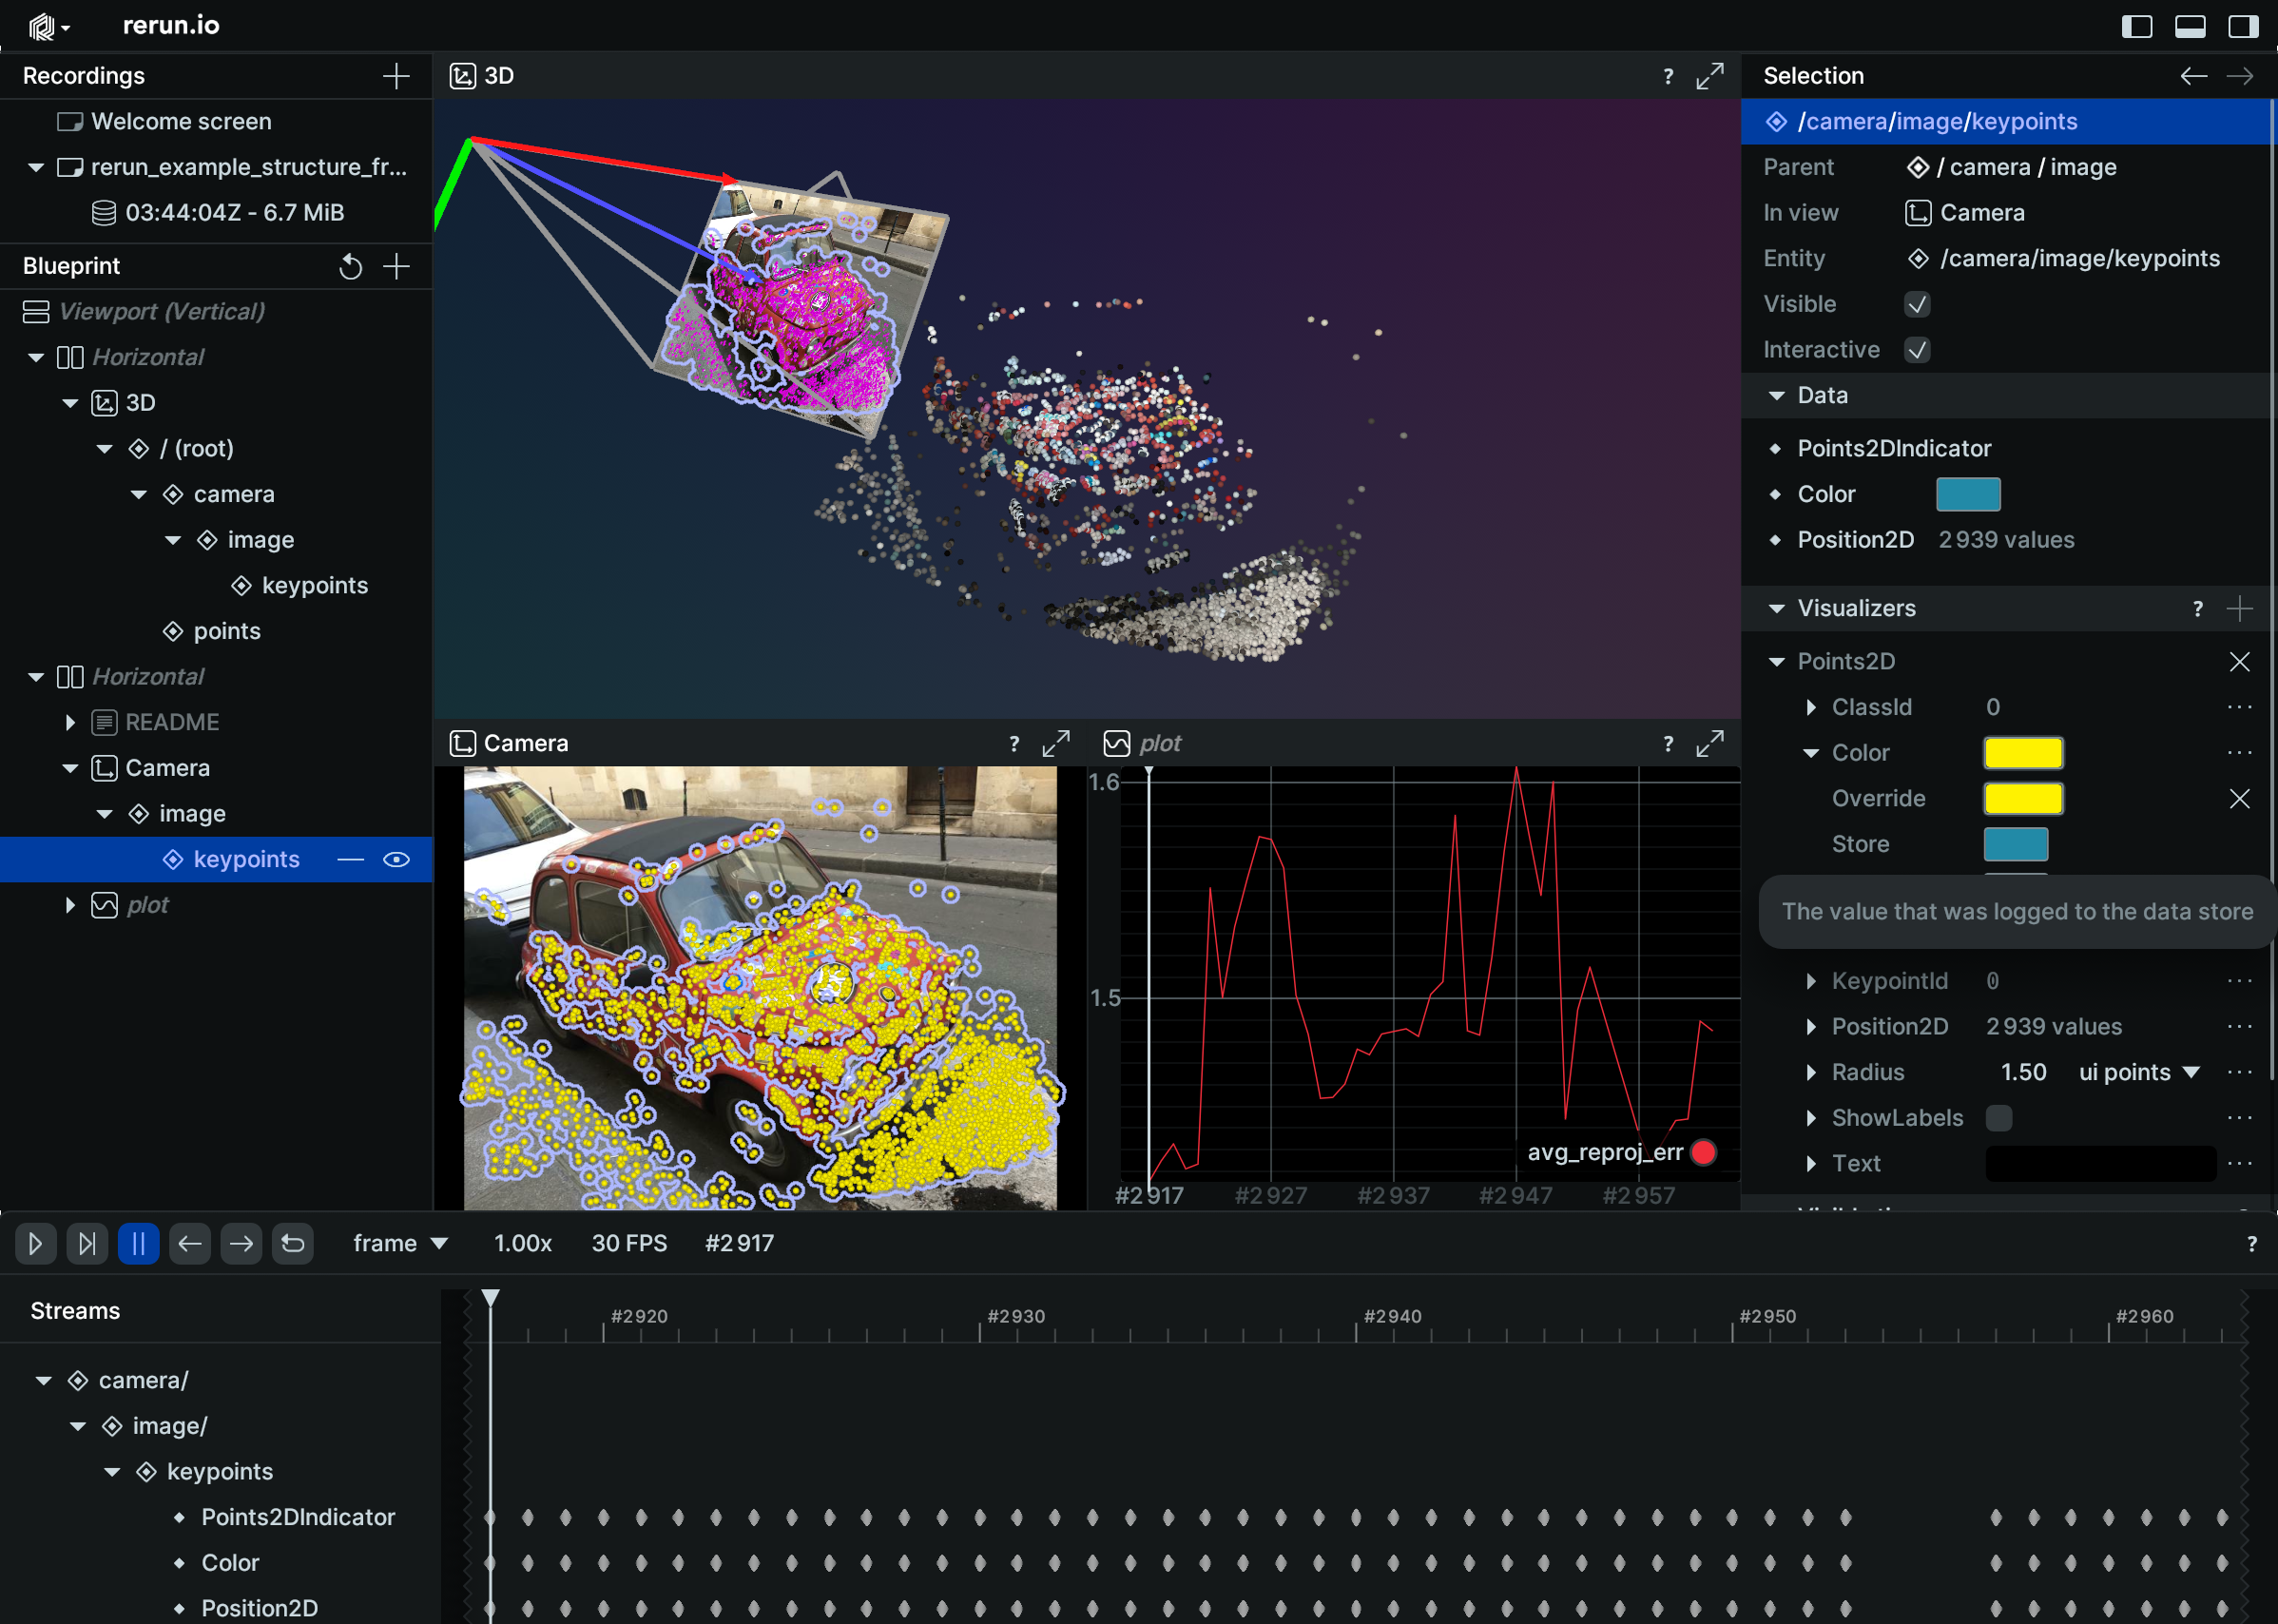
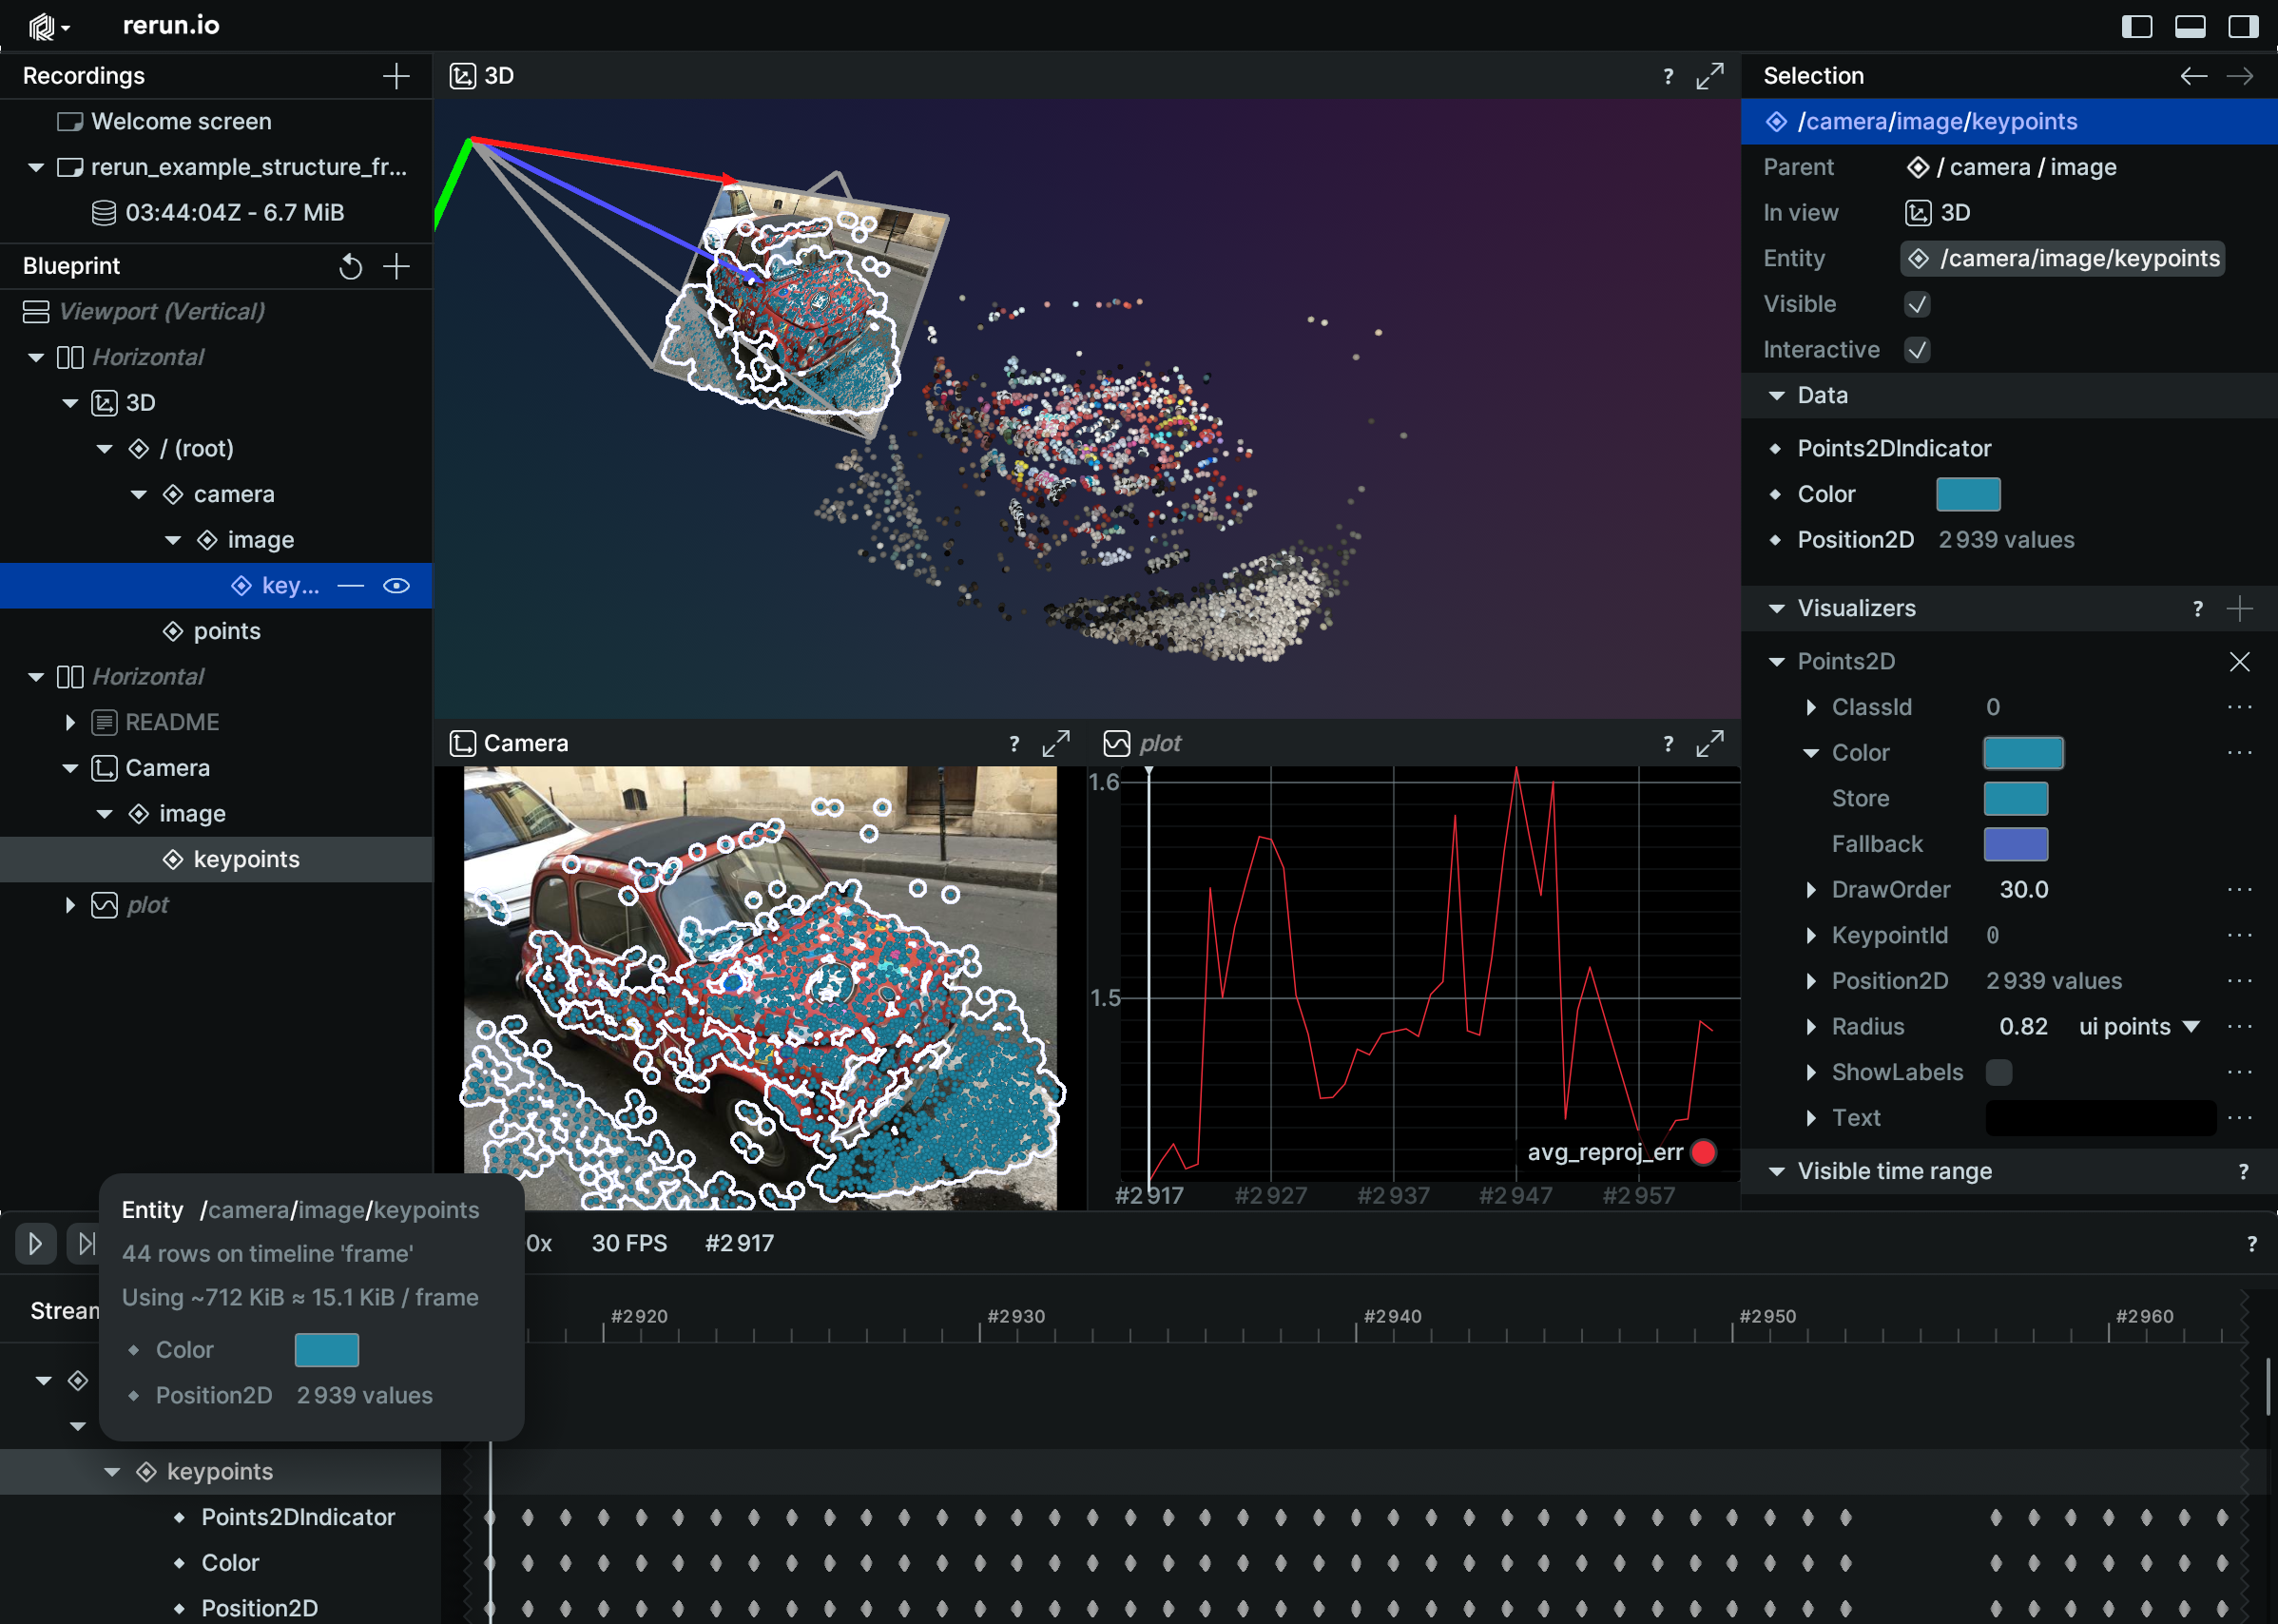
Visualizations can also be customized per each view using Overrides in the Selection panel. In the screenshot below, the same entity keypoints is displayed in different colors: yellow and magenta. This is reflected in Selection > Visualizers > Points2D > Color, where yellow is an overridden value, even though the logged color value was different.
Hover and selection hover-and-selection
You can easily identify which entity mentions and visual representations refer to the same entities across different panels by seeing them simultaneously highlighted in the UI. Hovering over an entity will display a popup with additional information about its content. Clicking on it will reveal more details in the Selection panel.
Try each of the following:
- Hover over the image to see a zoomed-in preview
- Click on the point cloud to select the whole cloud
- With the point cloud selected, hover and click individual points
Rotate, zoom, and pan rotate-zoom-and-pan
Clicking and dragging the contents of any view will move it. You can rotate 3D views, or pan 2D views and plots. You can also zoom using ctrl+scrollwheel or pinch gestures on a trackpad. Most views can be restored to their default state by double-clicking somewhere in the view. Every view has a "?" icon in the upper right hand corner. You can always mouse over this icon to find out more information about the specific view.
Try each of the following:
- Drag the camera image and zoom in on one of the stickers
- Rotate the 3D point cloud
- Right-click and drag a rectangle to see a zoomed-in region of the plot
- Double-click in each of the views to return them to default
Navigating the timeline navigating-the-timeline
If you look at the Timeline panel at the bottom of the window, you will see a series of white dots. Each of those dots represents a piece of data that was logged at a different point in time. In fact, if you hover over the dot, the context popup will give you more information about the specific thing that was logged.
There are several ways to navigate through the timeline:
- Move the time indicator by dragging it to a different point on the timeline. You can also click on the frame number and manually type the desired frame.
- Adjust the playback speed, and for index-based timelines, you can also modify the number of frames per second to specify how indices relate to time.
- Use the play, pause, step, and loop controls to playback Rerun data, similar to how you would with a video file.
Try out the following:
- Use the arrow buttons (or Arrow keys on your keyboard) to step forward and backwards by a single frame
- Click play to watch the data update on its own
- Hit space bar to stop and start the playback
- Hold shift and drag in the timeline to select a region
- Toggle the loop button to playback on a loop of either the whole recording or just the selection
Selecting different timelines selecting-different-timelines
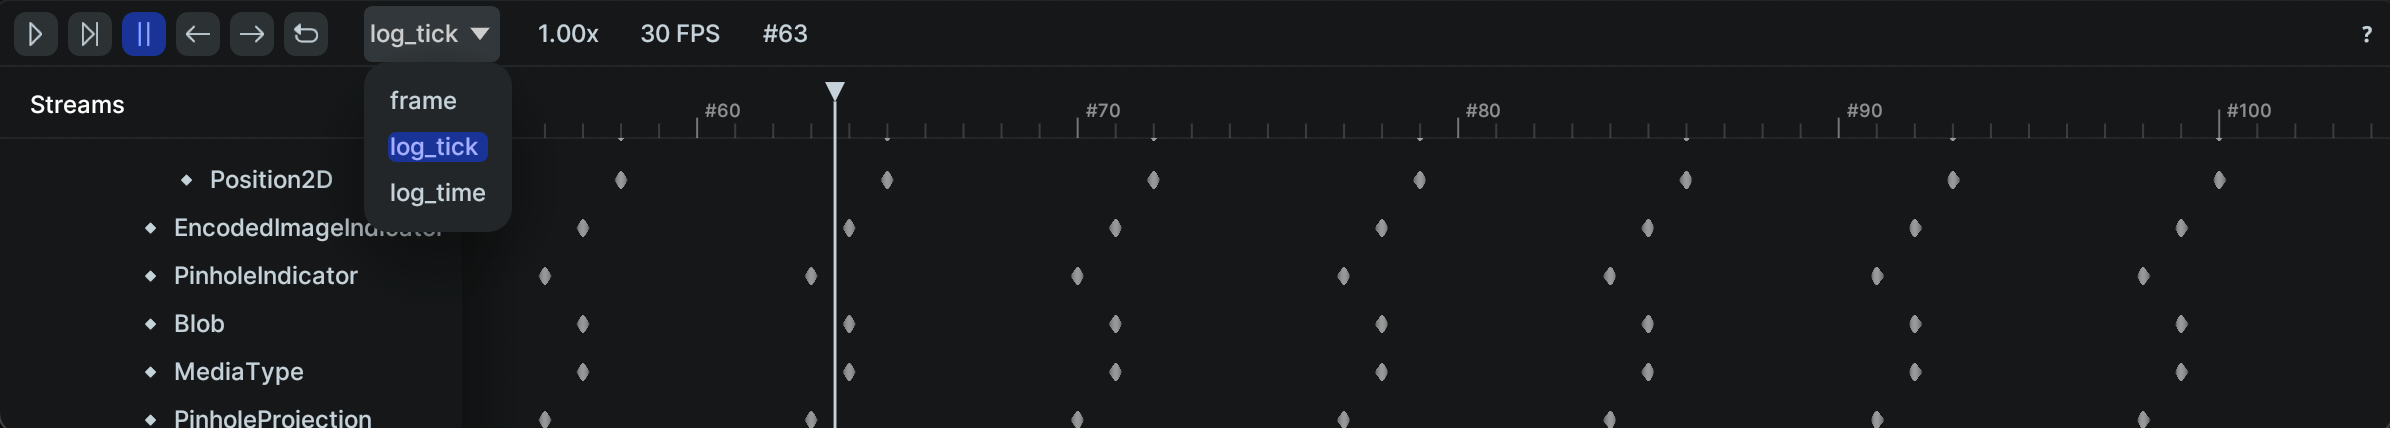
The current view of timeline is showing the data organized by the frame number at which it was logged. Using frame numbers can be a helpful way to synchronize things that may not have been logged at precisely the same time. However, it's possible to also view the data in the specific order that it was logged. Click on the drop-down that says "frame" and switch it to "log_time." If you zoom in on the timeline (using ctrl+scrollwheel), you can see that these events were all logged at slightly different times.
Feel free to spend a bit of time looking at the data across the different timelines. When you are done, switch back to the "frame" timeline and double-click the timeline panel to reset it to the default range.
One thing to notice is there is a gap in the timeline in the "frame" view. This dataset is actually missing a few frames, and the timeline view of frames makes this easy to spot. This highlights the importance of applying meaningful timestamps to your data as you log it. You also aren't limited to frame and log_time. Rerun lets you define your own timelines however you would like. You can read more about timelines here.
Conclusion conclusion
That brings us to the end of this walkthrough. To recap, you have learned how to:
- Install the
rerun-sdkpypi package. - Run the Rerun Viewer using the
reruncommand. - Open the examples integrated in the viewer.
- Work with the Blueprint, Selection and Timeline panels.
- Rearrange view layouts.
- Explore data through hover and selection.
- Change the time selection.
- Switch between different timelines.
Again, if you ran into any issues following this guide, please don't hesitate to open an issue.
Up next up-next
- Get started by writing a program to log data with the Rerun SDK.
- Learn how to further configure the viewer to suit your data.
- Explore other examples of using Rerun.
- Consult the concept overview for more context on the ideas covered here.