Belvidere, Illinois (IL 61008, 61016) profile: population, maps, real estate, averages, homes, statistics, relocation, travel, jobs, hospitals, schools, crime, moving, houses, news, sex offenders (original) (raw)
Submit your own pictures of this city and show them to the world
OSM Map
General Map
Google Map
MSN Map
OSM Map
General Map
Google Map
MSN Map
OSM Map
General Map
Google Map
MSN Map
OSM Map
General Map
Google Map
MSN Map
Please wait while loading the map...
Current weather forecast for Belvidere, IL
Population in 2022: 25,169 (99% urban, 1% rural).
Population change since 2000: +20.9%
| Median resident age: | 39.5 years |
|---|---|
| Illinois median age: | 39.1 years |
Estimated median household income in 2022: 57,914(∗∗itwas∗∗57,914 (it was 57,914(∗∗itwas∗∗42,529 in 2000)
| Belvidere: | $57,914 |
|---|---|
| IL: | $76,708 |
Estimated per capita income in 2022: 29,764(∗∗itwas∗∗29,764 (it was 29,764(∗∗itwas∗∗17,804 in 2000)
Belvidere city income, earnings, and wages data
Estimated median house or condo value in 2022: 146,372(∗∗itwas∗∗146,372 (it was 146,372(∗∗itwas∗∗96,000 in 2000)
| Belvidere: | $146,372 |
|---|---|
| IL: | $251,600 |
Mean prices in 2022: all housing units: 150,612;∗∗detachedhouses:∗∗150,612; detached houses: 150,612;∗∗detachedhouses:∗∗160,734; townhouses or other attached units: 145,624;∗∗in2−unitstructures:∗∗145,624; in 2-unit structures: 145,624;∗∗in2−unitstructures:∗∗200,863; in 5-or-more-unit structures: 106,846;∗∗mobilehomes:∗∗106,846; mobile homes: 106,846;∗∗mobilehomes:∗∗63,541
Median gross rent in 2022: $907.
March 2022 cost of living index in Belvidere: 84.7 (less than average, U.S. average is 100)
Belvidere, IL residents, houses, and apartments details
Percentage of residents living in poverty in 2022: 14.4%
(12.7% for White Non-Hispanic residents, 10.1% for Black residents, 16.7% for Hispanic or Latino residents, 100.0% for American Indian residents, 26.3% for other race residents, 12.7% for two or more races residents)
Detailed information about poverty and poor residents in Belvidere, IL
Business Search - 14 Million verified businesses
- 14,33257.2%White alone
- 9,49037.9%Hispanic
- 5212.1%Two or more races
- 3761.5%Black alone
- 3781.5%Asian alone
- 240.10%Other race alone
Races in Belvidere detailed stats: ancestries, foreign born residents, place of birth
Crime rates in Belvidere by year
| Type | 2010 | 2011 | 2013 | 2014 | 2015 | 2016 | 2017 | 2018 | 2019 | 2022 |
|---|---|---|---|---|---|---|---|---|---|---|
| Murders(per 100,000) | 0(0.0) | 0(0.0) | 3(11.9) | 0(0.0) | 1(4.0) | 0(0.0) | 0(0.0) | 0(0.0) | 0(0.0) | 0(0.0) |
| Rapes(per 100,000) | 21(82.1) | 17(66.2) | 5(19.8) | 13(51.4) | 12(47.6) | 19(75.9) | 11(44.0) | 18(71.7) | 15(59.7) | 2(8.0) |
| Robberies(per 100,000) | 7(27.4) | 8(31.2) | 3(11.9) | 4(15.8) | 9(35.7) | 3(12.0) | 9(36.0) | 2(8.0) | 7(27.8) | 2(8.0) |
| Assaults(per 100,000) | 39(152.4) | 23(89.6) | 18(71.1) | 29(114.7) | 29(115.0) | 43(171.7) | 48(192.1) | 40(159.2) | 42(167.0) | 7(28.0) |
| Burglaries(per 100,000) | 88(344.0) | 78(304.0) | 62(245.0) | 104(411.3) | 48(190.4) | 42(167.7) | 58(232.1) | 51(203.0) | 39(155.1) | 18(72.0) |
| Thefts(per 100,000) | 408(1,595) | 343(1,337) | 300(1,185) | 304(1,202) | 209(828.9) | 227(906.2) | 281(1,124) | 206(820.0) | 202(803.4) | 75(299.9) |
| Auto thefts(per 100,000) | 19(74.3) | 8(31.2) | 13(51.4) | 27(106.8) | 12(47.6) | 11(43.9) | 15(60.0) | 13(51.7) | 17(67.6) | 12(48.0) |
| Arson(per 100,000) | 6(23.5) | 3(11.7) | 0(0.0) | 5(19.8) | 6(23.8) | 6(24.0) | 3(12.0) | 1(4.0) | 1(4.0) | 0(0.0) |
| City-Data.com crime index | 198.2 | 157.5 | 126.0 | 154.2 | 130.0 | 150.1 | 150.5 | 142.7 | 137.9 | 35.3 |
The City-Data.com crime index weighs serious crimes and violent crimes more heavily. Higher means more crime, U.S. average is 246.1. It adjusts for the number of visitors and daily workers commuting into cities.
Click on a table row to update graph
Full-time law enforcement employees in 2012, including police officers: 44 (41 officers - 37 male; 4 female).
| Officers per 1,000 residents here: | 1.60 |
|---|---|
| Illinois average: | 2.76 |
Latest news from Belvidere, IL collected exclusively by city-data.com from local newspapers, TV, and radio stations
Ancestries: German (11.9%), Italian (4.4%), English (3.2%), Irish (3.2%), Norwegian (2.3%), Swedish (2.1%).
Current Local Time: CST time zone
Incorporated on 05/30/1881
Elevation: 770 feet
Land area: 9.07 square miles.
Population density: 2,775 people per square mile (average).
4,106 residents are foreign born (14.3% Latin America).
| This city: | 16.4% |
|---|---|
| Illinois: | 14.1% |
Median real estate property taxes paid for housing units with mortgages in 2022: $3,208 (2.0%)
Median real estate property taxes paid for housing units with no mortgage in 2022: $2,799 (2.1%)
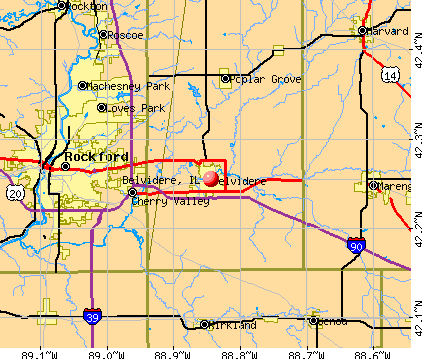
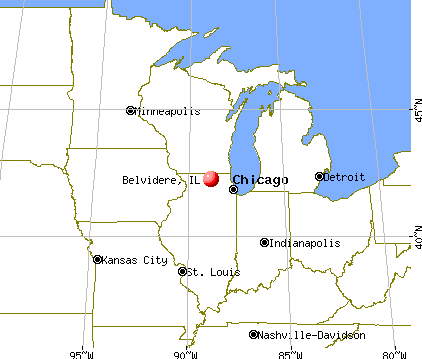
Nearest city with pop. 50,000+: Rockford, IL (11.6 miles , pop. 150,115).
Nearest city with pop. 200,000+: Madison, WI (63.2 miles , pop. 208,054).
Nearest city with pop. 1,000,000+: Chicago, IL (66.3 miles , pop. 2,896,016).
Nearest cities:
Caledonia, IL (2.9 miles),
Latitude: 42.25 N**, Longitude:** 88.84 W
Daytime population change due to commuting: -864 (-3.5%)
Workers who live and work in this city: 4,449 (35.8%)
Area code: 815
Belvidere, Illinois accommodation & food services, waste management - Economy and Business Data
Single-family new house construction building permits:
- 2022: 103 buildings , average cost: $160,700
- 2021: 61 buildings , average cost: $153,400
- 2020: 6 buildings , average cost: $117,800
- 2019: 9 buildings , average cost: $115,200
- 2018: 7 buildings , average cost: $99,300
- 2017: 14 buildings , average cost: $99,400
- 2016: 8 buildings , average cost: $157,900
- 2014: 5 buildings , average cost: $157,900
- 2013: 12 buildings , average cost: $291,500
- 2012: 21 buildings , average cost: $117,400
- 2011: 4 buildings , average cost: $117,300
- 2010: 8 buildings , average cost: $138,000
- 2009: 12 buildings , average cost: $260,100
- 2008: 14 buildings , average cost: $252,700
- 2007: 106 buildings , average cost: $204,900
- 2006: 196 buildings , average cost: $189,000
- 2005: 200 buildings , average cost: $143,000
- 2004: 202 buildings , average cost: $130,300
- 2003: 171 buildings , average cost: $146,700
- 2002: 160 buildings , average cost: $125,600
- 2001: 232 buildings , average cost: $116,400
- 2000: 152 buildings , average cost: $121,500
- 1999: 169 buildings , average cost: $106,500
- 1998: 95 buildings , average cost: $105,600
- 1997: 80 buildings , average cost: $96,700
Unemployment in December 2023:
Population change in the 1990s: +4,919 (+30.9%).
Most common industries in Belvidere, IL (%)
- Accommodation & food services (7.5%)
- Health care (7.0%)
- Metal & metal products (6.3%)
- Transportation equipment (5.0%)
- Construction (4.9%)
- Machinery (4.6%)
- Educational services (4.5%)
Most common occupations in Belvidere, IL (%)
- Metal workers and plastic workers (7.1%)
- Other production occupations, including supervisors (7.0%)
- Assemblers and fabricators (6.1%)
- Material recording, scheduling, dispatching, and distributing workers (4.4%)
- Laborers and material movers, hand (4.1%)
- Building and grounds cleaning and maintenance occupations (3.7%)
- Other office and administrative support workers, including supervisors (3.3%)
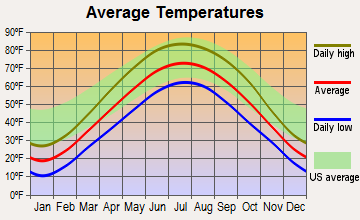
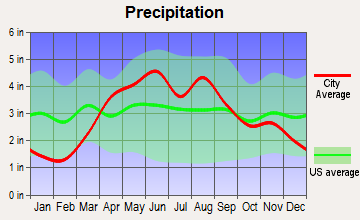
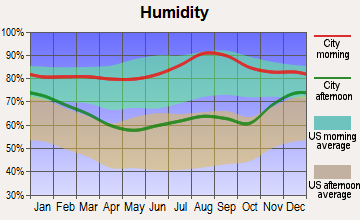
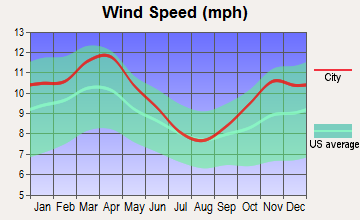
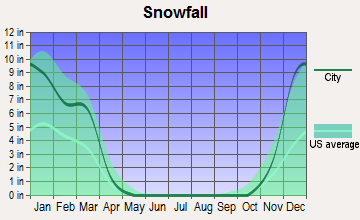
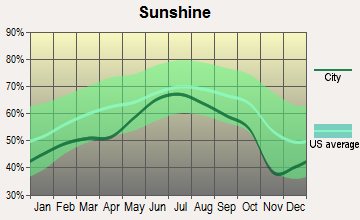
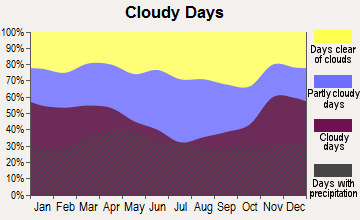
Average climate in Belvidere, Illinois
Based on data reported by over 4,000 weather stations
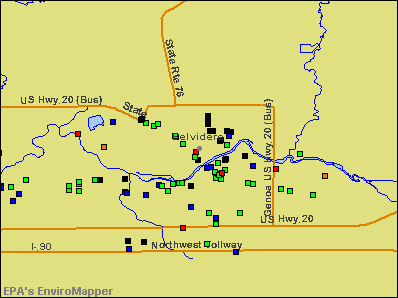
Air pollution and air quality trends (lower is better)
Air Quality Index (AQI) level in 2023 was 94.4**. This is worse than average.**
Tornado activity:
Belvidere-area historical tornado activity is slightly below Illinois state average. It is 48% greater than the overall U.S. average.
On 4/21/1967**, a** category F4 (max. wind speeds 207-260 mph) tornado 4.6 miles away from the Belvidere city center killed 24 people and injured 450 people and caused between 50,000∗∗and∗∗50,000 and 50,000∗∗and∗∗500,000 in damages.
On 4/11/1965**, a** category F4 tornado 23.9 miles away from the city center killed 6 people and injured 75 people.
Earthquake activity:
Belvidere-area historical earthquake activity is significantly above Illinois state average. It is 51% greater than the overall U.S. average.
On 4/18/2008 at 09:36:59**, a magnitude** 5.4 (5.1 MB**,** 4.8 MS**,** 5.4 MW**,** 5.2 MW**, Class:** Moderate**, Intensity:** VI - VII) earthquake occurred 267.8 miles away from the city center
On 6/28/2004 at 06:10:52**, a magnitude** 4.2 (4.2 MW**, Depth:** 6.2 mi**, Class:** Light**, Intensity:** IV - V) earthquake occurred 55.0 miles away from Belvidere center
On 6/10/1987 at 23:48:54**, a magnitude** 5.1 (4.9 MB**,** 4.4 MS**,** 4.6 MS**,** 5.1 LG) earthquake occurred 242.8 miles away from Belvidere center
On 4/18/2008 at 09:36:59**, a magnitude** 5.2 (5.2 MW**, Depth:** 8.9 mi) earthquake occurred 267.9 miles away from Belvidere center
On 2/10/2010 at 09:59:35**, a magnitude** 3.8 (3.8 MW**, Depth:** 6.2 mi**, Class:** Light**, Intensity:** II - III) earthquake occurred 26.6 miles away from the city center
On 6/18/2002 at 17:37:15**, a magnitude** 5.0 (4.3 MB**,** 4.6 MW**,** 5.0 LG) earthquake occurred 300.5 miles away from the city center
Magnitude types: regional Lg-wave magnitude (LG), body-wave magnitude (MB), surface-wave magnitude (MS), moment magnitude (MW)
Natural disasters:
The number of natural disasters in Boone County (10) is smaller than the US average (15).
Major Disasters (Presidential) Declared: 4
Emergencies Declared: 5
Causes of natural disasters: Floods: 2**, Snows:** 2**, Snowstorms:** 2**, Storms:** 2**, Winter Storms:** 2**, Blizzard:** 1**, Hurricane:** 1**, Tornado:** 1**, Other:** 1 (Note: some incidents may be assigned to more than one category).
Hospitals and medical centers in Belvidere:
- NORTHWEST SUBURBAN COMMUNITY HOSPITAL (1625 S STATE ST)
- SAINT JOSEPH HOSPITAL (1005 JULIEN ST)
- HOME BRIDGE CENTER (1701 WEST 5TH AVENUE)
- MAPLE CREST CARE CENTRE (4452 SQUAW PRAIRIE ROAD)
- NORTHWOODS CARE CENTRE (2250 PEARL STREET)
- SAINT JOSEPH HOSPITAL SKILLED CR UNIT (1005 JULIEN ST)
Airports located in Belvidere:
- Bob Walberg Field Airport (IL36) (**Runways: 1)
- Henderson Airport (IL34) (**Runways: 1)
- Kaufield Airport (0LL0) (**Runways: 1)
- Untied Acres Airport (IS83) (**Runways: 1)
- Mc Curdy Strip Airport (LL90) (**Runways: 1) See details about airports located in Belvidere**,** IL
Amtrak stations near Belvidere:
- 8 miles: ROCKFORD (7559 WALTON ST.) - Bus Station . Services: enclosed waiting area, public restrooms, public payphones, paid short-term parking, paid long-term parking, call for taxi service.
- 20 miles: BELOIT (HWY. 75 & HWY. 51) - Bus Station . Services: call for taxi service.
Colleges/universities with over 2000 students nearest to Belvidere:
- Rock Valley College (about 9 miles; Rockford, IL; Full-time enrollment: 6,269)
- Kishwaukee College (about 22 miles; Malta, IL; FT enrollment: 3,356)
- Northern Illinois University (about 23 miles; Dekalb, IL; FT enrollment: 18,126)
- McHenry County College (about 25 miles; Crystal Lake, IL; FT enrollment: 4,886)
- Elgin Community College (about 32 miles; Elgin, IL; FT enrollment: 8,173)
- Waubonsee Community College (about 38 miles; Sugar Grove, IL; FT enrollment: 7,698)
- University of Wisconsin-Whitewater (about 41 miles; Whitewater, WI; FT enrollment: 11,124)
Public high schools in Belvidere:
- BELVIDERE HIGH SCHOOL (Students: 1,337, Location: 1500 EAST AVE, Grades: 9-12)
- BELVIDERE NORTH HIGH SCH (Students: 1,289, Location: 9393 BELOIT RD, Grades: 9-12)
- REG'L LEARNING CENTER STAR BOONE (Location: 1320 EAST AVE, Grades: 9-12)
- REGL LEARNING ACADEMY STAR BOONE (Location: 1320 EAST AVE, Grades: 6-12)
Public elementary/middle schools in Belvidere:
- BELVIDERE CENTRAL MIDDLE SCHOOL (Students: 1,144, Location: 8787 BELOIT RD, Grades: 6-8)
- WASHINGTON ACADEMY (Students: 1,131, Location: 1031 5TH AVE, Grades: PK-8)
- BELVIDERE SOUTH MIDDLE SCHOOL (Students: 966, Location: 919 E 6TH ST, Grades: 6-8)
- SETH WHITMAN ELEM SCH (Students: 705, Location: 8989 BELOIT RD, Grades: KG-5)
- MEEHAN ELEMENTARY SCHOOL (Students: 654, Location: 1401 E 6TH ST, Grades: KG-5)
- LINCOLN ELEM SCHOOL (Location: 1011 BONUS AVE, Grades: KG-5)
- PERRY ELEM SCHOOL (Location: 633 W PERRY ST, Grades: KG-5)
Private elementary/middle schools in Belvidere:
- IMMANUEL LUTHERAN SCHOOL (Students: 303, Location: 1225 E 2ND ST, Grades: PK-8)
- ST JAMES SCHOOL (Students: 173, Location: 320 LOGAN AVE, Grades: PK-8)
- OPEN BIBLE ACADEMY (Students: 36, Location: 8567 TOWN HALL RD, Grades: PK-4)
See full list of schools located in Belvidere
Library in Belvidere:
- IDA PUBLIC LIBRARY (Operating income: $727,397; Location: 320 NORTH STATE STREET; 82,049 books; 5,957 e-books; 2,705 audio materials; 4,818 video materials; 2 local licensed databases; 16 state licensed databases; 1 other licensed databases; 267 print serial subscriptions)
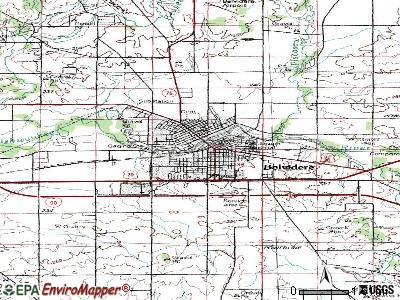
Points of interest:
Click to draw/clear city borders
Notable locations in Belvidere: Belvidere Service Area (A), Boone County Rural Fire Protection District 2 Station 1 (B), Belvidere Fire Department Station 2 (C), Belvidere Fire Department Station 1 Headquarters (D), Ida Public Library (E), Boone County Courthouse (F), Belvidere City Hall (G), Lifeline Ambulance Service - Boone County Fire District 2 (H). Display/hide their locations on the map
Churches in Belvidere include: First Church of Christ Scientist (A), First Presbyterian Church (B), Immanuel Evangelical Lutheran Church (C), Mission Covenant Church (D), Pettit Memorial Chapel (E), Saint James Roman Catholic Church (F), Saint Johns Evangelical Church (G), Trinity Episcopal Church (H), Zion Evangelical Lutheran Church (I). Display/hide their locations on the map
Cemetery: Saint James Catholic Cemetery (1). Display/hide its location on the map
Parks in Belvidere include: Belvidere Municipal Park (1), Spencer Park (2). Display/hide their locations on the map
Tourist attractions: Belvidere Cemetery Association (Historical Places & Services; 1121 North Main Street) (1), Concordia Lanes Limited (Amusement & Theme Parks; 1205 Logan Avenue) (2). Display/hide their approximate locations on the map
Hotels: Belvidere House (226 North State Street) (1), Cambridge Inn (1605 North State Street) (2), Budget Inn (1345 North State Street) (3). Display/hide their approximate locations on the map
Courts: Boone County - Court Reporter- Judge (601 North Main Street) (1), Boone County - Court Reporter (601 North Main Street) (2), Boone County - Circuit Court Clerk (601 North Main Street) (3). Display/hide their approximate locations on the map
Birthplace of: Horace Mann Towner - Politician**,** Joe Charboneau - Baseball player**,** Kasey James - Profesional wrestler**,** Damon M. Cummings - Soilder**,** Frank Bishop (baseball) - Baseball player**,** Fred Schulte - Baseball player**,** Jack D. Franks - Politician**,** Ronald A. Wait - Politician.
Boone County has a predicted average indoor radon screening level greater than 4 pCi/L (pico curies per liter) - Highest Potential
Drinking water stations with addresses in Belvidere and their reported violations in the past:
BELVIDERE (Address: 401 WHITNEY BLVD. , Population served: 23,500**,** Groundwater):
Past monitoring violations:
- One regular monitoring violation
MCKINLEY AVENUE BUS BARN (Population served: 140**,** Groundwater):
Past monitoring violations:
- One regular monitoring violation
SMOKIN COOP (Population served: 25**,** Groundwater):
Past monitoring violations:
- One regular monitoring violation
Drinking water stations with addresses in Belvidere that have no violations reported:
- NEDS RESTAURANT (Population served: 240**,** Primary Water Source Type: Groundwater)
- SWAN HILLS GOLF COURSE (Population served: 125**,** Primary Water Source Type: Groundwater)
- FARM & FLEET OF BELVIDERE (Population served: 100**,** Primary Water Source Type: Groundwater)
- SPENCER PARK (106211) (Population served: 25**,** Primary Water Source Type: Groundwater)
Average household size:
| This city: | 2.9 people |
|---|---|
| Illinois: | 2.6 people |
Percentage of family households:
| This city: | 71.4% |
|---|---|
| Whole state: | 65.8% |
Percentage of households with unmarried partners:
| This city: | 7.6% |
|---|---|
| Whole state: | 6.3% |
Likely homosexual households (counted as self-reported same-sex unmarried-partner households)
- Lesbian couples: 0.3% of all households
- Gay men: 0.2% of all households
People in group quarters in Belvidere in 2010:
- 150 people in nursing facilities/skilled-nursing facilities
- 71 people in local jails and other municipal confinement facilities
- 9 people in other noninstitutional facilities
People in group quarters in Belvidere in 2000:
- 182 people in nursing homes
- 53 people in local jails and other confinement facilities (including police lockups)
- 8 people in homes for the mentally retarded
- 2 people in other noninstitutional group quarters
Banks with branches in Belvidere (2011 data):
- Alpine Bank & Trust Co.: Logan Avenue Facility, North State Street Drive-Up Facility, Belvidere Office, Gateway Center Branch, Bucs Branch, Blue Thunder Branch**. Info updated** 2009/07/22: Bank assets: 1,039.0mil∗∗,Deposits:∗∗1,039.0 mil**, Deposits:** 1,039.0mil∗∗,Deposits:∗∗928.9 mil**, headquarters in** Rockford, IL**, positive income**, Commercial Lending Specialization**,** 19 total offices , Holding Company: Alpine Bancorporation, Inc.
- PNC Bank, National Association: Belvidere Motor Branch at 1004 North State Street**, branch established on** 1974/11/05; Belvidere Facility at 130 South State Street**, branch established on** 1884/01/01**. Info updated** 2012/03/20: Bank assets: 263,309.6mil∗∗,Deposits:∗∗263,309.6 mil**, Deposits:** 263,309.6mil∗∗,Deposits:∗∗197,343.0 mil**, headquarters in** Wilmington, DE**, positive income**, Commercial Lending Specialization**,** 3085 total offices , Holding Company: Pnc Financial Services Group, Inc., The
- BMO Harris Bank National Association: Pacemaker Supermarket Branch at 401 Southtowne Drive**, branch established on** 1995/04/03; Belvidere Branch at 782 Beloit Road**, branch established on** 2006/03/20**. Info updated** 2011/07/14: Bank assets: 97,264.0mil∗∗,Deposits:∗∗97,264.0 mil**, Deposits:** 97,264.0mil∗∗,Deposits:∗∗75,624.6 mil**, headquarters in** Chicago, IL**, positive income** , 717 total offices , Holding Company: Bank Of Montreal
- First National Bank of Omaha: Belvidere Branch at 1725 South State Street**, branch established on** 2007/08/13**. Info updated** 2010/10/13: Bank assets: 13,433.1mil∗∗,Deposits:∗∗13,433.1 mil**, Deposits:** 13,433.1mil∗∗,Deposits:∗∗10,746.6 mil**, headquarters in** Omaha, NE**, positive income**, Commercial Lending Specialization**,** 102 total offices , Holding Company: Lauritzen Corporation
- Blackhawk Bank: Belvidere Branch at 2141 North State Street**, branch established on** 1993/10/12**. Info updated** 2011/08/25: Bank assets: 558.2mil∗∗,Deposits:∗∗558.2 mil**, Deposits:** 558.2mil∗∗,Deposits:∗∗476.1 mil**, headquarters in** Beloit, WI**, positive income**, Commercial Lending Specialization**,** 8 total offices , Holding Company: Blackhawk Bancorp, Inc.
- Union Savings Bank: 1320 North State Street Branch at 1320 North State Street**, branch established on** 1987/06/30**. Info updated** 2006/11/03: Bank assets: 170.5mil∗∗,Deposits:∗∗170.5 mil**, Deposits:** 170.5mil∗∗,Deposits:∗∗145.7 mil**, headquarters in** Freeport, IL**, positive income** , 5 total offices , Holding Company: Union Bancshares, Mhc
For population 15 years and over in Belvidere:
- Never married: 37.0%
- Now married: 41.3%
- Separated: 2.0%
- Widowed: 6.9%
- Divorced: 12.9%
For population 25 years and over in Belvidere:
- High school or higher: 77.2%
- Bachelor's degree or higher: 12.4%
- Graduate or professional degree: 4.4%
- Unemployed: 5.6%
- Mean travel time to work (commute): 21.3 minutes
Education Gini index (Inequality in education)
| Here: | 16.4 |
|---|---|
| Illinois average: | 12.5 |
Graphs represent county-level data. Detailed 2008 Election Results
Political contributions by individuals in Belvidere, IL
Religion statistics for Belvidere, IL (based on Boone County data)
| Religion | Adherents | Congregations |
|---|---|---|
| Catholic | 10,420 | 1 |
| Mainline Protestant | 5,824 | 16 |
| Evangelical Protestant | 4,054 | 19 |
| Other | 254 | 2 |
| None | 33,613 | - |
Source: Clifford Grammich, Kirk Hadaway, Richard Houseal, Dale E.Jones, Alexei Krindatch, Richie Stanley and Richard H.Taylor. 2012. 2010 U.S.Religion Census: Religious Congregations & Membership Study. Association of Statisticians of American Religious Bodies. Jones, Dale E., et al. 2002. Congregations and Membership in the United States 2000. Nashville, TN: Glenmary Research Center. Graphs represent county-level data
Food Environment Statistics:
**Number of grocery stores: 7
| This county: | 1.31 / 10,000 pop. |
|---|---|
| Illinois: | 2.24 / 10,000 pop. |
**Number of convenience stores (no gas): 3
| Here: | 0.56 / 10,000 pop. |
|---|---|
| Illinois: | 0.75 / 10,000 pop. |
**Number of convenience stores (with gas): 17
| This county: | 3.19 / 10,000 pop. |
|---|---|
| Illinois: | 2.61 / 10,000 pop. |
**Number of full-service restaurants: 26
| Here: | 4.88 / 10,000 pop. |
|---|---|
| Illinois: | 6.86 / 10,000 pop. |
**Low-income preschool obesity rate:
| Boone County: | 19.4% |
|---|---|
| Illinois: | 14.5% |
Health and Nutrition:
**Healthy diet rate:
| Belvidere: | 46.5% |
|---|---|
| Illinois: | 49.5% |
**Average overall health of teeth and gums:
| This city: | 43.1% |
|---|---|
| Illinois: | 47.2% |
**Average BMI:
| Belvidere: | 28.7 |
|---|---|
| Illinois: | 28.6 |
**People feeling badly about themselves:
**People not drinking alcohol at all:
| This city: | 10.8% |
|---|---|
| State: | 10.8% |
**Average hours sleeping at night:
| Belvidere: | 6.8 |
|---|---|
| Illinois: | 6.8 |
**Overweight people:
| Belvidere: | 32.5% |
|---|---|
| Illinois: | 33.4% |
**General health condition:
| This city: | 53.9% |
|---|---|
| Illinois: | 56.4% |
**Average condition of hearing:
| Belvidere: | 78.2% |
|---|---|
| Illinois: | 79.9% |
More about Health and Nutrition of Belvidere, IL Residents
| Local government employment and payroll (March 2022) | |||||
|---|---|---|---|---|---|
| Function | Full-time employees | Monthly full-time payroll | Average yearly full-time wage | Part-time employees | Monthly part-time payroll |
| Police Protection - Officers | 42 | 315,827∣315,827 | 315,827∣90,236 | 0 | $0 |
| Firefighters | 29 | 231,880∣231,880 | 231,880∣95,950 | 0 | $0 |
| Water Supply | 12 | 72,866∣72,866 | 72,866∣72,866 | 0 | $0 |
| Streets and Highways | 11 | 69,732∣69,732 | 69,732∣76,071 | 0 | $0 |
| Local Libraries | 8 | 26,769∣26,769 | 26,769∣40,154 | 15 | $13,721 |
| Sewerage | 7 | 20,888∣20,888 | 20,888∣35,808 | 0 | $0 |
| Other Government Administration | 5 | 23,803∣23,803 | 23,803∣57,127 | 10 | $6,049 |
| Police - Other | 3 | 10,845∣10,845 | 10,845∣43,380 | 0 | $0 |
| Other and Unallocable | 3 | 13,915∣13,915 | 13,915∣55,660 | 2 | $3,100 |
| Financial Administration | 1 | 7,018∣7,018 | 7,018∣84,216 | 1 | $465 |
| Fire - Other | 1 | 2,245∣2,245 | 2,245∣26,940 | 0 | $0 |
| Judicial and Legal | 1 | 10,405∣10,405 | 10,405∣124,860 | 0 | $0 |
| Totals for Government | 123 | 806,194∣806,194 | 806,194∣78,653 | 28 | $23,335 |
Belvidere government finances - Expenditure in 2018 (per resident):
- Construction - Water Utilities: 1,884,000(1,884,000 (1,884,000(74.85)
Housing and Community Development: 75,000(75,000 (75,000(2.98)
Regular Highways: 23,000(23,000 (23,000(0.91) - Current Operations - Police Protection: 6,287,000(6,287,000 (6,287,000(249.79)
Local Fire Protection: 4,068,000(4,068,000 (4,068,000(161.63)
Regular Highways: 3,598,000(3,598,000 (3,598,000(142.95)
Central Staff Services: 2,044,000(2,044,000 (2,044,000(81.21)
Water Utilities: 1,961,000(1,961,000 (1,961,000(77.91)
Sewerage: 1,772,000(1,772,000 (1,772,000(70.40)
General - Other: 1,587,000(1,587,000 (1,587,000(63.05)
Libraries: 725,000(725,000 (725,000(28.81)
Solid Waste Management: 581,000(581,000 (581,000(23.08)
Public Welfare - Other: 331,000(331,000 (331,000(13.15)
Health - Other: 25,000(25,000 (25,000(0.99) - General - Interest on Debt: 1,324,000(1,324,000 (1,324,000(52.60)
- Other Capital Outlay - Housing and Community Development: 914,000(914,000 (914,000(36.31)
Local Fire Protection: 575,000(575,000 (575,000(22.85)
Water Utilities: 401,000(401,000 (401,000(15.93)
Police Protection: 158,000(158,000 (158,000(6.28) - Total Salaries and Wages: 9,724,000(9,724,000 (9,724,000(386.35)
Belvidere government finances - Revenue in 2018 (per resident):
- Charges - Sewerage: 3,543,000(3,543,000 (3,543,000(140.77)
Other: 1,048,000(1,048,000 (1,048,000(41.64)
Parks and Recreation: 50,000(50,000 (50,000(1.99) - Miscellaneous - Fines and Forfeits: 1,028,000(1,028,000 (1,028,000(40.84)
General Revenue - Other: 638,000(638,000 (638,000(25.35)
Interest Earnings: 143,000(143,000 (143,000(5.68) - Revenue - Water Utilities: 2,290,000(2,290,000 (2,290,000(90.98)
- State Intergovernmental - General Local Government Support: 6,661,000(6,661,000 (6,661,000(264.65)
Highways: 682,000(682,000 (682,000(27.10)
Other: 262,000(262,000 (262,000(10.41) - Tax - Property: 5,844,000(5,844,000 (5,844,000(232.19)
Public Utilities Sales: 2,097,000(2,097,000 (2,097,000(83.32)
Other Selective Sales: 731,000(731,000 (731,000(29.04)
Other License: 337,000(337,000 (337,000(13.39)
Belvidere government finances - Debt in 2018 (per resident):
- Long Term Debt - Beginning Outstanding - Unspecified Public Purpose: 33,097,000(33,097,000 (33,097,000(1314.99)
Outstanding Unspecified Public Purpose: 30,214,000(30,214,000 (30,214,000(1200.44)
Retired Unspecified Public Purpose: 3,212,000(3,212,000 (3,212,000(127.62)
Issue, Unspecified Public Purpose: 329,000(329,000 (329,000(13.07)
Belvidere government finances - Cash and Securities in 2018 (per resident):
- Other Funds - Cash and Securities: 18,269,000(18,269,000 (18,269,000(725.85)
| Businesses in Belvidere, IL | |||
|---|---|---|---|
| Name | Count | Name | Count |
| 7-Eleven | 1 | MasterBrand Cabinets | 6 |
| ALDI | 1 | McDonald's | 3 |
| Ace Hardware | 1 | Nike | 1 |
| Advance Auto Parts | 1 | Panda Express | 1 |
| Applebee's | 1 | Penske | 1 |
| Arby's | 1 | Pizza Hut | 1 |
| AutoZone | 1 | RadioShack | 1 |
| Burger King | 1 | SONIC Drive-In | 1 |
| Circle K | 1 | Sears | 1 |
| Cricket Wireless | 2 | Starbucks | 2 |
| Curves | 1 | T-Mobile | 2 |
| FedEx | 3 | Taco Bell | 1 |
| H&R Block | 1 | U-Haul | 3 |
| Jones New York | 1 | U.S. Cellular | 2 |
| KFC | 1 | UPS | 6 |
| Kmart | 1 | Verizon Wireless | 1 |
| La-Z-Boy | 1 | Walgreens | 1 |
| Little Caesars Pizza | 1 | Walmart | 1 |
| Long John Silver's | 1 | YMCA | 1 |
Browse common businesses in Belvidere, IL
Strongest AM radio stations in Belvidere:
- WROK (1440 AM; 5 kW; ROCKFORD, IL; Owner: CUMULUS LICENSING CORP.)
- WSCR (670 AM; 50 kW; CHICAGO, IL; Owner: INFINITY BROADCASTING OPERATIONS, INC.)
- WGN (720 AM; 50 kW; CHICAGO, IL; Owner: WGN CONTINENTAL BROADCASTING CO.)
- WBBM (780 AM; 50 kW; CHICAGO, IL; Owner: INFINITY BROADCASTING OPERATIONS, INC.)
- WTMJ (620 AM; 50 kW; MILWAUKEE, WI; Owner: JOURNAL BROADCAST CORPORATION)
- WMVP (1000 AM; 50 kW; CHICAGO, IL; Owner: ABC, INC.)
- WISN (1130 AM; 50 kW; MILWAUKEE, WI; Owner: CAPSTAR TX LIMITED PARTNERSHIP)
- WTJK (1380 AM; 5 kW; SOUTH BELOIT, IL; Owner: GOOD KARMA BROADCASTING, L.L.C.)
- WLS (890 AM; 50 kW; CHICAGO, IL; Owner: WLS, INC.)
- WYLL (1160 AM; 50 kW; CHICAGO, IL; Owner: SCA LICENSE CORPORATION)
- WNVR (1030 AM; 5 kW; VERNON HILLS, IL; Owner: POLNET COMMUNICATIONS, LTD.)
- WNTA (1330 AM; 1 kW; ROCKFORD, IL; Owner: AIRPLAY BROADCASTING CORP.)
- WAIT (850 AM; daytime; 2 kW; CRYSTAL LAKE, IL; Owner: NM LICENSING, LLC)
Strongest FM radio stations in Belvidere:
- WXRX (104.9 FM; BELVIDERE, IL; Owner: AIRPLAY BROADCASTING CORP.)
- WGSL (91.1 FM; LOVES PARK, IL; Owner: CHRISTIAN LIFE CENTER SCHOOL)
- WQFL (100.9 FM; ROCKFORD, IL; Owner: QUEST FOR LIFE, INC.)
- WZOK (97.5 FM; ROCKFORD, IL; Owner: CUMULUS LICENSING CORP.)
- WGFB (103.1 FM; ROCKTON, IL; Owner: WRWC, Inc.)
- WYCH (106.3 FM; GENOA, IL; Owner: DONTRON, INC.)
- WFEN (88.3 FM; ROCKFORD, IL; Owner: FAITH ACADEMY, DBA WFEN)
- WKMQ-FM (96.7 FM; LOVES PARK, IL; Owner: CUMULUS LICENSING CORP.)
- WYHY (95.3 FM; WINNEBAGO, IL; Owner: AIRPLAY BROADCASTING CORPORATION)
- W233AD (94.5 FM; ROCKFORD, IL; Owner: FAMILY STATIONS, INC.)
- WNIU (89.5 FM; DEKALB, IL; Owner: NORTHERN ILLINOIS UNIVERSITY)
- WZSR (105.5 FM; WOODSTOCK, IL; Owner: NM LICENSING, LLC)
- WNIJ (90.5 FM; ROCKFORD, IL; Owner: NORTHERN ILLINOIS UNIVERSITY)
- WDEK (92.5 FM; DEKALB, IL; Owner: SPANISH BROADCASTING SYSTEM OF ILLINOIS, INC.)
- WDKB (94.9 FM; DEKALB, IL; Owner: DEKALB COUNTY RADIO, LIMITED)
- W289AB (105.7 FM; ROCKFORD, IL; Owner: NORTHERN ILLINOIS UNIVERSITY)
- W220BL (91.9 FM; ROCKFORD, IL; Owner: PENSACOLA CHRISTIAN COLLEGE, INC.)
TV broadcast stations around Belvidere:
- WQFL-CA (Channel 8; ROCKFORD, IL; Owner: FAMILY VALUES ORGANIZATION, INC.)
- WCFC-CA (Channel 51; ROCKFORD, IL; Owner: CHRISTIAN COMMUNICATIONS OF CHICAGOLAND, INC.)
- WIFR (Channel 23; FREEPORT, IL; Owner: GRAY MIDAMERICA TV LICENSEE CORP.)
- WTVO (Channel 17; ROCKFORD, IL; Owner: WINNEBAGO TELEVISION CORPORATION)
- WFBN-LP (Channel 33; ROCKFORD, IL; Owner: WEIGEL BROADCASTING COMPANY)
- WQRF-TV (Channel 39; ROCKFORD, IL; Owner: QUORUM OF ROCKFORD LICENSE, LLC)
- WREX-TV (Channel 13; ROCKFORD, IL; Owner: WREX TELEVISION, LLC)
- W34CK (Channel 34; ARLINGTON HEIGHTS, IL; Owner: FIRST UNITED, INC.)
- W64CQ (Channel 64; ARLINGTON HEIGHTS, IL; Owner: TRINITY BROADCASTING NETWORK)
- W25CL (Channel 25; ROCKFORD, IL; Owner: TRINITY BROADCASTING NETWORK)
- National Bridge Inventory (NBI) Statistics
- 57Number of bridges
- 705ft / 215mTotal length
- $3,793,000Total costs
- 831,650Total average daily traffic
- 200,593Total average daily truck traffic
- New bridges - historical statistics
- 11900-1909
- 11940-1949
- 81950-1959
- 111960-1969
- 41970-1979
- 71980-1989
- 21990-1999
- 22000-2009
- 202010-2019
- 12020-2022
See full National Bridge Inventory statistics for Belvidere, IL
| Home Mortgage Disclosure Act Aggregated Statistics For Year 2009_(Based on 1 full and 2 partial tracts)_ | ||||||||||||||
|---|---|---|---|---|---|---|---|---|---|---|---|---|---|---|
| A) FHA, FSA/RHS & VAHome Purchase Loans | B) ConventionalHome Purchase Loans | C) Refinancings | D) Home Improvement Loans | E) Loans on Dwellings For 5+ Families | F) Non-occupant Loans on < 5 Family Dwellings (A B C & D) | G) Loans On ManufacturedHome Dwelling (A B C & D) | ||||||||
| Number | Average Value | Number | Average Value | Number | Average Value | Number | Average Value | Number | Average Value | Number | Average Value | Number | Average Value | |
| LOANS ORIGINATED | 64 | 107,180∣55∣107,180 | 55 | 107,180∣55∣83,111 | 374 | 113,023∣9∣113,023 | 9 | 113,023∣9∣30,931 | 1 | 528,910∣34∣528,910 | 34 | 528,910∣34∣85,479 | 16 | $55,250 |
| APPLICATIONS APPROVED, NOT ACCEPTED | 5 | 94,024∣22∣94,024 | 22 | 94,024∣22∣82,079 | 42 | 130,980∣4∣130,980 | 4 | 130,980∣4∣9,020 | 0 | 0∣3∣0 | 3 | 0∣3∣71,293 | 17 | $64,353 |
| APPLICATIONS DENIED | 22 | 105,389∣33∣105,389 | 33 | 105,389∣33∣54,377 | 157 | 126,446∣12∣126,446 | 12 | 126,446∣12∣23,281 | 0 | 0∣6∣0 | 6 | 0∣6∣76,568 | 31 | $52,100 |
| APPLICATIONS WITHDRAWN | 5 | 120,390∣2∣120,390 | 2 | 120,390∣2∣118,755 | 97 | 123,236∣4∣123,236 | 4 | 123,236∣4∣9,790 | 0 | 0∣3∣0 | 3 | 0∣3∣81,557 | 0 | $0 |
| FILES CLOSED FOR INCOMPLETENESS | 5 | 93,820∣2∣93,820 | 2 | 93,820∣2∣106,190 | 24 | 113,115∣1∣113,115 | 1 | 113,115∣1∣91,920 | 0 | 0∣1∣0 | 1 | 0∣1∣79,900 | 1 | $28,280 |
| Aggregated Statistics For Year 2008_(Based on 1 full and 2 partial tracts)_ | ||||||||||||||
|---|---|---|---|---|---|---|---|---|---|---|---|---|---|---|
| A) FHA, FSA/RHS & VAHome Purchase Loans | B) ConventionalHome Purchase Loans | C) Refinancings | D) Home Improvement Loans | E) Loans on Dwellings For 5+ Families | F) Non-occupant Loans on < 5 Family Dwellings (A B C & D) | G) Loans On ManufacturedHome Dwelling (A B C & D) | ||||||||
| Number | Average Value | Number | Average Value | Number | Average Value | Number | Average Value | Number | Average Value | Number | Average Value | Number | Average Value | |
| LOANS ORIGINATED | 48 | 130,307∣88∣130,307 | 88 | 130,307∣88∣112,802 | 292 | 111,046∣38∣111,046 | 38 | 111,046∣38∣38,101 | 2 | 253,360∣35∣253,360 | 35 | 253,360∣35∣121,500 | 20 | $34,800 |
| APPLICATIONS APPROVED, NOT ACCEPTED | 6 | 141,547∣25∣141,547 | 25 | 141,547∣25∣87,690 | 49 | 120,718∣11∣120,718 | 11 | 120,718∣11∣44,727 | 0 | 0∣6∣0 | 6 | 0∣6∣81,295 | 13 | $49,923 |
| APPLICATIONS DENIED | 15 | 145,978∣34∣145,978 | 34 | 145,978∣34∣83,857 | 241 | 133,305∣27∣133,305 | 27 | 133,305∣27∣45,454 | 1 | 3,630,960∣14∣3,630,960 | 14 | 3,630,960∣14∣117,033 | 26 | $50,418 |
| APPLICATIONS WITHDRAWN | 6 | 129,603∣10∣129,603 | 10 | 129,603∣10∣119,545 | 72 | 141,871∣2∣141,871 | 2 | 141,871∣2∣15,500 | 0 | 0∣6∣0 | 6 | 0∣6∣96,857 | 1 | $39,000 |
| FILES CLOSED FOR INCOMPLETENESS | 2 | 119,820∣4∣119,820 | 4 | 119,820∣4∣153,632 | 13 | 121,142∣1∣121,142 | 1 | 121,142∣1∣39,600 | 0 | 0∣2∣0 | 2 | 0∣2∣86,405 | 0 | $0 |
| Aggregated Statistics For Year 2007_(Based on 1 full and 2 partial tracts)_ | ||||||||||||||
|---|---|---|---|---|---|---|---|---|---|---|---|---|---|---|
| A) FHA, FSA/RHS & VAHome Purchase Loans | B) ConventionalHome Purchase Loans | C) Refinancings | D) Home Improvement Loans | E) Loans on Dwellings For 5+ Families | F) Non-occupant Loans on < 5 Family Dwellings (A B C & D) | G) Loans On ManufacturedHome Dwelling (A B C & D) | ||||||||
| Number | Average Value | Number | Average Value | Number | Average Value | Number | Average Value | Number | Average Value | Number | Average Value | Number | Average Value | |
| LOANS ORIGINATED | 37 | 137,116∣225∣137,116 | 225 | 137,116∣225∣119,195 | 339 | 109,149∣54∣109,149 | 54 | 109,149∣54∣37,717 | 2 | 2,770,770∣50∣2,770,770 | 50 | 2,770,770∣50∣97,031 | 26 | $45,115 |
| APPLICATIONS APPROVED, NOT ACCEPTED | 3 | 178,160∣47∣178,160 | 47 | 178,160∣47∣104,266 | 56 | 121,117∣7∣121,117 | 7 | 121,117∣7∣33,444 | 0 | 0∣6∣0 | 6 | 0∣6∣114,022 | 21 | $70,762 |
| APPLICATIONS DENIED | 13 | 123,554∣75∣123,554 | 75 | 123,554∣75∣98,721 | 289 | 126,615∣38∣126,615 | 38 | 126,615∣38∣52,791 | 0 | 0∣28∣0 | 28 | 0∣28∣98,921 | 22 | $52,250 |
| APPLICATIONS WITHDRAWN | 4 | 153,352∣30∣153,352 | 30 | 153,352∣30∣142,370 | 108 | 125,118∣3∣125,118 | 3 | 125,118∣3∣159,413 | 1 | 478,000∣4∣478,000 | 4 | 478,000∣4∣104,482 | 0 | $0 |
| FILES CLOSED FOR INCOMPLETENESS | 1 | 128,000∣8∣128,000 | 8 | 128,000∣8∣116,896 | 26 | 134,500∣2∣134,500 | 2 | 134,500∣2∣87,420 | 0 | 0∣1∣0 | 1 | 0∣1∣138,000 | 0 | $0 |
| Aggregated Statistics For Year 2006_(Based on 1 full and 2 partial tracts)_ | ||||||||||||||
|---|---|---|---|---|---|---|---|---|---|---|---|---|---|---|
| A) FHA, FSA/RHS & VAHome Purchase Loans | B) ConventionalHome Purchase Loans | C) Refinancings | D) Home Improvement Loans | E) Loans on Dwellings For 5+ Families | F) Non-occupant Loans on < 5 Family Dwellings (A B C & D) | G) Loans On ManufacturedHome Dwelling (A B C & D) | ||||||||
| Number | Average Value | Number | Average Value | Number | Average Value | Number | Average Value | Number | Average Value | Number | Average Value | Number | Average Value | |
| LOANS ORIGINATED | 35 | 138,705∣410∣138,705 | 410 | 138,705∣410∣110,523 | 403 | 107,430∣50∣107,430 | 50 | 107,430∣50∣37,386 | 1 | 1,260,050∣65∣1,260,050 | 65 | 1,260,050∣65∣90,021 | 37 | $47,990 |
| APPLICATIONS APPROVED, NOT ACCEPTED | 2 | 109,160∣74∣109,160 | 74 | 109,160∣74∣107,556 | 77 | 110,026∣8∣110,026 | 8 | 110,026∣8∣58,120 | 0 | 0∣14∣0 | 14 | 0∣14∣86,430 | 23 | $43,449 |
| APPLICATIONS DENIED | 6 | 143,395∣150∣143,395 | 150 | 143,395∣150∣85,586 | 299 | 117,170∣47∣117,170 | 47 | 117,170∣47∣36,891 | 1 | 106,070∣23∣106,070 | 23 | 106,070∣23∣105,481 | 53 | $38,203 |
| APPLICATIONS WITHDRAWN | 2 | 122,485∣63∣122,485 | 63 | 122,485∣63∣130,778 | 161 | 120,679∣4∣120,679 | 4 | 120,679∣4∣89,848 | 1 | 161,930∣15∣161,930 | 15 | 161,930∣15∣88,767 | 1 | $70,000 |
| FILES CLOSED FOR INCOMPLETENESS | 0 | 0∣18∣0 | 18 | 0∣18∣94,626 | 38 | 117,802∣0∣117,802 | 0 | 117,802∣0∣0 | 0 | 0∣0∣0 | 0 | 0∣0∣0 | 0 | $0 |
| Aggregated Statistics For Year 2005_(Based on 1 full and 2 partial tracts)_ | ||||||||||||||
|---|---|---|---|---|---|---|---|---|---|---|---|---|---|---|
| A) FHA, FSA/RHS & VAHome Purchase Loans | B) ConventionalHome Purchase Loans | C) Refinancings | D) Home Improvement Loans | E) Loans on Dwellings For 5+ Families | F) Non-occupant Loans on < 5 Family Dwellings (A B C & D) | G) Loans On ManufacturedHome Dwelling (A B C & D) | ||||||||
| Number | Average Value | Number | Average Value | Number | Average Value | Number | Average Value | Number | Average Value | Number | Average Value | Number | Average Value | |
| LOANS ORIGINATED | 51 | 131,378∣464∣131,378 | 464 | 131,378∣464∣99,008 | 426 | 102,805∣62∣102,805 | 62 | 102,805∣62∣66,573 | 1 | 571,340∣69∣571,340 | 69 | 571,340∣69∣93,903 | 38 | $41,868 |
| APPLICATIONS APPROVED, NOT ACCEPTED | 4 | 120,395∣57∣120,395 | 57 | 120,395∣57∣96,990 | 72 | 114,209∣9∣114,209 | 9 | 114,209∣9∣76,558 | 0 | 0∣7∣0 | 7 | 0∣7∣86,474 | 12 | $52,386 |
| APPLICATIONS DENIED | 10 | 148,111∣189∣148,111 | 189 | 148,111∣189∣78,685 | 398 | 117,147∣70∣117,147 | 70 | 117,147∣70∣29,068 | 0 | 0∣22∣0 | 22 | 0∣22∣86,910 | 71 | $44,800 |
| APPLICATIONS WITHDRAWN | 3 | 127,007∣53∣127,007 | 53 | 127,007∣53∣105,998 | 222 | 132,989∣30∣132,989 | 30 | 132,989∣30∣132,377 | 0 | 0∣13∣0 | 13 | 0∣13∣115,063 | 0 | $0 |
| FILES CLOSED FOR INCOMPLETENESS | 3 | 156,187∣9∣156,187 | 9 | 156,187∣9∣118,066 | 35 | 99,325∣2∣99,325 | 2 | 99,325∣2∣110,340 | 0 | 0∣2∣0 | 2 | 0∣2∣105,500 | 0 | $0 |
| Aggregated Statistics For Year 2004_(Based on 1 full and 2 partial tracts)_ | ||||||||||||||
|---|---|---|---|---|---|---|---|---|---|---|---|---|---|---|
| A) FHA, FSA/RHS & VAHome Purchase Loans | B) ConventionalHome Purchase Loans | C) Refinancings | D) Home Improvement Loans | E) Loans on Dwellings For 5+ Families | F) Non-occupant Loans on < 5 Family Dwellings (A B C & D) | G) Loans On ManufacturedHome Dwelling (A B C & D) | ||||||||
| Number | Average Value | Number | Average Value | Number | Average Value | Number | Average Value | Number | Average Value | Number | Average Value | Number | Average Value | |
| LOANS ORIGINATED | 53 | 117,597∣378∣117,597 | 378 | 117,597∣378∣101,016 | 453 | 103,478∣58∣103,478 | 58 | 103,478∣58∣35,858 | 9 | 815,613∣77∣815,613 | 77 | 815,613∣77∣100,707 | 38 | $35,210 |
| APPLICATIONS APPROVED, NOT ACCEPTED | 2 | 100,475∣55∣100,475 | 55 | 100,475∣55∣96,698 | 80 | 107,057∣3∣107,057 | 3 | 107,057∣3∣54,743 | 0 | 0∣4∣0 | 4 | 0∣4∣98,322 | 15 | $47,131 |
| APPLICATIONS DENIED | 13 | 127,023∣92∣127,023 | 92 | 127,023∣92∣75,459 | 308 | 108,518∣68∣108,518 | 68 | 108,518∣68∣30,454 | 0 | 0∣17∣0 | 17 | 0∣17∣82,809 | 60 | $44,394 |
| APPLICATIONS WITHDRAWN | 6 | 129,983∣43∣129,983 | 43 | 129,983∣43∣112,423 | 207 | 114,182∣9∣114,182 | 9 | 114,182∣9∣67,327 | 1 | 479,410∣10∣479,410 | 10 | 479,410∣10∣73,270 | 1 | $41,000 |
| FILES CLOSED FOR INCOMPLETENESS | 2 | 153,900∣14∣153,900 | 14 | 153,900∣14∣123,291 | 29 | 122,448∣1∣122,448 | 1 | 122,448∣1∣28,280 | 0 | 0∣3∣0 | 3 | 0∣3∣95,533 | 0 | $0 |
| Aggregated Statistics For Year 2003_(Based on 1 full and 2 partial tracts)_ | ||||||||||||
|---|---|---|---|---|---|---|---|---|---|---|---|---|
| A) FHA, FSA/RHS & VAHome Purchase Loans | B) ConventionalHome Purchase Loans | C) Refinancings | D) Home Improvement Loans | E) Loans on Dwellings For 5+ Families | F) Non-occupant Loans on < 5 Family Dwellings (A B C & D) | |||||||
| Number | Average Value | Number | Average Value | Number | Average Value | Number | Average Value | Number | Average Value | Number | Average Value | |
| LOANS ORIGINATED | 93 | 118,024∣359∣118,024 | 359 | 118,024∣359∣103,711 | 896 | 93,960∣45∣93,960 | 45 | 93,960∣45∣16,912 | 2 | 356,875∣87∣356,875 | 87 | 356,875∣87∣76,347 |
| APPLICATIONS APPROVED, NOT ACCEPTED | 11 | 126,906∣38∣126,906 | 38 | 126,906∣38∣106,984 | 93 | 101,676∣1∣101,676 | 1 | 101,676∣1∣2,000 | 0 | 0∣4∣0 | 4 | 0∣4∣75,420 |
| APPLICATIONS DENIED | 6 | 113,040∣112∣113,040 | 112 | 113,040∣112∣72,876 | 286 | 95,379∣50∣95,379 | 50 | 95,379∣50∣22,632 | 0 | 0∣18∣0 | 18 | 0∣18∣101,101 |
| APPLICATIONS WITHDRAWN | 11 | 112,214∣39∣112,214 | 39 | 112,214∣39∣100,383 | 153 | 99,379∣2∣99,379 | 2 | 99,379∣2∣18,640 | 0 | 0∣4∣0 | 4 | 0∣4∣74,235 |
| FILES CLOSED FOR INCOMPLETENESS | 7 | 115,687∣7∣115,687 | 7 | 115,687∣7∣151,063 | 40 | 108,953∣2∣108,953 | 2 | 108,953∣2∣23,775 | 0 | 0∣1∣0 | 1 | 0∣1∣99,000 |
| Aggregated Statistics For Year 2002_(Based on 1 full and 2 partial tracts)_ | ||||||||||||
|---|---|---|---|---|---|---|---|---|---|---|---|---|
| A) FHA, FSA/RHS & VAHome Purchase Loans | B) ConventionalHome Purchase Loans | C) Refinancings | D) Home Improvement Loans | E) Loans on Dwellings For 5+ Families | F) Non-occupant Loans on < 5 Family Dwellings (A B C & D) | |||||||
| Number | Average Value | Number | Average Value | Number | Average Value | Number | Average Value | Number | Average Value | Number | Average Value | |
| LOANS ORIGINATED | 124 | 112,449∣291∣112,449 | 291 | 112,449∣291∣95,570 | 642 | 90,316∣33∣90,316 | 33 | 90,316∣33∣18,401 | 5 | 1,305,240∣63∣1,305,240 | 63 | 1,305,240∣63∣76,481 |
| APPLICATIONS APPROVED, NOT ACCEPTED | 8 | 117,574∣44∣117,574 | 44 | 117,574∣44∣68,713 | 60 | 89,732∣7∣89,732 | 7 | 89,732∣7∣22,983 | 0 | 0∣3∣0 | 3 | 0∣3∣56,123 |
| APPLICATIONS DENIED | 4 | 114,955∣98∣114,955 | 98 | 114,955∣98∣60,433 | 211 | 82,357∣25∣82,357 | 25 | 82,357∣25∣15,854 | 0 | 0∣7∣0 | 7 | 0∣7∣108,970 |
| APPLICATIONS WITHDRAWN | 3 | 112,970∣16∣112,970 | 16 | 112,970∣16∣83,487 | 110 | 94,148∣0∣94,148 | 0 | 94,148∣0∣0 | 0 | 0∣5∣0 | 5 | 0∣5∣66,070 |
| FILES CLOSED FOR INCOMPLETENESS | 1 | 113,790∣10∣113,790 | 10 | 113,790∣10∣104,701 | 29 | 104,103∣1∣104,103 | 1 | 104,103∣1∣12,000 | 0 | 0∣0∣0 | 0 | 0∣0∣0 |
| Aggregated Statistics For Year 2001_(Based on 1 full and 2 partial tracts)_ | ||||||||||||
|---|---|---|---|---|---|---|---|---|---|---|---|---|
| A) FHA, FSA/RHS & VAHome Purchase Loans | B) ConventionalHome Purchase Loans | C) Refinancings | D) Home Improvement Loans | E) Loans on Dwellings For 5+ Families | F) Non-occupant Loans on < 5 Family Dwellings (A B C & D) | |||||||
| Number | Average Value | Number | Average Value | Number | Average Value | Number | Average Value | Number | Average Value | Number | Average Value | |
| LOANS ORIGINATED | 98 | 102,192∣248∣102,192 | 248 | 102,192∣248∣95,145 | 635 | 83,985∣68∣83,985 | 68 | 83,985∣68∣20,034 | 4 | 643,535∣52∣643,535 | 52 | 643,535∣52∣73,408 |
| APPLICATIONS APPROVED, NOT ACCEPTED | 2 | 61,645∣19∣61,645 | 19 | 61,645∣19∣80,692 | 66 | 77,496∣11∣77,496 | 11 | 77,496∣11∣21,784 | 0 | 0∣1∣0 | 1 | 0∣1∣65,760 |
| APPLICATIONS DENIED | 11 | 109,926∣116∣109,926 | 116 | 109,926∣116∣47,446 | 224 | 72,256∣35∣72,256 | 35 | 72,256∣35∣14,289 | 0 | 0∣4∣0 | 4 | 0∣4∣48,928 |
| APPLICATIONS WITHDRAWN | 7 | 121,157∣15∣121,157 | 15 | 121,157∣15∣104,312 | 124 | 87,463∣7∣87,463 | 7 | 87,463∣7∣38,947 | 0 | 0∣2∣0 | 2 | 0∣2∣49,925 |
| FILES CLOSED FOR INCOMPLETENESS | 4 | 109,120∣3∣109,120 | 3 | 109,120∣3∣139,173 | 22 | 96,902∣2∣96,902 | 2 | 96,902∣2∣10,305 | 0 | 0∣0∣0 | 0 | 0∣0∣0 |
| Aggregated Statistics For Year 2000_(Based on 1 full and 2 partial tracts)_ | ||||||||||||
|---|---|---|---|---|---|---|---|---|---|---|---|---|
| A) FHA, FSA/RHS & VAHome Purchase Loans | B) ConventionalHome Purchase Loans | C) Refinancings | D) Home Improvement Loans | E) Loans on Dwellings For 5+ Families | F) Non-occupant Loans on < 5 Family Dwellings (A B C & D) | |||||||
| Number | Average Value | Number | Average Value | Number | Average Value | Number | Average Value | Number | Average Value | Number | Average Value | |
| LOANS ORIGINATED | 112 | 98,588∣251∣98,588 | 251 | 98,588∣251∣95,179 | 177 | 81,026∣68∣81,026 | 68 | 81,026∣68∣15,022 | 1 | 910,300∣24∣910,300 | 24 | 910,300∣24∣68,464 |
| APPLICATIONS APPROVED, NOT ACCEPTED | 8 | 94,961∣28∣94,961 | 28 | 94,961∣28∣55,543 | 38 | 66,547∣18∣66,547 | 18 | 66,547∣18∣18,578 | 2 | 381,605∣5∣381,605 | 5 | 381,605∣5∣57,518 |
| APPLICATIONS DENIED | 12 | 91,482∣92∣91,482 | 92 | 91,482∣92∣48,689 | 138 | 66,487∣43∣66,487 | 43 | 66,487∣43∣21,983 | 0 | 0∣6∣0 | 6 | 0∣6∣36,897 |
| APPLICATIONS WITHDRAWN | 6 | 92,732∣16∣92,732 | 16 | 92,732∣16∣80,841 | 86 | 76,684∣8∣76,684 | 8 | 76,684∣8∣20,250 | 0 | 0∣1∣0 | 1 | 0∣1∣42,550 |
| FILES CLOSED FOR INCOMPLETENESS | 2 | 98,500∣5∣98,500 | 5 | 98,500∣5∣78,358 | 38 | 88,137∣0∣88,137 | 0 | 88,137∣0∣0 | 0 | 0∣3∣0 | 3 | 0∣3∣52,333 |
| Aggregated Statistics For Year 1999_(Based on 1 full and 2 partial tracts)_ | ||||||||||||
|---|---|---|---|---|---|---|---|---|---|---|---|---|
| A) FHA, FSA/RHS & VAHome Purchase Loans | B) ConventionalHome Purchase Loans | C) Refinancings | D) Home Improvement Loans | E) Loans on Dwellings For 5+ Families | F) Non-occupant Loans on < 5 Family Dwellings (A B C & D) | |||||||
| Number | Average Value | Number | Average Value | Number | Average Value | Number | Average Value | Number | Average Value | Number | Average Value | |
| LOANS ORIGINATED | 122 | 94,186∣200∣94,186 | 200 | 94,186∣200∣84,683 | 274 | 73,490∣63∣73,490 | 63 | 73,490∣63∣15,670 | 1 | 882,620∣36∣882,620 | 36 | 882,620∣36∣65,826 |
| APPLICATIONS APPROVED, NOT ACCEPTED | 6 | 84,883∣34∣84,883 | 34 | 84,883∣34∣73,305 | 58 | 64,076∣14∣64,076 | 14 | 64,076∣14∣20,466 | 0 | 0∣2∣0 | 2 | 0∣2∣87,910 |
| APPLICATIONS DENIED | 9 | 98,653∣66∣98,653 | 66 | 98,653∣66∣46,771 | 168 | 71,984∣55∣71,984 | 55 | 71,984∣55∣17,359 | 0 | 0∣6∣0 | 6 | 0∣6∣52,048 |
| APPLICATIONS WITHDRAWN | 7 | 90,481∣19∣90,481 | 19 | 90,481∣19∣84,339 | 159 | 74,837∣9∣74,837 | 9 | 74,837∣9∣25,889 | 0 | 0∣5∣0 | 5 | 0∣5∣71,750 |
| FILES CLOSED FOR INCOMPLETENESS | 2 | 87,105∣3∣87,105 | 3 | 87,105∣3∣91,243 | 47 | 104,678∣3∣104,678 | 3 | 104,678∣3∣17,327 | 0 | 0∣6∣0 | 6 | 0∣6∣80,332 |
Detailed HMDA statistics for the following Tracts: 0101.00, 0102.00, 0103.00
| Private Mortgage Insurance Companies Aggregated Statistics For Year 2009_(Based on 1 full and 2 partial tracts)_ | ||||
|---|---|---|---|---|
| A) ConventionalHome Purchase Loans | B) Refinancings | |||
| Number | Average Value | Number | Average Value | |
| LOANS ORIGINATED | 10 | 120,540∣15∣120,540 | 15 | 120,540∣15∣139,547 |
| APPLICATIONS APPROVED, NOT ACCEPTED | 4 | 122,765∣8∣122,765 | 8 | 122,765∣8∣139,046 |
| APPLICATIONS DENIED | 2 | 204,910∣3∣204,910 | 3 | 204,910∣3∣119,380 |
| APPLICATIONS WITHDRAWN | 1 | 79,200∣1∣79,200 | 1 | 79,200∣1∣111,010 |
| FILES CLOSED FOR INCOMPLETENESS | 0 | 0∣0∣0 | 0 | 0∣0∣0 |
| Aggregated Statistics For Year 2008_(Based on 1 full and 2 partial tracts)_ | ||||||
|---|---|---|---|---|---|---|
| A) ConventionalHome Purchase Loans | B) Refinancings | C) Non-occupant Loans on < 5 Family Dwellings (A & B) | ||||
| Number | Average Value | Number | Average Value | Number | Average Value | |
| LOANS ORIGINATED | 31 | 125,093∣22∣125,093 | 22 | 125,093∣22∣140,763 | 4 | $114,385 |
| APPLICATIONS APPROVED, NOT ACCEPTED | 14 | 159,534∣11∣159,534 | 11 | 159,534∣11∣131,604 | 2 | $94,940 |
| APPLICATIONS DENIED | 2 | 192,695∣2∣192,695 | 2 | 192,695∣2∣126,430 | 0 | $0 |
| APPLICATIONS WITHDRAWN | 1 | 104,540∣0∣104,540 | 0 | 104,540∣0∣0 | 0 | $0 |
| FILES CLOSED FOR INCOMPLETENESS | 0 | 0∣1∣0 | 1 | 0∣1∣82,730 | 0 | $0 |
| Aggregated Statistics For Year 2007_(Based on 1 full and 2 partial tracts)_ | ||||||
|---|---|---|---|---|---|---|
| A) ConventionalHome Purchase Loans | B) Refinancings | C) Non-occupant Loans on < 5 Family Dwellings (A & B) | ||||
| Number | Average Value | Number | Average Value | Number | Average Value | |
| LOANS ORIGINATED | 91 | 140,537∣44∣140,537 | 44 | 140,537∣44∣146,190 | 7 | $130,130 |
| APPLICATIONS APPROVED, NOT ACCEPTED | 13 | 149,660∣11∣149,660 | 11 | 149,660∣11∣129,145 | 1 | $123,740 |
| APPLICATIONS DENIED | 5 | 104,356∣1∣104,356 | 1 | 104,356∣1∣135,000 | 1 | $135,000 |
| APPLICATIONS WITHDRAWN | 4 | 188,158∣2∣188,158 | 2 | 188,158∣2∣95,395 | 0 | $0 |
| FILES CLOSED FOR INCOMPLETENESS | 0 | 0∣0∣0 | 0 | 0∣0∣0 | 0 | $0 |
| Aggregated Statistics For Year 2006_(Based on 1 full and 2 partial tracts)_ | ||||||
|---|---|---|---|---|---|---|
| A) ConventionalHome Purchase Loans | B) Refinancings | C) Non-occupant Loans on < 5 Family Dwellings (A & B) | ||||
| Number | Average Value | Number | Average Value | Number | Average Value | |
| LOANS ORIGINATED | 100 | 138,476∣34∣138,476 | 34 | 138,476∣34∣134,353 | 9 | $95,080 |
| APPLICATIONS APPROVED, NOT ACCEPTED | 7 | 129,870∣10∣129,870 | 10 | 129,870∣10∣122,534 | 0 | $0 |
| APPLICATIONS DENIED | 0 | 0∣0∣0 | 0 | 0∣0∣0 | 0 | $0 |
| APPLICATIONS WITHDRAWN | 3 | 127,130∣0∣127,130 | 0 | 127,130∣0∣0 | 0 | $0 |
| FILES CLOSED FOR INCOMPLETENESS | 0 | 0∣0∣0 | 0 | 0∣0∣0 | 0 | $0 |
| Aggregated Statistics For Year 2005_(Based on 1 full and 2 partial tracts)_ | ||||||
|---|---|---|---|---|---|---|
| A) ConventionalHome Purchase Loans | B) Refinancings | C) Non-occupant Loans on < 5 Family Dwellings (A & B) | ||||
| Number | Average Value | Number | Average Value | Number | Average Value | |
| LOANS ORIGINATED | 80 | 128,803∣39∣128,803 | 39 | 128,803∣39∣138,814 | 5 | $114,226 |
| APPLICATIONS APPROVED, NOT ACCEPTED | 11 | 124,329∣7∣124,329 | 7 | 124,329∣7∣121,823 | 0 | $0 |
| APPLICATIONS DENIED | 3 | 145,867∣0∣145,867 | 0 | 145,867∣0∣0 | 0 | $0 |
| APPLICATIONS WITHDRAWN | 7 | 145,004∣2∣145,004 | 2 | 145,004∣2∣136,085 | 0 | $0 |
| FILES CLOSED FOR INCOMPLETENESS | 1 | 173,950∣0∣173,950 | 0 | 173,950∣0∣0 | 0 | $0 |
| Aggregated Statistics For Year 2004_(Based on 1 full and 2 partial tracts)_ | ||||||
|---|---|---|---|---|---|---|
| A) ConventionalHome Purchase Loans | B) Refinancings | C) Non-occupant Loans on < 5 Family Dwellings (A & B) | ||||
| Number | Average Value | Number | Average Value | Number | Average Value | |
| LOANS ORIGINATED | 108 | 123,167∣51∣123,167 | 51 | 123,167∣51∣120,119 | 9 | $98,490 |
| APPLICATIONS APPROVED, NOT ACCEPTED | 11 | 119,278∣17∣119,278 | 17 | 119,278∣17∣120,418 | 3 | $79,057 |
| APPLICATIONS DENIED | 3 | 136,467∣1∣136,467 | 1 | 136,467∣1∣110,000 | 1 | $110,000 |
| APPLICATIONS WITHDRAWN | 4 | 110,772∣3∣110,772 | 3 | 110,772∣3∣114,377 | 0 | $0 |
| FILES CLOSED FOR INCOMPLETENESS | 0 | 0∣0∣0 | 0 | 0∣0∣0 | 0 | $0 |
| Aggregated Statistics For Year 2003_(Based on 1 full and 2 partial tracts)_ | ||||||
|---|---|---|---|---|---|---|
| A) ConventionalHome Purchase Loans | B) Refinancings | C) Non-occupant Loans on < 5 Family Dwellings (A & B) | ||||
| Number | Average Value | Number | Average Value | Number | Average Value | |
| LOANS ORIGINATED | 122 | 123,494∣140∣123,494 | 140 | 123,494∣140∣115,644 | 13 | $87,988 |
| APPLICATIONS APPROVED, NOT ACCEPTED | 18 | 115,005∣24∣115,005 | 24 | 115,005∣24∣112,103 | 2 | $138,305 |
| APPLICATIONS DENIED | 0 | 0∣2∣0 | 2 | 0∣2∣155,600 | 0 | $0 |
| APPLICATIONS WITHDRAWN | 4 | 91,878∣4∣91,878 | 4 | 91,878∣4∣107,785 | 0 | $0 |
| FILES CLOSED FOR INCOMPLETENESS | 1 | 149,910∣2∣149,910 | 2 | 149,910∣2∣92,300 | 0 | $0 |
| Aggregated Statistics For Year 2002_(Based on 1 full and 2 partial tracts)_ | ||||||
|---|---|---|---|---|---|---|
| A) ConventionalHome Purchase Loans | B) Refinancings | C) Non-occupant Loans on < 5 Family Dwellings (A & B) | ||||
| Number | Average Value | Number | Average Value | Number | Average Value | |
| LOANS ORIGINATED | 116 | 120,770∣131∣120,770 | 131 | 120,770∣131∣111,327 | 6 | $85,608 |
| APPLICATIONS APPROVED, NOT ACCEPTED | 12 | 116,966∣13∣116,966 | 13 | 116,966∣13∣91,492 | 0 | $0 |
| APPLICATIONS DENIED | 1 | 48,080∣0∣48,080 | 0 | 48,080∣0∣0 | 0 | $0 |
| APPLICATIONS WITHDRAWN | 4 | 124,178∣4∣124,178 | 4 | 124,178∣4∣118,930 | 1 | $90,000 |
| FILES CLOSED FOR INCOMPLETENESS | 0 | 0∣0∣0 | 0 | 0∣0∣0 | 0 | $0 |
| Aggregated Statistics For Year 2001_(Based on 1 full and 2 partial tracts)_ | ||||||
|---|---|---|---|---|---|---|
| A) ConventionalHome Purchase Loans | B) Refinancings | C) Non-occupant Loans on < 5 Family Dwellings (A & B) | ||||
| Number | Average Value | Number | Average Value | Number | Average Value | |
| LOANS ORIGINATED | 90 | 117,724∣119∣117,724 | 119 | 117,724∣119∣100,043 | 7 | $74,764 |
| APPLICATIONS APPROVED, NOT ACCEPTED | 10 | 129,454∣14∣129,454 | 14 | 129,454∣14∣98,663 | 1 | $35,000 |
| APPLICATIONS DENIED | 2 | 117,140∣1∣117,140 | 1 | 117,140∣1∣79,000 | 0 | $0 |
| APPLICATIONS WITHDRAWN | 5 | 122,414∣3∣122,414 | 3 | 122,414∣3∣89,363 | 0 | $0 |
| FILES CLOSED FOR INCOMPLETENESS | 0 | 0∣1∣0 | 1 | 0∣1∣81,410 | 0 | $0 |
| Aggregated Statistics For Year 2000_(Based on 1 full and 2 partial tracts)_ | ||||||
|---|---|---|---|---|---|---|
| A) ConventionalHome Purchase Loans | B) Refinancings | C) Non-occupant Loans on < 5 Family Dwellings (A & B) | ||||
| Number | Average Value | Number | Average Value | Number | Average Value | |
| LOANS ORIGINATED | 67 | 103,254∣23∣103,254 | 23 | 103,254∣23∣92,726 | 2 | $74,470 |
| APPLICATIONS APPROVED, NOT ACCEPTED | 8 | 91,261∣3∣91,261 | 3 | 91,261∣3∣85,000 | 0 | $0 |
| APPLICATIONS DENIED | 3 | 110,000∣1∣110,000 | 1 | 110,000∣1∣79,200 | 0 | $0 |
| APPLICATIONS WITHDRAWN | 1 | 67,530∣0∣67,530 | 0 | 67,530∣0∣0 | 0 | $0 |
| FILES CLOSED FOR INCOMPLETENESS | 1 | 142,830∣0∣142,830 | 0 | 142,830∣0∣0 | 0 | $0 |
| Aggregated Statistics For Year 1999_(Based on 1 full and 2 partial tracts)_ | ||||||
|---|---|---|---|---|---|---|
| A) ConventionalHome Purchase Loans | B) Refinancings | C) Non-occupant Loans on < 5 Family Dwellings (A & B) | ||||
| Number | Average Value | Number | Average Value | Number | Average Value | |
| LOANS ORIGINATED | 74 | 92,173∣41∣92,173 | 41 | 92,173∣41∣88,423 | 1 | $65,670 |
| APPLICATIONS APPROVED, NOT ACCEPTED | 6 | 82,370∣4∣82,370 | 4 | 82,370∣4∣87,448 | 0 | $0 |
| APPLICATIONS DENIED | 2 | 69,160∣1∣69,160 | 1 | 69,160∣1∣123,570 | 0 | $0 |
| APPLICATIONS WITHDRAWN | 0 | 0∣1∣0 | 1 | 0∣1∣91,690 | 0 | $0 |
| FILES CLOSED FOR INCOMPLETENESS | 0 | 0∣0∣0 | 0 | 0∣0∣0 | 0 | $0 |
Detailed PMIC statistics for the following Tracts: 0101.00, 0102.00, 0103.00
2002 - 2018 National Fire Incident Reporting System (NFIRS) incidents
See full National Fire Incident Reporting System statistics for Belvidere, IL
| Most common first names in Belvidere, IL among deceased individuals | ||
|---|---|---|
| Name | Count | Lived (average) |
| Robert | 144 | 74.9 years |
| William | 134 | 73.8 years |
| John | 125 | 74.6 years |
| Mary | 111 | 79.4 years |
| George | 99 | 78.7 years |
| Charles | 93 | 75.7 years |
| Helen | 85 | 83.6 years |
| James | 80 | 68.0 years |
| Dorothy | 75 | 78.1 years |
| Harold | 68 | 75.8 years |
| Most common last names in Belvidere, IL among deceased individuals | ||
|---|---|---|
| Last name | Count | Lived (average) |
| Johnson | 103 | 78.3 years |
| Smith | 78 | 77.7 years |
| Anderson | 61 | 74.2 years |
| Nelson | 52 | 77.9 years |
| Peterson | 45 | 76.9 years |
| Larson | 36 | 79.9 years |
| Swanson | 30 | 74.4 years |
| Jones | 28 | 75.0 years |
| Miller | 24 | 78.5 years |
| Schwebke | 24 | 80.5 years |
Belvidere compared to Illinois state average:
- Median house value below state average.
- Unemployed percentage below state average.
- Black race population percentage significantly below state average.
- Hispanic race population percentage above state average.
- Median age below state average.
- Length of stay since moving in above state average.
- Percentage of population with a bachelor's degree or higher below state average.
Belvidere on our top lists:
- #34 on the list of "Top 101 cities with the smallest racial income disparities between White and Black householders (with at least 200 householders)"
- #91 on the list of "Top 101 cities with the most residents born in Other South America (population 500+)"
- #97 on the list of "Top 101 cities with largest percentage of males in industries: manufacturing (population 5,000+)"
- #100 on the list of "Top 101 cities with largest percentage of males in occupations: production occupations (population 5,000+)"
There are 47 pilots and 75 other airmen in this city.

Top Patent Applicants
| David S. Behling (19) Scott Trenhaile (14) James Z. Liu (12) Adam Michael White (11) Adam M. White (10) | Timothy Michael Mayer (6) Joseph A. Binka (5) Michael N. Kloos (5) George W. Knoll (4) Don Peterson (4) |
|---|
Total of 185 patent applications in 2008-2024.