Altered parvalbumin-positive neuron distribution in basal ganglia of individuals with Tourette syndrome (original) (raw)
Abstract
Tourette syndrome (TS) is a childhood neuropsychiatric disorder characterized by motor and vocal tics. Imaging studies found alterations in caudate (Cd) and putamen volumes. To investigate possible alterations in cell populations, postmortem basal ganglia tissue from individuals with TS and normal controls was analyzed by using unbiased stereological techniques. A markedly higher total neuron number was found in the globus pallidus pars interna (GPi) of TS. In contrast, a lower neuron number and density was observed in the globus pallidus pars externa and in the Cd. An increased number and proportion of the GPi neurons were positive for the calcium-binding protein parvalbumin in tissue from TS subjects, whereas lower densities of parvalbumin-positive interneurons were observed in both the Cd and putamen of TS subjects. This change is consistent with a developmental defect in tangential migration of some GABAergic neurons. The imbalance in striatal and GPi inhibitory neuron distribution suggests that the functional dynamics of cortico-striato-thalamic circuitry are fundamentally altered in severe, persistent TS.
Keywords: GABA, human, postmortem, psychiatry, tic
Tourette syndrome (TS) is a childhood neuropsychiatric disorder characterized by persistent motor and vocal tics, which may or may not abate upon entering adulthood. Tics are sudden stereotyped motor sequences of varying intensity and complexity, often preceded by compulsions or sensory phenomena. Neither the etiology nor the pathophysiology of TS is well understood. Both genetic and environmental factors are thought to be important, but the exact role of each has not yet been identified (1). Epigenetic events that increase the risk of developing tic disorder or TS include perinatal hypoxic-ischemic events that damage the periventricular germinal matrix and adjacent deep regions of the brain (2). A considerable amount of data implicates the cortico-striato-thalamo-cortical circuit in TS pathophysiology, particularly basal ganglia (BG) abnormalities. The BG, a richly interconnected set of nuclei, is essential for the initiation and correct implementation of learned sequences of motor and cognitive segments that characterize purposive behavior. The two major inputs into the BG, from the cerebral cortex and the intralaminar nuclei of the thalamus, enter into the striatum, which consists of the caudate (Cd) and putamen (Pt). The firing of cortical inputs drives activity in both medium spiny neurons (MSNs) (3) and several types of interneurons, including parvalbumin (PV)-positive (PV+) GABAergic interneurons (4). Striatal PV+ interneurons are connected by electrical junctions and form a web of inhibitory synapses throughout the striatum, coordinating the activities of MSNs, and likely increasing their threshold of firing in response to cortical inputs (5, 6). MSNs, which are the large majority of neurons in the striatum, project to the globus pallidus pars interna (GPi), either directly or indirectly via the subthalamic nucleus and the globus pallidus pars externa (GPe). These two pathways can be differentiated histologically. Substance P (SP) is contained within striatal terminals of the direct pathway, whereas met-enkephalin (enk) is contained within terminals of the indirect pathway. The GP contains a high percentage of PV+ neurons: ≈75% of GPi and 50% of GPe cells are positive for this calcium-binding protein (7). However, unlike those in the striatum, PV+ cells in the GPi are projection neurons. The GPi inhibitory projections to the thalamus have a major influence on the firing rate and rhythmic activity of both ventrolateral and intralaminar thalamic nuclei (8).
All major structures of the BG have been implicated in TS. Chemical and electrical stimulation of the Pt in both animals and humans produces tic-like stereotypies (9). Structural imaging studies have shown small, but significant, decreases in Cd and Pt volumes in TS (10), whereas functional imaging has shown decreased activity in the ventral striatum (11-13) and increases in dopaminergic terminals in the ventral striatal region of TS patients (14). Additionally, levels of neuronal activity as measured by functional MRI while patients are asked to actively suppress their tics are related in a complex manner to tic severity outside the magnet, such that neuronal activity in the right head of the Cd is inversely correlated with tic severity, whereas neuronal activity in the GP and Pt is directly correlated with tic severity (15).
In an effort to better understand the cellular abnormalities that may be present in TS, we undertook a quantitative postmortem study of the BG of individuals with TS as compared with age- and sex-matched normal controls (NCs), staining with cresyl violet, PV, met-enk, and SP. We report here that in a small number of TS patients thus far examined there is a profound and consistent imbalance in the number of PV+ neurons among structures of the BG. The number of PV+ neurons is increased in the GPi and decreased in the striatum of TS brains compared with NC. Although there may be additional abnormalities in TS yet to be discovered, these data point to a strong imbalance in PV+ inhibitory neurons in TS, which may provide explanations for TS symptomatology and pathophysiology and additional avenues for research.
Methods
Subjects. A cohort of human brains obtained from the Harvard Brain Tissue Resource Center at McLean Hospital and the Yale Department of Critical Technologies was used in this study and included five NCs (mean age, 60 ± 9.7) and three subjects with severe, persistent TS (mean age, 42 ± 11.9) (Table 2, which is published as supporting information on the PNAS web site). NC subjects were collected after routine autopsy at Yale University and Massachusetts General Hospital. The TS specimens were obtained after informed consent from the next of kin, and donated brain tissue was collected under the sponsorship of the TS Association tissue resource. This group of TS subjects was selected from a larger group of donated specimens (n = 41). Reasons for exclusion included the presence of a neurological condition that might limit the interpretation of the findings, e.g., Alzheimer's disease, brain tumors, problematic agonal events (such as a prolonged interval on a respirator before death), or an excessive postmortem interval (n = 17); an inability to locate the next of kin (n = 5); the presence of a significant, severe comorbid psychiatric disorder, e.g., schizophrenia, bipolar disorder (n = 8); or insufficient or improperly processed tissue (n = 8). Tissue sections from one hemisphere were examined by routine neuropathological tests, and all TS or NC brains with any evidence of gross pathological changes or CNS cytological abnormalities, including cellular ischemic changes, were excluded from analyses.
Each of the TS subjects was matched with one or more NC subjects on the basis of age, sex, postmortem interval, and, whenever possible, hemisphere (i.e., right vs. left). All of the subjects in this study were male. Psychiatric diagnoses were established by using a retrospective review of medical records and an extensive family questionnaire that included the medical, psychiatric, and social history of the subjects. For the diagnosis of TS, attention-deficit hyperactivity disorder, obsessive-compulsive disorder, major depressive disorder, and alcohol or drug dependence DSM-IV criteria were used. A best-estimate procedure was used once all available data had been compiled (by J.F.L. and H.G.) (16). The TS diagnostic confidence index was also estimated (17). All TS subjects had a “definite” Diagnostic and Statistical Manual-IV diagnosis of TS. They also had TS diagnostic confidence index scores of >90 and a history of severe tic symptom severity, scoring 49-50 of 50 points on the Yale Global Tic Severity Scale at the “worst ever” point in their lives (18) (see Table 2). Two cases were associated with a positive family history for TS or chronic tics, and the third case was associated with a history of perinatal hypoxia. One of the three TS subjects (case 4454) was not taking antipsychotic medications at the time of death. The other two subjects were on a variety of medications (Table 2). No subject in the NC group was receiving any psychotropic agents at the time of death.
Immunocytochemistry. Intact half brains were stored in 10% formalin. The telencephalon and brainstem were cut coronally into 2.5-cm blocks. Blocks were rinsed in PBS/0.1% NaN3 (PBS/azide) and cryoprotected in 15% sucrose. Tissue was serially sectioned at 50 μm with a cryostat or a freezing microtome, and 24 series of sections were collected.
Sections were rinsed three times in PBS, and endogenous peroxidase was quenched by incubation in 3% H2O2 for 30 min at room temperature. Sections were blocked in PBS containing 5% normal horse or goat serum and 0.1% Triton X-100 (PBS serum) for 30 min at room temperature and then incubated with the first antibody for 48 h at 4°C in PBS serum. Primary antibodies were anti-PV (1:2,500; Sigma), anti-SP (1:1,000; Immunostar, Hudson, WI), and anti-met-enk (1:1,000; Immunostar). After three washes in PBS, sections were incubated with biotinylated secondary antibodies (Vectastain Elite kit, Vector Laboratories) in PBS serum and processed for immunoperoxidase staining according to the manufacturer's instructions. Tissue from control and TS was processed concurrently and exposed to the substrate for exactly equal amounts of time.
Stereological Analyses. One series of sections, 1.2 mm apart, was stained with cresyl violet and subjected to unbiased stereological analysis with a Zeiss Axioskop 2 mot microscope equipped with an automatic stage and coupled to a computer running stereoinvestigator and neurolucida software. The Cd, Pt, GPe, and GPi regions were drawn in each section in the series based on cytoarchitectonic landmarks. When applicable, the volume of these nuclei was estimated by planimetry, which is computed by adding up the cross-sectional areas of the nucleus of interest in each section and multiplying this number by the section interval and the average section thickness (measured at the time of counting).
Nuclear profiles were counted by using the optical fractionator method with a ×40 oil-immersion objective, by randomly placing a sampling grid over each contour. Sampling grids measured 1,800 × 1,800 μm for GPi, 1,500 × 1,500 μm for GPe, and 3,300 × 3,300 μm for Cd and Pt. Tridimensional counting frames (180 × 180 × 15 μm for GPi and 130 × 130 × 15 μm for the other regions) with three of six exclusion borders (19, 20) were automatically placed by stereoinvestigator at each grid intersection point. Approximately 115 frames per brain were sampled in the Cd, 135 in the Pt, 412 in the GPe, and 124 in the GPi. On average, 1,202 neurons per brain were counted in the Cd, 1,264 in the Pt, 280 in the GPe, and 81 in the GPi. Neurons and glia were separately counted in each frame, distinguished on the basis of their cytological appearance. The total number of cells per region was calculated by stereoinvestigator using the formula
where Σ_Q_ was the total number of nuclei counted, t the mean section thickness, h the height of the optical dissector, asf the area sampling fraction, and ssf the section sampling fraction (20). The density for each cell type was calculated by dividing the total number of cells by the total counting volume.
For the PV-stained sections, the protocol was identical to the above, except for the sizes of the sampling grids and counting frames. Sampling grid in the GP measured 1,000 × 1,000 μm, and counting frames measured 130 × 130 × 15 μm. In the striatum the sampling grid measured 2,500 × 2,500 μm, and the counting frame measured 700 × 500 × 15 μm (magnification: ×10). The counting frames were placed in the most superficial portion of the sections (1 μm from the surface), to avoid variability caused by differential penetration of antibodies. Cell density within tissue was calculated by dividing the total number of cells by the total volume of tissue sampled. Approximately 356 frames per brain were sampled in the Cd, 417 in the Pt, 368 in the GPe, and 327 in the GPi. On average, a total of PV+ 244 cells per brain were counted in the Cd, 348 in the Pt, 172 in the GPe, and 244 in the GPi.
Three researchers (P.S.A.K., Y.K., and W.Z.) performed the majority of the stereological analyses, and the PV-immunostained sections of GPi and Pt were counted by two of them. Neither researcher was aware of the disease state of the tissue during counting. Interperson count variability was <3%.
Results
All brains from the TS cases showed a ≈60% increase in both density and total neuron number in the GPi as compared with NC. An opposite 40% decrease in neuron number and density was observed in the GPe of the same subjects (Table 1). A smaller 27% decrease in neuron density was also found in the Cd; neuron density (1,000 cells per mm3) was 55.6 ± 1.6 versus 40.6 ± 3.2 in TS and NC, respectively. These changes were remarkably consistent in our sample, such that both the increase in neuron number in the GPi and the decrease in neuron number and density in the GPe and Cd detected in TS versus NC brains were statistically significant despite the small number of subjects (P < 0.025, Mann-Whitney U test). In contrast, no significant change in neuron density in the Pt was found in TS brains compared with control (data not shown).
Table 1. Differences in total cell number in the BG of NC and TS.
| GP | Group | Volume, mm3 | No. of neurons, ×103 | Neuron density, 103 cells per mm3 | No. of glial cells, ×106 | Glial density, 103 cells per mm3 |
|---|---|---|---|---|---|---|
| GPe | NC | 491.4 ± 41.1 | 1,695 ± 304 | 3.41 ± 0.36 | 177 ± 21.4 | 372 ± 74.6 |
| TS | 442.4 ± 10.5 | 910 ± 105* | 2.05 ± 0.20* | 158 ± 6.2 | 358 ± 17.6 | |
| GPi | NC | 223.2 ± 32.8 | 540 ± 49 | 2.54 ± 0.46 | 63.5 ± 2.1 | 297 ± 42.5 |
| TS | 230.0 ± 25.7 | 905 ± 108* | 4.00 ± 0.54 | 72.4 ± 9.1 | 319 ± 39.4 |
No change in size or shape of the neuronal cell bodies was detected. The total number, density, and morphology of glial cells did not differ among TS or control brains in either the GPe or GPi. No differences in the volume of the GPe or the GPi were detected among the subjects (Table 1).
To ascertain the phenotype of neuronal cells in both the GP and the striatum, we immunostained sections for PV, which is normally expressed by the majority of GP neurons as well as in a subset of striatal interneurons, and assessed the density of these cells in various regions of the BG by unbiased sampling methods. The density of PV+ cells was higher by 122% in the GPi of the subjects with TS as compared with NC. In contrast, the brains from TS subjects exhibited a lower density of PV+ neurons in all other BG regions assessed. This difference was strongest in the Cd (51% lower) and smallest in the Pt (37%), whereas the difference in the GPe (23%) was not statistically significant (Fig. 1).
Fig. 1.

Unbiased estimates of PV cell density in three TS and three NC brains using stereological analyses. Each small square represents a single subject. Differences in PV neuronal density in the Cd, Pt, and GPi of TS patients were statistically significant (P < 0.025, Mann-Whitney U test).
PV+ cells in both pallidal regions are large, multipolar projection neurons. This morphology did not appear to differ in the brains of TS subjects (Fig. 2). In the striatum, PV+ cells are much smaller and display an extensive dendritic/axonal tree. Again, no apparent difference in PV cell morphology was present in the Cd and Pt of brains of TS cases as compared with NCs (see Fig. 3 and data not shown). However, the density of PV immunoreactivity in the neuropil (presumably reflecting the dendrites and axons of these cells) was clearly decreased in the Cd and Pt of TS cases as compared with corresponding regions of NCs (Fig. 3 and data not shown).
Fig. 2.

Increase in the number of PV-containing neurons in the GPi of TS patients. (A and B) Cresyl violet staining. (C and D) PV immunostaining. Representative sections from the GPi of NC (A and C) and TS (B and D) are shown. Note the corresponding increase in the density of total neurons and PV-containing neurons in the GPi of TS brains. V indicates blood vessels; arrows indicate neuronal cell bodies. (Scale bar: 100 μm.)
Fig. 3.
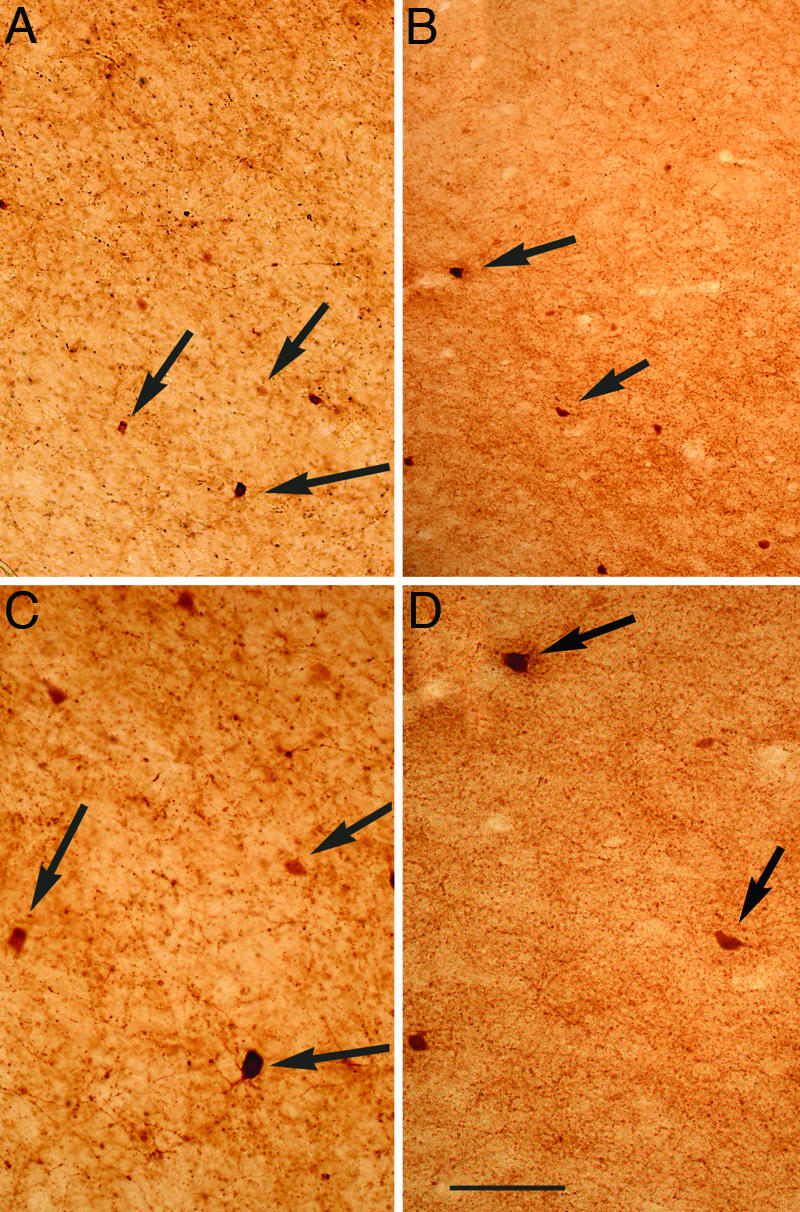
Decrease in the density of PV-containing neurons in the Cd of TS patients. PV immunostaining in the dorsolateral portion of the Cd nucleus at the level of the GP of NC (A and C) or TS (B and D). C and D are magnifications of A and B, respectively. Arrows point to cell bodies of PV+ cells. (Scale bar: 100 μm, A and B; 50 μm, C and D.)
To estimate the total number of PV+ cells, we multiplied the PV+ cell density in the GPi and GPe of each subject by the corresponding volumes (Table 3, which is published as supporting information on the PNAS web site). The results suggest that the number of PV+ neurons was 31% smaller in the GPe of patients with TS, whereas it was 129% greater in the GPi of patients with TS in comparison with NC. These changes are virtually identical to those noted for PV+ neuron density in these regions, as total volumes were not significantly different between the groups. For the Pt and the Cd, we could not obtain total volumes by stereological analyses with the available tissue. To have an estimate of total number of PV+ neurons in these regions, we used an extensive neuroimaging data set of 130 NCs and 154 TS subjects (10) and used their average Cd and Pt volumes after correcting for shrinkage caused by tissue processing as explained in the Table 3 legend. The results suggest that the numbers of PV+ neurons were 54% and 40% fewer in the Cd and Pt, respectively, of patients with TS in comparison with NC (Table 3). These differences in total PV+ cell number between NC and TS individuals are very similar to the difference in PV+ cell density reported in Fig. 1. Interestingly, the total number of PV+ neurons in the BG was decreased in TS by only 14.0%, indicating that this group of TS patients differs from the NC with respect to the distribution and not the overall number of PV neurons in the BG.
By subtracting the total PV neuron number from the total neuron number, we determined changes in PV-negative (PV-) neurons. The GPi of cases with TS appeared to have substantially fewer PV- cells: the GPi of control brains had 1.7 × 10⁵ PV- neurons, whereas the GPi from subjects with TS had less than half that number, 5.8 × 10⁴. In the GPe of the subjects with TS there were also fewer PV- neurons, 2.0 × 10⁵ compared with 6.7 × 10⁵. The differences were roughly similar, 59% in the GPi and 69% in the GPe.
To assess whether functional neurotransmitter abnormalities may be present in TS, we performed immunostaining for SP and met-enk, neuropeptides contained within striatal MSN of the direct and indirect pathways, respectively. Consistent with previous data (21), SP-positive “woolly fibers” were concentrated in the GPi, suggesting that they represented terminals of the direct pathway; in contrast, enk-positive woolly fibers were greatly enriched in the GPe although a subset reached the GPi, consistent with being terminals of the indirect pathway. No difference in staining intensity within individual woolly fibers between cases and controls was apparent. A close comparison of sections for the TS and NC cases under examination showed no differences in the apparent density or distribution of fibers immunoreactive for these neuropeptides between NC and cases of TS (data not shown).
No correlation was found between changes in PV- or cresyl violet-stained cell densities and neuroleptic intake or postmortem interval. Although TS patients had comorbid diagnoses, TS was the only diagnosis in common among them. Although two patients had positive family histories of TS, and one had a perinatal hypoxic event, no correlation existed between morphometric changes and suspected etiology. Two controls and one TS brain were at risk for secondary complications because of the agonal history (Table 2); however, no correlations were found between this history and PV+ neuron number or density.
Discussion
The data presented above provide quantitative cellular characterization of specific cell types within the BG of subjects with severe and persistent TS. Our data demonstrate a consistent and profound PV+ neuronal imbalance in the BG of the three patients examined. The striatum and the GPe have fewer PV+ neurons, whereas the GPi has substantially more. There are parallel changes in total neuron number in the GPe and GPi (46% decrease in GPe and 68% increase in GPi of TS as compared with NC) and the changes in the PV+ neuron distribution partially account for these changes in total neuron number. Confirming earlier studies in TS (22), no changes were detected in the apparent density of MSN projections in either the SP-immunoreactive direct or the enk-positive indirect pathways.
Taking the BG as a whole, there is a small (14%) nonsignificant decrease in PV+ neurons in TS (Table 3), whereas the distribution of PV cells is strikingly altered in TS, with far more PV+ cells in the GPi and substantially fewer in other regions of the BG, particularly the Cd (Fig. 4). With unbiased sampling methods, 51% and 37% statistically significant decreases in PV neuron density were detected in the Cd and Pt, respectively, of TS patients. In contrast, in the GPi in the same subjects, both density and number of PV+ neurons were more than twice as large in TS as compared with NC (Fig. 4). We think that the above changes in PV+ neuron distribution represent altered number of cells and that it is unlikely that they reflect changes in PV expression for two reasons. First, the PV+ cell changes in the GPi are paralleled by changes in total neuron number, as assessed by cresyl violet staining; and second, it is improbable that variables that might affect the expression or the immunodetection of PV would manifest in opposite ways among closely spaced BG subregions. For example, the increase in cresyl violet-stained neurons in the GPi from subjects with TS is fully accounted for by the increase in PV+ cells in this nucleus. However, PV expression has been shown to be sensitive to neurotransmitter changes, such as those elicited by cocaine exposure (23), and we cannot completely rule out that complex changes in both the number of neurons and PV expression occur in TS.
Fig. 4.

Altered distribution of PV+ neurons in the BG of NC and TS individuals. Differences in total PV cell number in the entire BG was not statistically significant between NC and TS, whereas distribution among different BG regions was significantly altered. Note that although NC subjects had a relatively even PV neuron distribution between striatum and GP, in TS there is an increased proportion of PV neurons in the GP, caused by a decrease in Cd/Pt and an increase in the GPi.
Our data also suggest that other neuronal populations besides PV neurons may be affected in TS. In the Cd, the observed 27% decrease in total neuron density cannot be accounted for by the decrease in density of PV+ interneurons, because PV+ cells represent only ≈0.5% of the total neuron number in this region. We hypothesize that the Cd of TS individuals could have a decrease in other types of interneurons, as MSN projections in the GP appear to be qualitatively unchanged. However, we must await unbiased estimations of the total number of MSNs by using appropriate markers to definitively settle the question of whether MSNs are altered in TS. The decrease in PV+ and PV- neurons in the Cd is consistent with the small (<5%) decreases in Cd volume that is present in both children and adults with TS (24), a decrease that in children is also correlated with tic severity later in life (25). In NC, PV+ neurons are the majority of neurons in the GP, representing 60% and 68% of the total neurons in GPe and GPi, respectively. In TS, a 46% statistically significant decrease in total neuron number was observed in the GPe, whereas the decrease in number of PV+ cells was not statistically significant in this region, suggesting a change in PV- cells. Similarly, there appears to be a decrease in non-PV+ neurons in the GPi from subjects with TS, because the proportion of PV+ is much higher in the GPi of TS patients. These data suggest that parallel changes may be occurring in a PV- population of cells in this disorder. Future studies will have to clarify the nature of these PV- neurons that in the striatum and the pallidum are changed in TS. Although PV's calcium binding ability has been hypothesized to affect refractory hyperpolarization, and therefore, firing frequency (26), whether there are any functional differences between PV+ and PV- neurons in the GP is currently unclear.
The PV+ neuron deficit in the TS striatum fits both traditional circuit-based models of BG pathophysiology (27) and emerging oscillation models (28, 29). In the traditional circuit, cortical input excites PV+ interneurons (30), which, in turn, powerfully inhibit MSNs (5), maintaining the characteristic low activity of the striatum. The loss of PV+ interneurons (and, possibly, other interneurons) in this circuit should lead to MSN hyperactivity and elicit hyperkinesis. Recent recordings from monkeys indicate that, at rest, striatal activity is synchronized at a beta-band oscillatory frequency (15-30 Hz); during movement, certain localized striatal sites desynchronize, resynchronizing after the movement ceases (31). Other in vivo recordings suggest that high-amplitude spindle and theta-band oscillatory frequencies are prominent in the striatum of awake rats (32). Because PV+ striatal interneurons form an electrically coupled inhibitory network that can entrain large assemblies of neurons (4-6), PV+ interneurons may play a critical role in the synchrony of striatal oscillations and their modulation by the cerebral cortex and thalamus (32). Hence a deficit in striatal PV+ interneurons may lead to inappropriate desynchrony of small populations of striatal MSNs, which presumably results in tic-like behavior.
The potential role of PV+ interneuron deficits in promoting tic-like behavior finds confirmation in a hamster model of idiopathic paroxysmal dystonia. The dtsz hamster phenotype shares many features with TS, including facial contortions, co-contractions of opposing muscle groups (33), and a similar age-dependent time course (34). Remarkably, the dtsz hamster also has a strikingly similar reduction in striatal PV+ interneuron number (41% decrease, compared with 54% decrease in Cd of TS) (35). These emerging lines of data strongly support a role for striatal PV+ interneuron deficit in TS and other hyperkinetic disorders.
Intriguingly, the changes we observed in the GP do not easily fit with classic models of the BG. Microinjection studies in monkeys provide evidence for the involvement of projections from the ventral Cd to the GPe in tic-like stereotypies (36, 37). Further, the GPe sends direct projections to all other nuclei of the BG and the thalamus and appears to serve as a pacemaker of the BG (38). Hence the overall 46% decrease in total neuron number in the GPe in our cohort of severe cases of TS may implicate a profound change on overall BG oscillatory activity. However, beyond our data, support for a GPe defect in tic production remains limited.
Because the GPi is a major output of the BG and prominently involved in processing sensorimotor information, it is likely to figure centrally in kinetic disorder pathophysiology. Recent models of BG function have suggested that altered patterns of GPi discharge might be important in movement disorders (39). Recordings from the GPi analogue in the dtsz hamster reveal aberrant firing patterns that decrease as the hamster ages and the symptoms disappear (40). Similarly irregular firing patterns have also been recorded in the GPi of humans either with severe dystonia or severe TS (41).§§ Although it is possible that these firing patterns may be a downstream effect of striatal abnormalities in these conditions, they highlight the possible significance of an intrinsic GPi defect. An increase of >100% of PV+ GPi neurons in TS, increasing by 68% the overall GPi neuronal population, may very well generate aberrant firing patterns, which in turn may elicit secondary effects at the thalamic level. For example, excessive inhibitory input may provoke rebound excitation in thalamic relay nuclei or alter the pace of their oscillatory activity (42).
Although other cell populations may have also been affected, these major changes in PV+ neuron distribution in the BG can be expected to have a dramatic effect in cortico-striato-thalamo-cortical functioning and may suggest possible etiologies for TS. A hypothesis consistent with an altered distribution in the absence of major changes in number of PV cells would be a defect in PV+ cell migration. During embryogenesis, PV+ interneurons tangentially migrate from the medial ganglionic eminence (MGE), the precursor of the GP, to the lateral ganglionic eminence, the precursor to the striatum, as well as to the cortex and hippocampus. Future studies should investigate whether other PV+ neuron populations are similarly affected or whether these changes are specific to the BG. The Nkx2.1 gene, which is necessary for the specification of the MGE, is also required for the specification of these interneurons of the striatum, whereas the Dlx1/Dlx2 and Lhx6 genes are required for their migration (43, 44). Thus, a possible explanation for our data is that abnormalities in these or related genes during development cause altered migration of neurons arising from the MGE in TS patients. It is interesting to note that haploinsufficiency for Nkx2.1 has been associated with a mild form of dyskinesia and chorea in humans (45, 46). In addition to genetic factors, environmental factors may play an important role. For example, one possible environmental culprit might be perinatal hypoxia, as these PV+ striatal interneurons appear to be sensitive to ischemic insults (47). Our data suggest that future gene-environmental interaction studies focused on the development of PV+ GABAergic cells may be a worthwhile line of inquiry for TS.
Supplementary Material
Supporting Tables
Acknowledgments
We thank Dr. Francine Benes and the personnel at the Harvard Brain Tissue Resource Center for help in tissue preservation and storage and suggestions in tissue processing techniques; and Drs. Brian Ciliax and Neal Swerdlow and other members of the Tourette Syndrome Association Scientific Advisory Board and Tissue Committee for organizing tissue collection and providing essential suggestions and encouragement. This work was supported by National Institutes of Health Grant P01 MH49351, the Tourette Syndrome Association, and Yale University School of Medicine.
Author contributions: P.S.A.K., C.B.S., M.L.S., J.F.L., and F.M.V. designed research; P.S.A.K., W.Z., Y.K., H.G., C.B.S., M.L.S., J.F.L., and F.M.V. performed research; M.D. contributed new reagents/analytic tools; P.S.A.K., M.L.S., J.F.L., and F.M.V. analyzed data; and P.S.A.K. and F.M.V. wrote the paper.
This paper was submitted directly (Track II) to the PNAS office.
Abbreviations: TS, Tourette syndrome; Cd, caudate; Pt, putamen; GP, globus pallidus; GPi, GP pars interna; GPe, GP pars externa; BG, basal ganglia; MSN, medium spiny neuron; PV, parvalbumin; NC, normal control; SP, substance P; enk, enkephalin.
Footnotes
§§
Zhuang, P., Hallett, M., Zhang, X. H. & Li, Y., Society for Neuroscience 34th annual meeting, Oct. 23-27, 2004, San Diego (abstr.).
References
- 1.Leckman, J. F. (2002) Lancet 360**,** 1577-1586. [DOI] [PubMed] [Google Scholar]
- 2.Whitaker, A. H., Van Rossem, R., Feldman, J. F., Shonfeld, I. S., Pinto-Martin, J. A., Tore, C., Shaffer, D. & Paneth, N. (1997) Arch. Gen. Psychiatry 54**,** 847-856. [DOI] [PubMed] [Google Scholar]
- 3.Wilson, C. J. (1986) Brain Res. 367**,** 201-213. [DOI] [PubMed] [Google Scholar]
- 4.Kita, H., Kosaka, T. & Heizmann, C. W. (1990) Brain Res. 536**,** 1-15. [DOI] [PubMed] [Google Scholar]
- 5.Koos, T. & Tepper, J. M. (1999) Nat. Neurosci. 2**,** 467-472. [DOI] [PubMed] [Google Scholar]
- 6.Plenz, D. (2003) Trends Neurosci. 26**,** 436-443. [DOI] [PubMed] [Google Scholar]
- 7.Hardman, C. D. & Halliday, G. M. (1999) Movement Disorders 14**,** 626-633. [DOI] [PubMed] [Google Scholar]
- 8.Albin, R. L., Young, A. B. & Penney, J. B. (1989) Trends Neurosci. 12**,** 366-375. [DOI] [PubMed] [Google Scholar]
- 9.Alexander, G. E. & DeLong, M. R. (1985) J. Neurophysiol. 53**,** 1417-1430. [DOI] [PubMed] [Google Scholar]
- 10.Peterson, B. S., Thomas, P., Kane, M. J., Scahill, L., Zhang, H., Bronen, R., King, R. A., Leckman, J. F. & Staib, L. (2003) Arch. Gen. Psychiatry 60**,** 415-424. [DOI] [PubMed] [Google Scholar]
- 11.Stoetter, B., Braun, A. R., Randolph, C., Gernert, J., Carson, R. E., Herscovitch, P. & Chase, T. N. (1992) Adv. Neurol. 58**,** 213-226. [PubMed] [Google Scholar]
- 12.Braun, A. R., Stoetter, B., Randolph, C., Hsiao, J. K., Vladar, K., Gernert, J., Carson, R. E., Herscovitch, P. & Chase, T. N. (1993) Neuropsychopharmacology 9**,** 277-291. [DOI] [PubMed] [Google Scholar]
- 13.Chase, T. N., Geoffrey, V., Gillespie, M. & Burrows, G. H. (1986) Rev. Neurol. (Paris) 142**,** 851-855. [PubMed] [Google Scholar]
- 14.Albin, R. L., Koeppe, R. A., Bohnen, N. I., Nichols, T. E., Meyer, P., Wernette, K., Minoshima, S., Kilbourn, M. R. & Frey, K. A. (2003) Neurology 61**,** 310-315. [DOI] [PubMed] [Google Scholar]
- 15.Peterson, B. S., Skudlarski, P., Anderson, A. W., Zhang, H., Gatenby, J. C., Lacadie, C. M., Leckman, J. F. & Gore, J. C. (1998) Arch. Gen. Psychiatry 55**,** 326-333. [DOI] [PubMed] [Google Scholar]
- 16.Leckman, J. F., Sholomskas, D., Thompson, W. D., Belanger, A. & Weissman, M. M. (1982) Arch. Gen. Psychiatry 39**,** 879-883. [DOI] [PubMed] [Google Scholar]
- 17.Robertson, M. M., Banerjee, S., Kurlan, R., Cohen, D. J., Leckman, J. F., McMahon, W., Pauls, D. L., Sandor, P. & van de Wetering, B. J. (1999) Neurology 53**,** 2108-2112. [DOI] [PubMed] [Google Scholar]
- 18.Leckman, J. F., Riddle, M. A., Hardin, M. T., Ort, S. I., Swartz, K. L., Stevenson, J. & Cohen, D. J. (1989) J. Am. Acad. Child Adolesc. Psychiatry 28**,** 566-573. [DOI] [PubMed] [Google Scholar]
- 19.Gundersen, H. J., Bagger, P., Bendtsen, T. F., Evans, S. M., Korbo, L., Marcussen, N., Moller, A., Nielsen, K., Nyengaard, J. R. & Pakkenberg, B. (1988) Acta Pathol. Microbiol. Immunol. Scand. 96**,** 857-881. [DOI] [PubMed] [Google Scholar]
- 20.West, M. J. (1993) Neurobiol. Aging 14**,** 275-285. [DOI] [PubMed] [Google Scholar]
- 21.Haber, S. N. & Watson, S. J. (1985) Neuroscience 14**,** 1011-1024. [DOI] [PubMed] [Google Scholar]
- 22.Haber, S. N., Kowall, N. W., Vonsattel, J. P., Bird, E. D. & Richardson, E. P., Jr. (1986) J. Neurol. Sci. 75**,** 225-241. [DOI] [PubMed] [Google Scholar]
- 23.Todtenkopf, M. S., Stellar, J. R., Williams, E. A. & Zahm, D. S. (2004) Neuroscience 127**,** 35-42. [DOI] [PubMed] [Google Scholar]
- 24.Peterson, B. S., Riddle, M. A., Cohen, D. J., Katz, L. D., Smith, J. C., Hardin, M. T. & Leckman, J. F. (1993) Neurology 43**,** 941-949. [DOI] [PubMed] [Google Scholar]
- 25.Bloch, M. H., Leckman, J. F. & Peterson, B. S. (2005) Neurology, in press. [DOI] [PMC free article] [PubMed]
- 26.Celio, M. R. (1990) Neuroscience 35**,** 375-475. [DOI] [PubMed] [Google Scholar]
- 27.Singer, H. S. & Minzer, K. (2003) Brain Dev. 25**,** Suppl. 1, S70-S84. [DOI] [PubMed] [Google Scholar]
- 28.Hutchison, W. D., Dostrovsky, J. O., Walters, J. R., Courtemanche, R., Boraud, T., Goldberg, J. & Brown, P. (2004) J. Neurosci. 24**,** 9240-9243. [DOI] [PMC free article] [PubMed] [Google Scholar]
- 29.Leckman, J. F., Vaccarino, F. M., Kalanithi, P. S. A. & Rothenberger, A. (2005) J. Child Psychol. Psychiatry, in press. [DOI] [PubMed]
- 30.Kita, H. (1993) Prog. Brain Res. 99**,** 51-72. [DOI] [PubMed] [Google Scholar]
- 31.Courtemanche, R., Fujii, N. & Graybiel, A. M. (2003) J. Neurosci. 23**,** 11741-11752. [DOI] [PMC free article] [PubMed] [Google Scholar]
- 32.Berke, J. D., Okatan, M., Skurski, J. & Eichenbaum, H. B. (2004) Neuron 43**,** 883-896. [DOI] [PubMed] [Google Scholar]
- 33.Loscher, W., Fisher, J. E., Jr., Schmidt, D., Fredow, G., Honack, D. & Iturrian, W. B. (1989) Movement Disorders 4**,** 219-232. [DOI] [PubMed] [Google Scholar]
- 34.Richter, A. & Loscher, W. (1998) Prog. Neurobiol. 54**,** 633-677. [DOI] [PubMed] [Google Scholar]
- 35.Gernert, M., Hamann, M., Bennay, M., Loscher, W. & Richter, A. (2000) J. Neurosci. 20**,** 7052-7058. [DOI] [PMC free article] [PubMed] [Google Scholar]
- 36.Grabli, D., McCairn, K., Hirsch, E. C., Agid, Y., Feger, J., Francois, C. & Tremblay, L. (2004) Brain 127**,** 2039-2054. [DOI] [PubMed] [Google Scholar]
- 37.Francois, C., Grabli, D., McCairn, K., Jan, C., Karachi, C., Hirsch, E. C., Feger, J. & Tremblay, L. (2004) Brain 127**,** 2055-2070. [DOI] [PubMed] [Google Scholar]
- 38.Plenz, D. & Kital, S. T. (1999) Nature 400**,** 677-682. [DOI] [PubMed] [Google Scholar]
- 39.Wichmann, T. & DeLong, M. R. (1996) Curr. Opin. Neurobiol. 6**,** 751-758. [DOI] [PubMed] [Google Scholar]
- 40.Gernert, M., Bennay, M., Fedrowitz, M., Rehders, J. H. & Richter, A. (2002) J. Neurosci. 22**,** 7244-7253. [DOI] [PMC free article] [PubMed] [Google Scholar]
- 41.Zhuang, P., Li, Y. & Hallett, M. (2004) Clin. Neurophysiol. 115**,** 2542-2557. [DOI] [PubMed] [Google Scholar]
- 42.Pedroarena, C. & Llinas, R. (1997) Proc. Natl. Acad. Sci. USA 94**,** 724-728. [DOI] [PMC free article] [PubMed] [Google Scholar]
- 43.Anderson, S. A., Marin, O., Horn, C., Jennings, K. & Rubenstein, J. L. (2001) Development (Cambridge, U.K.) 128**,** 353-363. [DOI] [PubMed] [Google Scholar]
- 44.Anderson, S., Mione, M., Yun, K. & Rubenstein, J. L. R. (1999) Cereb. Cortex 9**,** 647-654. [DOI] [PubMed] [Google Scholar]
- 45.Pohlenz, J., Dumitrescu, A., Zundel, D., Martine, U., Schonberger, W., Koo, E., Weiss, R. E., Cohen, R. N., Kimura, S. & Refetoff, S. (2002) J. Clin. Invest. 109**,** 469-473. [DOI] [PMC free article] [PubMed] [Google Scholar]
- 46.Breedveld, G. J., van Dongen, J. W., Danesino, C., Guala, A., Percy, A. K., Dure, L. S., Harper, P., Lazarou, L. P., van der Linde, H., Joosse, M., et al. (2002) Hum. Mol. Genet. 11**,** 971-979. [DOI] [PubMed] [Google Scholar]
- 47.Larsson, E., Lindvall, O. & Kokaia, Z. (2001) Brain Res. 913**,** 117-132. [DOI] [PubMed] [Google Scholar]
Associated Data
This section collects any data citations, data availability statements, or supplementary materials included in this article.
Supplementary Materials
Supporting Tables