Structural Localization of the E3 Glycoprotein in Attenuated Sindbis Virus Mutants (original) (raw)
Abstract
We have determined the three-dimensional structures of the wild-type Sindbis virus and two of its mutants that retain the E3 sequence within PE2. Using difference imaging between these mutants and the wild-type virus, we have assigned a location for the 64-amino-acid sequence corresponding to E3 in the mutant spike complex. In the wild-type virus, the spike is composed of an E1-E2 heterotrimer. The E3 protein was found to protrude midway between the center of the spike complex and the tips. Based on these results and the work of others, we propose a distribution for the functional domains of the spike proteins within the structure of wild-type Sindbis virus. Within the structure of the virus, the E1 domains form the central portion of the spike complex, while the tips are formed by the E2 domains that flare out from the center of the complex. The structural similarity between these Sindbis virus mutants and Ross River virus suggests that E3 may also be present in the latter, which is also a member of the Alphavirus genus.
Sindbis virus is a member of the Alphavirus genus within the Togaviridae family. Alphaviruses are a small group of RNA viruses that are enveloped by a host cell-derived lipid membrane. In contrast to the loose and unorganized envelopes of the orthomyxovirus and paramyxovirus families, the envelope of alphaviruses is a highly organized icosahedral structure of transmembranal virus glycoproteins and a lipid bilayer (18). Sindbis virus is composed of a 49S positive-sense RNA genome and 240 copies each of three structural proteins: two transmembranal glycoproteins (E1 and E2) and an internal capsid (C) protein (41, 45). The structural proteins assemble into two concentric icosahedral shells arranged about the genome in a T=4 icosahedral lattice (6, 22, 37). The inner lattice is the nucleocapsid, which has an outer radius of approximately 200 Å and consists of 240 copies of capsid protein (7, 9, 37, 38). The envelope extends from an inner radius of 200 Å to an outer radius of 325 Å and is composed of 80 trimers of E1/E2 heterodimers which are embedded in a lipid bilayer (37). The (E1/E2)3 heterotrimers protrude 50 Å from the surface of the virus and flare out into three distinct lobes forming a trimer 230 Å in diameter (37).
The structural proteins are translated from a 26S subgenomic RNA as a 130-kDa precursor protein that is subsequently processed into its individual components. The 30-kDa capsid protein, the first structural protein to be translated, is autocatalytically cleaved from the nascent polypeptide shortly after synthesis. After release from the ribosome translation complex, the capsid protein condenses onto newly synthesized genomic RNA to form nucleocapsids in the cytoplasm of the infected cell. The cleavage of capsid from the growing polypeptide chain exposes a signal sequence that delivers the polypeptide to the endoplasmic reticulum, where protein synthesis continues and glycosylation begins. Translation of protein from the mRNA into the rough endoplasmic reticulum produces PE2, the precursor of E2, and E1 spike proteins, which associate rapidly into PE2/E1 heterodimers and then almost immediately into (PE2/E1)3 heterotrimers (24, 34, 57). PE2 contains a 64-amino-acid-long E3 sequence preceding the 423-amino-acid-long E2 glycoprotein (42, 46). The cleavage between E3 and E2 occurs in a post-Golgi compartment prior to the delivery of the spike trimers to the plasma membrane. This cleavage, mediated by a cellular protease, occurs at a position immediately after a four-amino-acid motif characterized as basic-X-basic-basic (13, 15, 36, 40, 54). Although the cleaved E3 glycoprotein is not present in Sindbis virus, it is found in the structure of one alphavirus, Semliki Forest virus, as a virion-associated nontransmembranal spike protein.
Despite previous three-dimensional reconstructions of Sindbis virus by electron cryomicroscopy, the organization of the E1 and E2 spikes within the trimer remains unclear (21, 37). Determination of the locations of the functional domains for both of these proteins is important because during specific stages in the virus life cycle, these proteins perform vital functions. In the case of E2, both host cell recognition and attachment have been associated with this protein (14). Antibodies directed against E2 are often neutralizing, and mutations in E2 affect both virus binding and virulence (43, 49). The relative importance of E2 in host cell binding and receptor recognition also has been demonstrated by the identification of mutants in Sindbis virus which fail to bind to chicken embryo fibroblasts (17). An additional function of E2 is the stabilization of spike-nucleocapsid interactions during assembly of progeny and destabilization of these same interactions during the next round of attachment and penetration (8, 28).
E1 appears to maintain the integrity of the icosahedral lattice (2, 3). E1 is folded into a compact metastable structure that is stabilized by intramolecular disulfide bridges, and these are essential for the integrity of the icosahedral lattice of E1-E2 associations (3, 34). In addition to the integrity of the icosahedral lattice, a domain in E1 has been linked with the ability of the virus membrane to fuse with the host cell (23). Thus, the E1 spike protein is probably responsible for the fusion event that follows attachment and introduces the virus nucleocapsid into the cytoplasm.
In this paper, we examined the organization of the glycoproteins within the trimer by three-dimensional structural analyses of wild-type Sindbis virus and two mutants which fail to cleave PE2, leaving E3 as an unambiguous 64-amino-acid structural tag covalently associated with the amino terminus of E2. From this and the work of others, we have inferred the probable locations of E2 and E1 (as well as E3) functional domains within the trimeric spike complex and used these observations to propose a model for virus attachment and penetration.
MATERIALS AND METHODS
Sindbis virus and PE2 mutants.
In the PE2 mutants of Sindbis virus, PE2 cleavage was prevented by mutation of the +1 position relative to the cleavage site (25). Conversion of this residue from an Arg in the Sindbis virus TRSB wild-type [TRSB (wt)] background to an Asn created a new site for N-linked glycosylation, and the added carbohydrate abrogated PE2 cleavage. As a result, PE2 of the mutant (TRSB-N) was incorporated into virions. The TRSB-N mutation, however, was lethal in that these PE2-containing particles were unable to infect other cells. Revertants of the TRSB-N mutation were isolated after transfection of BHK cells with infectious in vitro transcripts from pTRSB-N (the cDNA clone of the mutant). One such revertant, TRSB-NE2G216, retained the PE2 cleavage defect but acquired a second site mutation (Glu to Gly at E2 position 216) which conferred infectivity on the PE2-containing virion.
Virus purification.
The growth and purification of TRSB, TRSB-N, and TRSB-NE2G216 have been previously described. Briefly, infectious virus was harvested from cultures of infected BHK-21 cells and then purified by isopycnic density gradient centrifugation on linear 20 to 35% potassium tartrate gradients as described elsewhere (25, 39). Noninfectious TRSB-N particles were harvested after electroporation of pTRSB-N transcripts into BHK-21 cells. Virus preparations were then concentrated to titers of approximating 1012 to 1014 PFU/ml, using Centricon filters.
Radiolabeling and polyacrylamide gel analysis.
Viral proteins were 35S labeled by growing virus in the presence of [35S]methionine. BHK-21 cells were infected with virus at a multiplicity of infection of 10 PFU/ml or electroporated with the transcripts from the mutant clone pTRSB-N as described elsewhere (25). The cells were grown for 5 h in complete minimal essential medium and starved in methionine-free minimal essential medium supplemented with 5% donor calf serum and 1% penicillin-streptomycin for an additional 3 h. Once the cells were adequately starved for methionine, [35S]methionine was added to the medium to a final specific activity of 20 μCi/ml. The cells were incubated at 37°C for 12 h in the presence of [35S]methionine prior to virus purification. Labeled virus was pelleted, resuspended in 30 μl of 2× sample buffer, and heated to 100°C for 5 min. Approximately 1.5 × 10⁵ cpm each of wild-type and mutant virus was added separately to two lanes of a sodium dodecyl sulfate (SDS)–10% polyacrylamide gel prepared as described previously (25). The gel was electrophoresed for 20 h at 16-mA constant current, fixed in 40% methanol–10% acetic acid, soaked in Amplify fluorographic solution (Amersham), dyed, and exposed to film.
Specimen preparation.
Unlabeled virus specimens were prepared for electron cryomicroscopy by freezing them on copper grids coated with a film of perforated holey carbon, using established protocols (16, 20).
Electron cryomicroscopy.
Frozen grids were transferred to a Gatan cryo-specimen holder cooled to approximately −155°C and examined in a JEOL 1200 electron cryomicroscope, where micrographs were recorded at a nominal magnification of 30,000 operating at a voltage of 100 keV, using flood-beam imaging. To prevent radiation damage to the specimens, the micrographs were recorded at low electron doses of 4 to 5 electrons per Å2. Two images per specimen area were recorded, one aimed at approximately 1.5-μm underfocus and the second aimed at 2.2-μm underfocus. Since images viewed closer to focus in an electron microscope contain higher resolution detail, the 1.5-μm micrographs were taken first to reduce the amount of damage caused by electron irradiation. The higher-defocus micrograph, as a consequence, recorded double the exposure, or 8 to 10 electrons per Å2 of the specimen area. The second micrographs were taken because higher-defocus images have higher contrast. By processing both negatives separately, we were able to use the orientations from the higher-contrast images to identify the orientations of the closer-to-focus noisier images. Closer-to-focus images were used in the three-dimensional reconstructions.
Image processing and three-dimensional reconstruction.
Following electron cryomicroscopy, micrograph focal pairs were selected for computer processing. The criterion for selection was based on virus concentration (greater than 100 per micrograph), uniform ice thickness, and absence of specimen drift and image astigmatism. Selected pairs of electron micrographs were scanned on a Perkin-Elmer microdensitometer with a pixel size of 16 by 16 μm, corresponding to 5.33 by 5.33 Å in the specimen. The digitized images were displayed on a Silicon Graphics workstation, and in the case of the wild-type virus and infectious mutant, individual particle images were interactively boxed out into 256- by 256-pixel2 areas. The same particles from both micrographs were boxed out in the same order and given similar file names to identify them as image pairs of the same particles. During the processing of the last data set, that of the noninfectious mutant, an automated particle selection method which enabled us to acquire the boxed images of virus particles in a very short amount of time became available (48). The final images were boxed with the same parameters as the previous data sets. Image defocus was estimated by using the sum of the Fourier intensities of the individual selected particles (55).
Particle orientation determination and three-dimensional reconstruction were performed by using a combination of procedures described elsewhere (4, 10, 21, 27, 47). Specifically, following particle selection, the digitized particle images were masked from the background at a radius of 66 pixels (corresponding to a 352-Å radius mask surrounding particle images) and then floated onto a uniform background. Particle centers were estimated by cross-correlation with a rotationally averaged reference image (35, 47). Once an initial center was estimated, a smaller 64-pixel radius mask was placed around the particle at the estimated center to include as much of the signal from the specimen as possible while excluding the noise contributed by the background.
Initially, data processing proceeded by determining the orientations of the far-from-focus images with the goal of extrapolating the orientations to the close-to-focus images. In this analysis, initial orientations were estimated by using the self-common lines method to analyze the Fourier transforms of the individual particle images (10). In this processing, phase residuals of Fourier transforms of particle images of less than 65° were selected for refinement while those above 65° were discarded. The individual Fourier transforms were then refined against one another by using the cross-common lines method developed by Fuller (21). Particles with average cross-common line phase residuals of less than 65° were selected. The determined orientations were then used as initial orientations for the close-to-focus particles. Additional close-to-focus orientations were estimated by using modified self-common lines phase residual functions (47). Projection images were computed from the low-resolution structures and used as templates for identification of additional particle orientations in cross-common lines phase residual comparisons (12, 56). Following identification of additional particle orientations, refinement was performed on all of the particle orientations at increasingly higher resolution to obtain improved reconstructions. The cycle of orientation search, five-parameter orientation refinement, reconstruction, and template projection was repeated until no further particle orientations were identified for each sample.
Following determination of the particle orientations, the three-dimensional reconstructions were performed by using Fourier Bessel inversion (10). The final reconstructions included particle images with cross-common line phase residuals of 65° or less (10). To ensure that Fourier space was adequately sampled, we calculated the inverse eigenvalue spectrum during the interpolation step of the Fourier Bessel analysis for the final reconstructions (10, 11). In this calculation, small mean inverse eigenvalues represent a well-sampled Fourier space (11). Full icosahedral symmetry was obtained for the final reconstructions by imposing real space threefold averaging (21). By using the Explorer graphics software (NAG, Inc.), these maps were viewed and interpreted.
RESULTS
Glycoprotein composition of the viral envelope.
The protein compositions of both the wild type and the PE2-containing mutants were examined by SDS-polyacrylamide gel electrophoresis. To confirm the presence of PE2 in the mutant and to determine the background amount of E2 that might also be present, we ran 35S-radiolabeled TRSB (wt) together with the infectious revertant on SDS-polyacrylamide gels (Fig. 1). In the lane containing wild-type virus, four bands, corresponding to the capsid protein, the two spike proteins E1 and E2, and a weak PE2 band, were resolved. The wild-type PE2 band is typical and is due to a small amount of uncleaved PE2 that escapes cleavage to E2. Table 1 provides a complete summary of the protein composition, molecular weights, and glycosylation sites of Sindbis virus. As can be seen in Table 1, the E1 and E2 bands have similar molecular weights. Consequently, the E1 and E2 bands were not clearly resolved in the wild-type lane in Fig. 1.
FIG. 1.
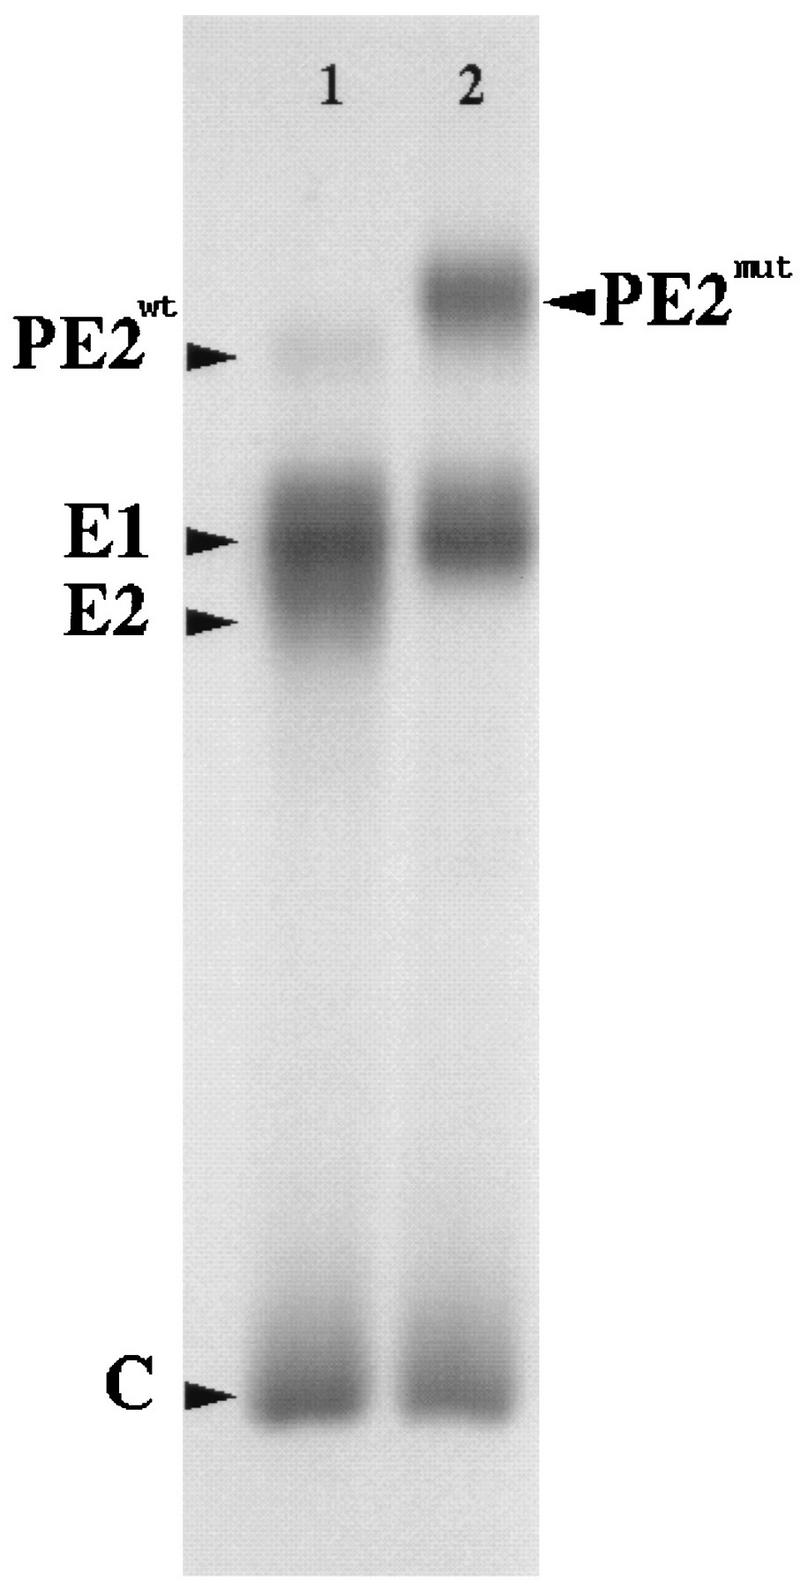
Protein composition of wild-type and noninfections PE2 mutant (PEwt and PEmut) Sindbis virus. Samples were 35S radiolabeled and analyzed by electrophoresis on an SDS–10% polyacrylamide gel. Lane 1, wild-type Sindbis virus; lane 2, TRSB-NE2G216 (infectious PE2 mutant). Positions of the capsid protein, the two spike proteins E1 and E2, the PE2mut, and a weak PE2wt band are shown. The PE2wt band is typical and is due to a small amount of uncleaved PE2 that escapes cleavage to E2. PE2mut runs as a higher-molecular-weight band due to an extra glycosylated site. The E1 and E2 bands run as a smear in the wild-type lane because of their similar molecular weights (Table 1).
TABLE 1.
Molecular weights predicted by sequences for virus grown in BHK-21 cells
| Protein | Total no. of amino acidsa | _M_r | Carbohydrate side chainsb | _M_r predicted (approx) | ||
|---|---|---|---|---|---|---|
| No. | Typec | _M_r | ||||
| E1 | 439 | 47,301 | 2 | Complex | 2,352 | 52,005 |
| E2 | 423 | 46,835 | 1 | Complex | 2,352 | 51,053 |
| 1 | Simple | 1,866 | ||||
| PE2 | 487 | 54,292 | 3 | Complex | 7,056 | 63,214 |
| 1 | Simple | 1,866 |
The wild-type and mutant PE2 glycoproteins were easily distinguishable from one another. The mutant PE2 has a higher molecular weight than the wild-type PE2 because of the added carbohydrate side chain present in the mutant PE2 (see Materials and Methods). The presence of the PE2 band and the complete absence of the E2 band in the mutant lane confirm that the only major biochemical difference between the wild type and the infectious mutant is in the forced incorporation of the E3 protein into the mutant virus caused by the prevention of PE2 cleavage. The protein profile of the noninfectious TRSB-N mutant was identical to that of the infectious mutant (data not shown).
Electron cryomicroscopy.
Figure 2 shows selected regions of the higher-defocus micrographs of the wild-type (Fig. 2A), noninfectious (Fig. 2B), and infectious (Fig. 2C) specimens. Figures 2A and B demonstrate that superficially the PE2 mutants and the wild-type virus are not significantly different from one another at the level of virus images on the micrographs. The images of the infectious particles also display characteristics similar to those seen in Fig. 2A and B (higher-magnification comparison of the infectious mutant not shown). However, in the case of the infectious specimen, empty and collapsed envelopes (Fig. 2C, white arrows) and free nucleocapsids (black arrows) are seen significantly more often than in the other two specimens. Free nucleocapsids were observed less frequently than empty or collapsed envelopes, presumably because they quickly disintegrate in the environment.
FIG. 2.
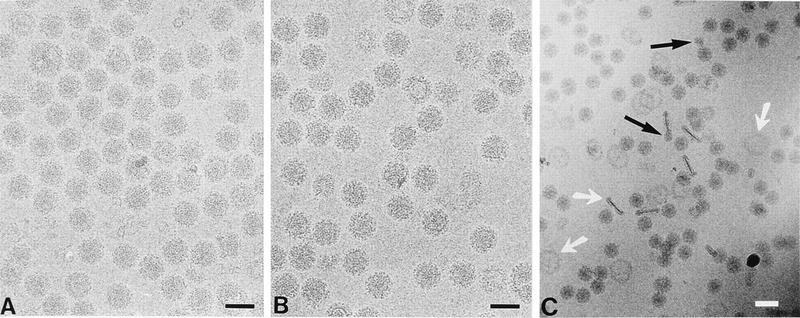
Selected regions of 100-kV flood-beam electron cryomicrographs of TRSB (wt) (A), TRSB-N (noninfectious mutant) (B), and TRSB-NE2G216 (infectious mutant) (C). In the case of the infectious mutant, the magnification is lowered to display a larger field of the specimen area. The white arrows indicate collapsed virus envelopes, while the black arrows indicate free nucleocapsids. Black scale bars, 700 Å; white scale bar, 1,000 Å.
Wild-type and mutant structures.
The three-dimensional reconstructions (Fig. 3) were each determined from single micrographs corresponding to approximately 1.5-μm underfocus for the wild type, 1.0-μm underfocus for the noninfectious PE2 mutant, and 1.5-μm underfocus for the infectious PE2 mutant. All reconstructions were performed to a nominal resolution of 25 Å, which was within the first contrast transfer function zero for all images. Examination of the mean inverse eigenvalue distribution shows that at 25 Å, all of the mean inverse eigenvalues were less than 0.1 for all three of the reconstructions. Furthermore, the percentage of mean inverse eigenvalues less than 0.01 range from 81 to 85 for the three sets of data. Thus, Fourier space is sufficiently sampled for all three reconstructions.
FIG. 3.
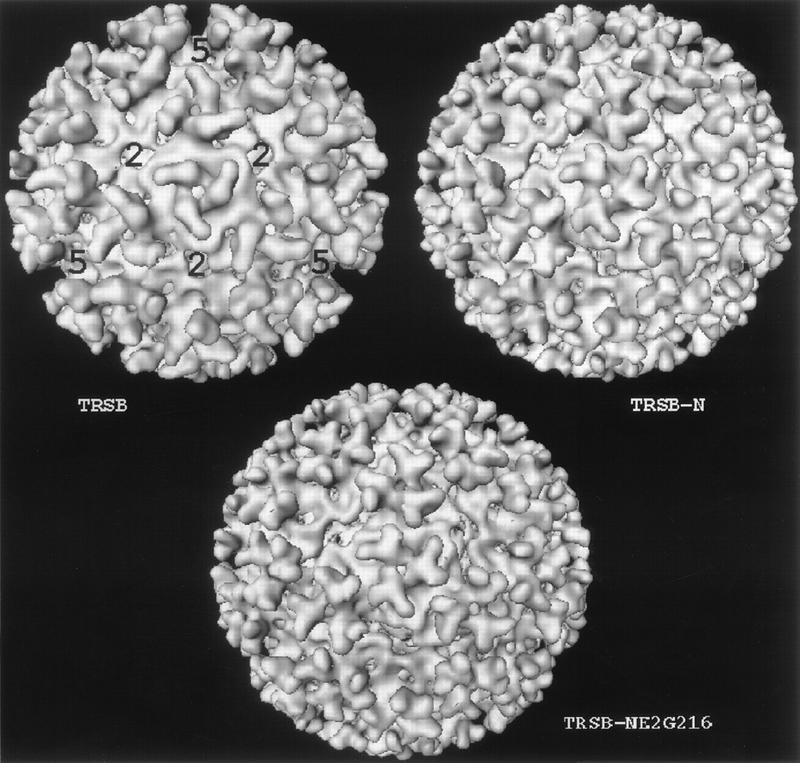
Surface representation of three-dimensional reconstructions shown from a threefold view: TRSB (wt), TRSB-N (noninfectious mutant), and TRSB-NE2G216 (infectious mutant). The appropriate contour level for surface rendering was determined for the T=4 virus envelopes by assuming a protein density of 1.325 g/cm3 and by using the published molecular weights of the viral components compiled from the sources shown in Table 1.
The numbers of particle images used for each reconstruction were 69, 57, and 69, respectively, for TRSB (wt) and for the noninfectious and infectious PE2 mutants. To evaluate the consistency of these reconstructions, the complete set of determined particle orientations for each three-dimensional map was divided into three subsets from which we performed independent reconstructions. The sets of independent reconstructions for each data set were similar in overall structural features, confirming the consistency of each structure.
The wild-type and mutant viruses all measure approximately 680 Å in diameter and show the characteristic T=4 lattice of 80 trimers on the surface of the viral envelopes (Fig. 3). Along the strict twofold edges are openings in the mass density of the icosahedral lattice. These openings measure approximately 40 by 50 Å and appear as either oval holes or clefts, depending on the absence or presence of a small density in independent reconstructions. During data analysis, the presence of this density was inconsistent, and thus it likely results from minor differences between the individual particle images.
The trimers in these structures emerge from the polar head groups of the virus membrane outer leaflet at a radius of 250 Å and extend 90 Å to a final radius of 340 Å. The base of each trimer appears as a stalk with a diameter of about 85 Å. The stalk is triangular in shape and extends to a radius of 302 Å, where the trimer then separates into three independent appendages radiating from the center at an angle of 120° from each other (Fig. 4, yellow). These finger-like appendages extend laterally outward, forming the vertices with a diameter of approximately 250 Å. The appendages extend from the trimer in a counterclockwise twist that is clearly evident in the three rendered density maps shown in Fig. 3. The counterclockwise handedness of the trimers, in alphaviruses, was confirmed previously by tilting experiments performed on Ross River virus (4).
FIG. 4.
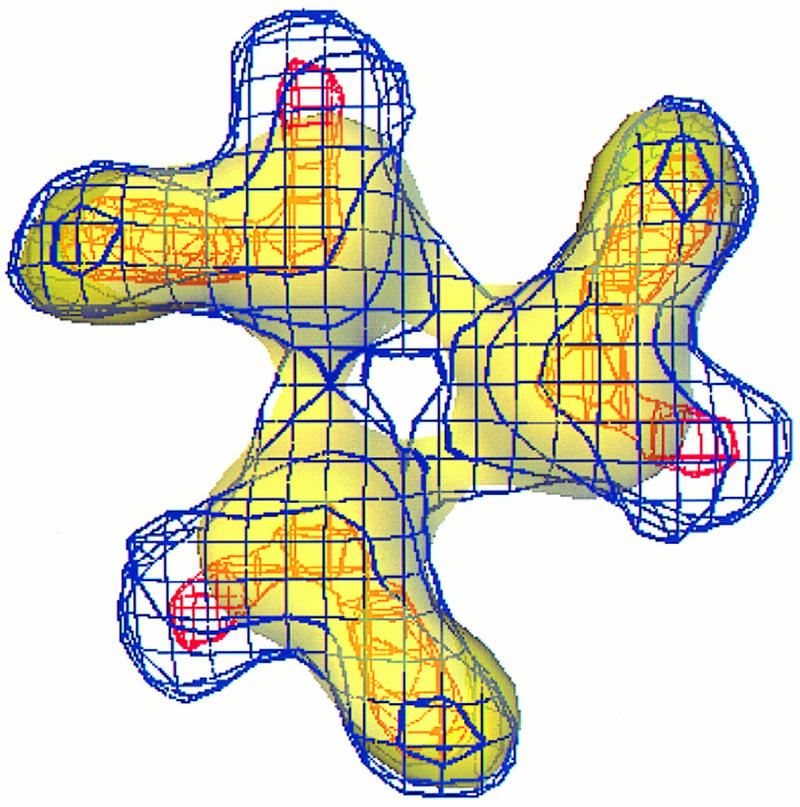
Superimposition of computationally isolated trimers from the wild type and the noninfectious PE2 mutant. The mutant trimer is displayed in wire frame with the blue density denoting 1.325 g/cm3 and the red indicating a denser region of the protein. The wild-type virus trimer is surface rendered in semitransparent yellow. We have assigned the major mutant protrusion that extends outside the wild-type trimer to the E3 region of the mutant PE2.
The structures of the wild type and the mutants show a hole or pore in the center of each of the trimers (Fig. 3 and 4). The pores measure approximately 20 Å in diameter at the top of the trimers and extend down 64 Å to the outer leaflet of the virus membrane. Beneath the top of the trimer complex, the pore expands into a triangular cavity within the stalk. To establish that the pore was a structural feature and not an artifact of contouring, the persistence of the pore was tested at different threshold levels. The pores in the reconstructions persisted over a range of threshold values accounting for 100% of the mass of 240 copies of E1, E2, and E3 to 180% (equivalent to 427 copies of E1, E2, and E3) of the mass of these proteins. In these calculations, protein volume was calculated for the viral envelope from a radius of 197 to 341 Å, using the molecular weights listed in Table 1 and assuming a density of 1.325 g/cm3. The persistence of the pore structure to a threshold value representing 180% of the molecular mass is a strong indication that the pore is genuine and present within the trimer structure.
Differences in wild-type and mutant structures.
It is in the morphology of the trimer appendages that the mutant viruses differ significantly from the wild-type virus. Superimposed maps of the wild-type and noninfectious mutant viruses reveal that the mutant appendages have a protrusion, measuring 27 by 22 by 37 Å, which emerges from approximately the middle of each appendage (Fig. 4). The density corresponding to the protrusion can also be observed in twofold equatorial sections of the three-dimensional density maps (Fig. 5B, arrowheads). As can be seen in both Fig. 4 and 5 and as confirmed by difference imaging (data not shown), the protrusion is not present in the wild-type virus structure but is present in both mutant structures. This protrusion is the major difference observed between the wild-type and mutant structures. Comparison of the difference in volume between the mutant structures and the wild type agrees with the volume estimated for the E3 peptide (using the calculated molecular mass of 9.8 kDa). We deduce from this that the E3 regions of the mutant PE2 proteins are the protrusions observed in the trimers of the mutant structures.
FIG. 5.

Equatorial sections of the wild-type (A) and infectious mutant (B) structures shown along the twofold axis. The arrows indicate the densities present in the mutant which we have attributed to the E3 region of the PE2 mutant.
In addition to the major protrusion observed in the mutant trimer, more subtle differences were observed in the inner portion of the trimer. The mutant densities extend farther toward the trimer center, partially filling in a portion of the wild-type trimer pore. Figure 4 shows that in the central region of the trimer where the pore begins, many of the densities of mutant and wild-type trimers match. However, the outer portions of the trimers show differences. The mutant appendages appear narrower than the wild-type appendages. The narrowest point of the mutant appendage measures approximately 42 Å wide just outside the portion of the trimer containing the E3 density. In comparison, the same region of the wild-type appendage is approximately 49 Å wide. This difference, however, may be too small at the resolution of both density maps to be considered a reliable difference. Another difference that can be seen in Fig. 4 is an angular shift between the appendage structures. The axis formed between the center of the trimer and the tip of the appendage is oriented differently in the mutant and wild-type trimers. In the wild-type trimer, this axis seems to be inclined more clockwise with respect to the mutant. This angular shift may be due more to the constriction and redistribution of the trimer mass than to an actual angular rotation.
DISCUSSION
Specimen morphology.
The collapsed or empty envelopes shown in Fig. 2C (white arrows) were observed in abundance in all micrographs of the infectious (TRSB-NE2G216) revertant. Also present were an unusual number of free nucleocapsids (Fig. 2C, black arrows). The presence of both free nucleocapsids and empty envelopes may be the result of a weakening in the association between the E2 endodomains and the underlying capsid proteins of the revertant, because it is presumably that interaction which is responsible for attachment of the envelope to the nucleocapsid. The putative altered E2-core association might result from a transmembranal effect caused by the second resuscitating mutation on the E2 ectodomain of this mutant. An analogous effect in which a mutation in the capsid protein resulted in the alteration of the stability of the spike ectodomains outside the virus membrane has been demonstrated (28).
Three-dimensional reconstruction.
The structures shown here have resolutions similar to those of the recently published structures of Ross River virus and Semliki Forest virus (6, 22). A comparison of these structures reveals that the structures of our PE2-containing mutants are more similar to the structures of both Ross River virus and Semliki Forest virus than to the parental wild-type Sindbis virus (6, 22). Also significant is the observation that E3 cleavage was not required for infectivity of the infectious mutant. It had been proposed that PE2 cleavage is necessary to make the spike trimer complex fusion competent (26). In addition, the trimer pore observed in our reconstructions is unique to our structures and is absent in the structures of Ross River virus and Semliki Forest virus, whose structures were determined to a resolution comparable to that for the structures in this study. Note, however, that the absence of the pore in the previous studies may be the result of different imaging conditions and therefore does not exclude the possibility of the pore’s presence in those structures. The observation of a new structural feature such as a pore is not unexpected since with both more accurate refinement of the data and higher resolution of the reconstructions, finer details begin to emerge.
Localization of E3 in alphaviruses.
Difference imaging between the wild-type and mutant virus structures shows an additional protrusion on the trimer appendages in the mutant structures. We assign this extra density in the mutants to the E3 protein sequence. Assuming a protein density of 1.325 g/cm3, the volume of the extra density observed in both mutants is consistent with the estimated mass of 9.8 kDa for E3. Discounting this presumptive E3 mass, the remaining density closely conforms to the TRSB (wt) structure. In comparing the structures, we find that there are no other major differences between the structures from the core to a radius of 302 Å. Therefore, the simplest explanation for the additional density is that this represents the E3 amino acids covalently linked to the amino terminus of E2.
It is interesting that the overall structures of the spikes in our PE2 mutants are similar to those seen in Semliki Forest virus and Ross River virus (6, 22). In all of these structures, the spikes contain a knob-like structure that is absent in wild-type Sindbis virus. Although it was not surprising for the PE2 mutants to be similar to Semliki Forest virus, which is an E3-containing alphavirus, it is surprising that the mutants are similar to Ross River virus. The additional density that has been attributed to E3, present in PE2 mutants, gives rise to pairs of densities observed in the equatorial section (indicated by arrowheads in Fig. 5B). These pairs of densities are also seen in the corresponding section in the Ross River virus reconstruction (6). It may be that like Semliki Forest virus, Ross River virus is an E3-containing alphavirus. In this context, it should be noted that trace amounts of E3 have previously been detected in Ross River virus preparations (52). Further biochemical analysis is necessary to determine if Ross River virus is an E3-containing virus.
The alphavirus spike.
The E1-E2 glycoprotein lattice of alphaviruses is a highly organized structure. Structural integrity for this lattice is derived from both the lateral interactions between trimers and the association between the endodomain of the E2 glycoprotein with the capsid proteins of the nucleocapsid (2). Chemical cross-linking studies have revealed that the alphavirus spike is a trimer of E1/E2 heterodimers and that the E1 glycoproteins exist as homotrimers within the complex (2). Fuller et al., however, have suggested a different arrangement where the E2 glycoproteins occupy the center of the spike complex as a triplex and the E1 proteins occupy the spaces between them (22, 51). Their model was derived from the observation that trimeric aggregates of the E1 protein could be recovered from virus after exposure to acid pH. This observation led to a model where the central position of the E2 proteins in the spike prevented interactions among E1 spikes until the virion was exposed to the low-pH environment of an endosome. Upon exposure to low pH, as the Fuller model suggests, the functional domains of the E1 and E2 proteins would “swivel” their position in the spike complex, allowing the E1 glycoproteins to form trimers that would initiate membrane fusion (22). The three-dimensional structure of the virus lattice, however, is not significantly affected by treatments which inactivate virus infectivity, such as low pH and brief treatment with dithiothreitol (3, 22). This finding suggests that although some reconfiguration of the distal portions of the spike trimer may occur after exposure to low pH, the complete reversal of the positions of E1 and E2 is unlikely without the loss of lateral and transmembranal protein-protein interactions that give the virion its integrity.
Recently, reconstructions of anti-E2 Fab-labeled Sindbis and Ross River viruses have been performed (44). The Fabs had been prepared from antibodies believed to bind to the specific region of the spike responsible for cell receptor recognition (30, 44, 50, 53). The authors reported that the Fab labels were localized at the extreme tips of the reconstructed trimers. The tips of the trimers are the most outwardly exposed structure of the virus and could be the first viral component to interact with the cell. Meanwhile, by comparing the structure of the wild-type virus to the structures of the PE2 mutants in this study, we conclude that the E3 amino acid sequence is located midway between the center of the trimer and the tip of the spike. Since E3 is covalently linked to the NH2 terminus of E2, we considered the presumptive E3 density as an E2 tag which places a portion of E2 between the center of the trimer and the tips of the spikes. Although recent data suggest an intimate and possibly intertwining organization of E2 with E1, we can assume from our study, combined with the work of Smith et al. (44), that the distal portion of the spike complex is mostly composed of the E2 glycoprotein (5, 33, 34).
Three observations allow us to postulate an alphavirus spike organization (Fig. 6A). First, the tips of the trimers contain the antireceptors of the virus, and these antireceptors are associated with E2 (44). The colocalization of the E3 amino acid sequence with the NH2 terminus of E2 suggests that E2 also occupies a region between the tip and the center of the trimer. Finally, E1 domains which are stabilized by the disulfide bridges required for the structural integrity of the envelope reside within the spike and are in part inaccessible to dithiothreitol reduction due to PE2 disulfide-stabilized domains residing at the periphery of the spike complex (5). Based on these observations, we propose a likely distribution for E1, E2, and E3 within the structure of the spike complex (Fig. 6A). This organization agrees with the model proposed by the cross-linking experiments of Anthony and Brown (2). Our assignment of these domains, however, does not exclude the possibility that the structural domains of the E1 and E2 proteins can coexist within the same region in the density map.
FIG. 6.

Proposed model for the functional domains of the spike proteins and membrane fusion. (A) In the spike trimer, the E2 functional domain is the most outwardly exposed structural protein, while the E1 fusigenic domain is located in the center of the spike complex. E3 is on the outer edge of the E2 spike protein. (B) During attachment, the tripod-like complex forms a specific and stable three-point interaction with the host cell through interactions with cell receptors. These interactions induce a conformational change in the structure of the trimer in which the E2 tips are separated, bringing the center of the spike and the E1 homotrimer closer to the host membrane. As the trimer tips spread apart, conformational changes that expose the fusigenic peptides of E1 occur in the spike proteins. At the same time, the center of the spike containing the E1 trimer is brought close to the host membrane, where the fusigenic peptides of E1 are exposed and initiate fusion.
By relating the known functions of the viral components to their proposed distribution, we can envision a process by which the virus penetrates the host cell (Fig. 6B). As suggested by both the localization of anti-E2 Fabs and the presumptive E3 density, E2 is the most outwardly exposed protein of the spike complex (Fig. 6A). Since E2 is involved in virus attachment, the trimer complex might form a stable tripod-like interaction between the tips of the spikes and the surface of the host cell, mediated through specific host cell receptor interactions (Fig. 6B). The organization of E1 within trimers is such that they occupy the center of the spike complex, where they form the central pore of the trimer structure. The hydrophobic domains of the E1 proteins required for membrane fusion remain buried within the complex until either the spikes form a specific host interaction with the cell receptors or the virion is exposed to a low-pH environment (19, 31, 32). As interactions with the cell continue, a conformational rearrangement of the spike allows the E1 fusigenic peptides to be exposed. Simultaneously, the changes occurring throughout the complex separate the E2 spikes, bringing the center of the spike complex and the fusigenic E1 trimers closer to the host cell membrane. Penetration of the fusigenic E1 domains into the host lipid bilayer along with simultaneous thiol reduction of E1 disulfides by thiol-disulfide exchange reactions would initiate fusion between the virus and host membranes (1, 29).
Conclusions.
Difference imaging between the three-dimensional structures of Sindbis virus TRSB and the mutant viruses TRSB-N and TRSB-NE2G216 indicated that the E3 protein is attached to the outer side of the flared portions of the spike trimer, between the distal tips and the center of the spike complex. This observation, along with the epitope mapping studies of Smith et al. (44) on Sindbis and Ross River viruses, strongly suggests that the flaring portions of the spike are composed predominantly of the E2 glycoprotein. By comparison, we also find that the E3 protein in Semliki Forest virus is in a location comparable to the E3 density present in our PE2 mutants and that a similar density exists on the spike of Ross River virus. These observations suggest that Ross River virus may, like Semliki Forest virus, contain E3.
Based on these results and those of others, we propose a distribution for the functional domains within the alphavirus spike. In the proposed spike, the functional domains of E1 form the central portion of the spike complex and the appendages are formed by the flaring of E2 from the center of the trimer. This model provides a mechanism for virus attachment through the receptor binding domains of the most outwardly exposed portion of E2, while penetration or fusion is initiated by conformational changes induced by receptor binding that exposes the fusigenic E1 domains.
ACKNOWLEDGMENTS
We thank Dennis Brown, North Carolina State University, for helpful discussions and Jaap Brink for help in editing the manuscript.
This work was supported by the National Science Foundation minority fellowship program (BIR-9406849), the National Library of Medicine (training grant LM07093), and the National Institutes of Health fellowship program (F32-AI09015) and PHS grants (AI22186, AI36040, and RR02250).
REFERENCES
- 1.Abell B A, Brown D T. Sindbis virus membrane fusion is mediated by reduction of glycoprotein disulfide bridges at the cell surface. J Virol. 1993;67:5496–5501. doi: 10.1128/jvi.67.9.5496-5501.1993. [DOI] [PMC free article] [PubMed] [Google Scholar]
- 2.Anthony R P, Brown D T. Protein-protein interactions in the alphavirus membrane. J Virol. 1991;65:1187–1194. doi: 10.1128/jvi.65.3.1187-1194.1991. [DOI] [PMC free article] [PubMed] [Google Scholar]
- 3.Anthony R P, Paredes A M, Brown D T. Disulfide bonds are essential for the stability of the Sindbis virus envelope. Virology. 1992;190:330–336. doi: 10.1016/0042-6822(92)91219-k. [DOI] [PubMed] [Google Scholar]
- 4.Baker T S, Drak J, Bina M. Reconstruction of the three-dimensional structure of simian virus 40 and visualization of chromatin core. Proc Natl Acad Sci USA. 1988;85:422–426. doi: 10.1073/pnas.85.2.422. [DOI] [PMC free article] [PubMed] [Google Scholar]
- 5.Carleton M O, Brown D T. Disulfide bridge-mediated folding of Sindbis virus glycoproteins. J Virol. 1996;70:5541–5547. doi: 10.1128/jvi.70.8.5541-5547.1996. [DOI] [PMC free article] [PubMed] [Google Scholar]
- 6.Cheng R H, Kuhn R J, Olson N H, Rossmann M G, Choi H-K, Smith T J, Baker T S. Nucleocapsid and glycoprotein organization in an enveloped virus. Cell. 1995;80:621–630. doi: 10.1016/0092-8674(95)90516-2. [DOI] [PMC free article] [PubMed] [Google Scholar]
- 7.Choi H K, Tong L, Minor W, Dumas P, Boege U, Rossmann M G, Wengler G. Structure of Sindbis virus core protein reveals a chymotrypsin-like serine proteinase and the organization of the virion. Nature. 1991;354:37–43. doi: 10.1038/354037a0. [DOI] [PubMed] [Google Scholar]
- 8.Coombs K, Brown B, Brown D T. Evidence for a change in capsid morphology during Sindbis virus envelopment. Virus Res. 1984;1:297–302. doi: 10.1016/0168-1702(84)90018-2. [DOI] [PubMed] [Google Scholar]
- 9.Coombs K, Brown D T. Organization of the Sindbis virus nucleocapsid as revealed by bifunctional cross-linking agents. J Mol Biol. 1987;195:359–371. doi: 10.1016/0022-2836(87)90657-7. [DOI] [PubMed] [Google Scholar]
- 10.Crowther R A. Procedures for three-dimensional reconstruction of spherical viruses by Fourier synthesis from electron micrographs. Philos Trans R Soc Lond B. 1971;261:221–230. doi: 10.1098/rstb.1971.0054. [DOI] [PubMed] [Google Scholar]
- 11.Crowther R A, DeRosier D J, Klug A. The reconstruction of a three-dimensional structure from projections and its application to electron microscopy. Proc R Soc Lond. 1970;317:319–340. doi: 10.1098/rspb.1972.0068. [DOI] [PubMed] [Google Scholar]
- 12.Crowther R A, Kiselev N A, Bottcher B, Berriman J A, Borisova G P, Ose V, Pumpens P. Three-dimensional structure of hepatitis B virus core particles determined by electron cryomicroscopy. Cell. 1994;77:943–950. doi: 10.1016/0092-8674(94)90142-2. [DOI] [PubMed] [Google Scholar]
- 13.Dalgarno L, Rice C M, Strauss J H. Ross River virus 26S RNA: complete nucleotide sequence and deduced sequence of the encoded structural proteins. Virology. 1983;129:170–187. doi: 10.1016/0042-6822(83)90404-x. [DOI] [PubMed] [Google Scholar]
- 14.Dalrymple J M, Schlesinger S, Russell P K. Antigenic characterization of two Sindbis envelope glycoproteins separated by isoelectric focusing. Virology. 1976;69:93–103. doi: 10.1016/0042-6822(76)90197-5. [DOI] [PubMed] [Google Scholar]
- 15.De Curtis I, Simons K. Dissection of Semliki Forest virus glycoprotein delivery from the trans-Golgi network to the cell surface in permeabilized BHK cells. Proc Natl Acad Sci USA. 1988;85:8052–8056. doi: 10.1073/pnas.85.21.8052. [DOI] [PMC free article] [PubMed] [Google Scholar]
- 16.Dubochet J, Adrian M, Chang J J, Homo J C, Lepault J, McDowall A W, Schultz P. Cryo-electron microscopy of vitrified specimens. Q Rev Biophys. 1988;21:129–228. doi: 10.1017/s0033583500004297. [DOI] [PubMed] [Google Scholar]
- 17.Dubuisson J, Rice C M. Sindbis virus attachment: isolation and characterization of mutants with impaired binding to vertebrate cells. J Virol. 1993;67:3363–3374. doi: 10.1128/jvi.67.6.3363-3374.1993. [DOI] [PMC free article] [PubMed] [Google Scholar]
- 18.Fields B N, Knipe D M. Virology. 3rd ed. Vol. 1. New York, N.Y: Raven Press; 1996. [Google Scholar]
- 19.Flynn D C, Meyer W J, Mackenzie J M, Jr, Johnston R E. A conformational change in Sindbis virus glycoproteins E1 and E2 is detected at the plasma membrane as a consequence of early virus-cell interaction. J Virol. 1990;64:3643–3653. doi: 10.1128/jvi.64.8.3643-3653.1990. [DOI] [PMC free article] [PubMed] [Google Scholar]
- 20.Fukami A, Adachi K. A new method of preparation of a self-perforated micro plastic grid and its application (I) J Electron Microsc. 1965;14:112–118. [PubMed] [Google Scholar]
- 21.Fuller S D. The T=4 envelope of Sindbis virus is organized by interactions with a complementary T=3 capsid. Cell. 1987;48:923–934. doi: 10.1016/0092-8674(87)90701-x. [DOI] [PubMed] [Google Scholar]
- 22.Fuller S D, Berriman J A, Butcher S J, Gowen B E. Low pH induces swiveling of the glycoprotein heterodimers in the Semliki Forest virus spike complex. Cell. 1995;81:715–725. doi: 10.1016/0092-8674(95)90533-2. [DOI] [PubMed] [Google Scholar]
- 23.Garoff H, Frischauf A-M, Simons K, Lehrach H, Delius H. Nucleotide sequence of cDNA coding for Semliki Forest virus membrane glycoproteins. Nature. 1980;288:236–241. doi: 10.1038/288236a0. [DOI] [PubMed] [Google Scholar]
- 24.Hashimoto K, Simizu B. A temperature-sensitive mutant of Western equine encephalitis virus with an altered envelope protein E1 and a defect in the transport of envelope glycoproteins. Virology. 1982;119:276–287. doi: 10.1016/0042-6822(82)90088-5. [DOI] [PubMed] [Google Scholar]
- 25.Heidner H W, McKnight K L, Davis N L, Johnston R E. Lethality of PE2 incorporation into Sindbis virus can be suppressed by second site mutations in E3 and E2. J Virol. 1994;68:2683–2692. doi: 10.1128/jvi.68.4.2683-2692.1994. [DOI] [PMC free article] [PubMed] [Google Scholar]
- 26.Kenney J M, Sjöberg M, Garoff H, Fuller S D. Visualization of fusion activation in the Semliki Forest virus spike. Structure. 1994;2:823–832. doi: 10.1016/s0969-2126(94)00083-2. [DOI] [PubMed] [Google Scholar]
- 27.Lawton J A, Prasad B V V. Automated software package for icosahedral virus reconstruction. J Struct Biol. 1996;116:209–215. doi: 10.1006/jsbi.1996.0032. [DOI] [PubMed] [Google Scholar]
- 28.Lee H, Brown D T. Mutations in an exposed domain of Sindbis virus capsid protein result in the production of noninfectious virions and morphological variants. Virology. 1994;202:390–400. doi: 10.1006/viro.1994.1355. [DOI] [PubMed] [Google Scholar]
- 29.Levy-Mintz P, Kielian M. Mutagenesis of the putative fusion domain of the Semliki Forest virus spike protein. J Virol. 1991;65:4292–4300. doi: 10.1128/jvi.65.8.4292-4300.1991. [DOI] [PMC free article] [PubMed] [Google Scholar]
- 30.Mendoza Q P, Stanley J, Griffin D E. Monoclonal antibodies to the E1 and E2 glycoproteins of Sindbis virus: definition of epitopes and efficiency of protection from fatal encephalitis. J Gen Virol. 1988;70:3015–3022. doi: 10.1099/0022-1317-69-12-3015. [DOI] [PubMed] [Google Scholar]
- 31.Meyer W J, Gidwitz S, Ayers V K, Schoepp R J, Johnston R E. Conformational alteration of Sindbis virion glycoproteins induced by heat, reducing agents, or low pH. J Virol. 1992;66:3504–3513. doi: 10.1128/jvi.66.6.3504-3513.1992. [DOI] [PMC free article] [PubMed] [Google Scholar]
- 32.Meyer W J, Johnston R E. Structural rearrangement of infecting Sindbis virions at the cell surface: mapping of newly accessible epitopes. J Virol. 1993;67:5117–5125. doi: 10.1128/jvi.67.9.5117-5125.1993. [DOI] [PMC free article] [PubMed] [Google Scholar]
- 33.Mulvey M, Brown D T. Assembly of the Sindbis virus spike protein complex. Virology. 1996;219:125–132. doi: 10.1006/viro.1996.0229. [DOI] [PubMed] [Google Scholar]
- 34.Mulvey M, Brown D T. Formation and rearrangement of disulfide bonds during maturation of the Sindbis virus E1 glycoprotein. J Virol. 1994;68:805–812. doi: 10.1128/jvi.68.2.805-812.1994. [DOI] [PMC free article] [PubMed] [Google Scholar]
- 35.Olgen N H, Baker T S. Magnification calibration and the determination of spherical virus diameters using cryoEM. Ultramicroscopy. 1989;30:281–298. doi: 10.1016/0304-3991(89)90057-0. [DOI] [PMC free article] [PubMed] [Google Scholar]
- 36.Orci L, Ravazzola M, Amherdt M, Madsen A, Perrelet A, Vassalli J D, Anderson R G W. Conversion of proinsulin to insulin occurs coordinately with acidification of maturing secretory vesicles. J Cell Biol. 1986;103:2273–2281. doi: 10.1083/jcb.103.6.2273. [DOI] [PMC free article] [PubMed] [Google Scholar]
- 37.Paredes A M, Brown D T, Rothnagel R, Chiu W, Schoep R J, Johnston R E, Prasad B V V. Three-dimensional structure of a membrane-containing virus. Proc Natl Acad Sci USA. 1993;90:9095–9099. doi: 10.1073/pnas.90.19.9095. [DOI] [PMC free article] [PubMed] [Google Scholar]
- 38.Paredes A M, Simon M L, Brown D T. The mass of the Sindbis virus nucleocapsid suggests it has T=4 icosahedral symmetry. Virology. 1992;187:329–332. doi: 10.1016/0042-6822(92)90322-g. [DOI] [PubMed] [Google Scholar]
- 39.Renz D, Brown D T. Characterization of Sindbis virus temperature-sensitive mutants in cultured BHK-21 and Aedes albopictus (mosquito) cells. J Virol. 1976;19:775–781. doi: 10.1128/jvi.19.3.775-781.1976. [DOI] [PMC free article] [PubMed] [Google Scholar]
- 40.Rice C M, Strauss J H. Nucleotide sequence of the 26S mRNA of Sindbis virus and deduced sequence of the encoded virus structural proteins. Proc Natl Acad Sci USA. 1981;78:2062–2066. doi: 10.1073/pnas.78.4.2062. [DOI] [PMC free article] [PubMed] [Google Scholar]
- 41.Schlesinger S, Schlesinger M. The Togaviridae and Flaviviridae. New York, N.Y: Plenum Press; 1986. [Google Scholar]
- 42.Schlesinger S, Schlesinger M J. Formation of Sindbis virus proteins: identification of a precursor of one of the envelope proteins. J Virol. 1972;10:925–932. doi: 10.1128/jvi.10.5.925-932.1972. [DOI] [PMC free article] [PubMed] [Google Scholar]
- 43.Schoepp R J, Johnston R E. Directed mutagenesis of a Sindbis virus pathogenesis site. Virology. 1993;193:149–159. doi: 10.1006/viro.1993.1111. [DOI] [PubMed] [Google Scholar]
- 44.Smith T J, Cheng R H, Olson N H, Peterson P, Chase E, Kuhn R J, Baker T S. Putative receptor binding sites on alphaviruses as visualized by cryoelectron microscopy. Proc Natl Acad Sci USA. 1995;92:10648–10652. doi: 10.1073/pnas.92.23.10648. [DOI] [PMC free article] [PubMed] [Google Scholar]
- 45.Strauss E G, Rice C M, Strauss J H. Complete nucleotide sequence of the genomic RNA of Sindbis virus. Virology. 1984;133:92–110. doi: 10.1016/0042-6822(84)90428-8. [DOI] [PubMed] [Google Scholar]
- 46.Strauss J H, Burge B W, Pfefferkorn E R, Darnell J E. Identification of the membrane protein and core protein of Sindbis virus. Proc Natl Acad Sci USA. 1968;59:533–537. doi: 10.1073/pnas.59.2.533. [DOI] [PMC free article] [PubMed] [Google Scholar]
- 47.Thuman-Commike P, Chiu W. Improved common line-based icosahedral particle image orientation estimation algorithms. Ultramicroscopy. 1997;68:231–255. doi: 10.1016/s0304-3991(97)00033-8. [DOI] [PubMed] [Google Scholar]
- 48.Thuman-Commike P, Chiu W. PTOOL: a software package for the selection of particles from electron cryomicroscopy spot-scan images. J Struct Biol. 1996;116:41–47. doi: 10.1006/jsbi.1996.0008. [DOI] [PubMed] [Google Scholar]
- 49.Tucker P C, Griffin D E. Mechanism of altered Sindbis virus neurovirulence associated with a single-amino-acid change in the E2 glycoprotein. J Virol. 1991;65:1551–1557. doi: 10.1128/jvi.65.3.1551-1557.1991. [DOI] [PMC free article] [PubMed] [Google Scholar]
- 50.Ubol S, Griffin D E. Identification of a putative alphavirus receptor on mouse neural cells. J Virol. 1991;65:6913–6921. doi: 10.1128/jvi.65.12.6913-6921.1991. [DOI] [PMC free article] [PubMed] [Google Scholar]
- 51.Vénien-Bryan C, Fuller S D. The organization of the spike complex of Semliki Forest virus. J Mol Biol. 1994;236:572–583. doi: 10.1006/jmbi.1994.1166. [DOI] [PubMed] [Google Scholar]
- 52.Vrati S, Faragher S G, Weir R C, Dalgarno L. Ross River virus mutant with a deletion in the E2 gene: properties of the virion, virus-specific macromolecule synthesis, and attenuation of virulence for mice. Virology. 1986;151:222–232. doi: 10.1016/0042-6822(86)90044-9. [DOI] [PubMed] [Google Scholar]
- 53.Vrati S, Fernon C A, Dalgarno L, Weir R C. Location of a major antigenic site involved in Ross River neutralization. Virology. 1988;162:346–353. doi: 10.1016/0042-6822(88)90474-6. [DOI] [PubMed] [Google Scholar]
- 54.Watson D G, Moehring J M, Moehring T J. A mutant CHO-K1 strain with resistance to Pseudomonas exotoxin A and alphaviruses fails to cleave Sindbis virus glycoprotein PE2. J Virol. 1991;65:2332–2339. doi: 10.1128/jvi.65.5.2332-2339.1991. [DOI] [PMC free article] [PubMed] [Google Scholar]
- 55.Zhou Z H, Hardt S, Wang B, Sherman M B, Jakana J, Chiu W. CTF determination of images of ice-embedded single particles using a graphics interface. J Struct Biol. 1996;116:216–222. doi: 10.1006/jsbi.1996.0033. [DOI] [PubMed] [Google Scholar]
- 56.Zhou Z H, Prasad B V V, Jakana J, Rixon F, Chiu W. Protein subunit structure in the herpes simplex virus A-capsid determined from 400 kV spot-scan electron cryomicroscopy. J Mol Biol. 1994;242:456–469. doi: 10.1006/jmbi.1994.1594. [DOI] [PubMed] [Google Scholar]
- 57.Ziemiecki A, Garoff H, Simons K. Formation of the Semliki Forest virus membrane glycoprotein complexes in the infected cell. J Gen Virol. 1980;50:111–123. doi: 10.1099/0022-1317-50-1-111. [DOI] [PubMed] [Google Scholar]