Allele quantification using molecular inversion probes (MIP) (original) (raw)
Abstract
Detection of genomic copy number changes has been an important research area, especially in cancer. Several high-throughput technologies have been developed to detect these changes. Features that are important for the utility of technologies assessing copy number changes include the ability to interrogate regions of interest at the desired density as well as the ability to differentiate the two homologs. In addition, assessing formaldehyde fixed and paraffin embedded (FFPE) samples allows the utilization of the vast majority of cancer samples. To address these points we demonstrate the use of molecular inversion probe (MIP) technology to the study of copy number. MIP is a high-throughput genotyping technology capable of interrogating >20 000 single nucleotide polymorphisms in the same tube. We have shown the ability of MIP at this multiplex level to provide copy number measurements while obtaining the allele information. In addition we have demonstrated a proof of principle for copy number analysis in FFPE samples.
INTRODUCTION
DNA copy number changes occur in human disease and particularly in cancer. These changes include polyploidy, deletions and amplifications. In addition there are changes leading to loss of heterozygosity (LOH) without any copy number change. The identification of these changes may elucidate targets for drug treatment, shed light on the process of tumor progression and define markers that can predict the patient prognosis and pharmaceutical response (1,2). Since the development of comparative genomic hybridization (CGH) (3) many technologies have been developed to date to address this need. These include bacterial artificial chromosome (BAC) CGH (4), cDNA CGH (5) and digital karyotyping (6). BAC CGH is the most commonly used technique because it has a superior resolution and/or sensitivity when compared with these other techniques (7). More recently CGH employing several types of oligonucleotide arrays (8–12) has been described.
Some of these technologies have been scaled to assess the genome using tens of thousands of loci (8–13). In addition to the scalability, other features are important for a technology assessing copy number in cancer. These include sensitivity to detect single copy number changes, customization to assess important regions the genome, preservation of allele information and the ability to test samples that have been formaldehyde fixed and paraffin embedded (FFPE). These four features are present in various degrees in the different platforms, but are not fully satisfied by any one platform. To address these needs we apply the molecular inversion probes (MIP) technology to copy number analysis.
MIP probes have two specific homology sequences that leave a 1 bp gap when hybridized to the genome (14,15). They also contain specific tag sequences that are ultimately read on the microarray. In addition to these elements that are specific to each probe, there are two PCR primers that are common to all probes. These primers face away from each other and therefore cannot facilitate the amplification. After the probes are hybridized the reaction is split into four tubes with 1 of the 4 nt added to each tube. With the gap filled in the presence of the appropriate nucleotide a unimolecular ligation event is catalyzed. After eliminating the linear probes with exonucleases, PCRs using the common primers that now face each other is performed in the four tubes. In addition to signal amplification a fluorescent label is introduced by a PCR primer in each of the four tubes. The four reactions are then mixed and hybridized onto a tag array. As many as 22 000 single nucleotide polymorphism (SNP) markers from an individual sample can be interrogated. The MIP technology has several features that convey advantages for this application over other methods using oligonucleotide arrays. In the assay, a high degree of specificity is achieved through a combination of the unique unimolecular probe design and selective enzymology which also allows the technology to be very highly multiplexed. The tag based read-out array also conveys distinct advantages. By getting away from the use of genomic sequences to separate the signals on the array, cross hybridization levels among the different probes can be kept at a very low level allowing the quantitative signals to be collected with high precision. Herein this study we demonstrate these advantages and show the utility of MIP for the detection of genomic aberrations. Furthermore, we demonstrate the value of allele information and provide a proof of principle for the use of this technology to assess copy number in FFPE samples. These features and the customizability of the MIP probes provide important advantages for this technology.
METHODS
Samples and MIP assay
All the 44 reference cell lines were obtained from Coriell Cell Repository (Camden, NJ). The samples had the following names: NA18995, NA18621, NA18987, NA18990, NA18991, NA18594, NA18573, NA18623, NA18981, NA18974, NA18582, NA18633, NA18994, NA12234, NA10847, NA10861, NA07345, NA12156, NA10863, NA12239, NA10831, NA06991, NA11840, NA07056, NA12802, NA12813, NA11830, NA19201, NA19193, NA19204, NA19143, NA18523, NA19094, NA18870, NA19140, NA18517, NA19221, NA19102, NA19100, NA18855, NA19209 and NA19172. NA12156 was run in duplicate. In addition we obtained the following test samples from Coriell: GM1201, NA04626, NA01416, GM6061, HCC1937 BL CRL2337 and HCC1937 CRL2336. The cell lines HCC1395, UACC812, A2058 and MDA-MB-175-VII were obtained from American Tissue Cell Culture (ATCC). To minimize potential differences in DNA preparation, DNA samples were subjected to a DNA purification using Puregene kit (Gentra, Minneapolis) as recommended by the manufacturer. The PPFE samples were obtained from Cooperative Human Tissue Network (http://faculty.virginia.edu/chtn-tma/home.html), aged from 1 to 3 years old, and they were purified by Puregene kit (Gentra, Minneapolis) except the brain sample which was purified with phenol-chloroform procedure. Briefly, several 10 µm sections were xylene treated a few times to dissolve paraffin, then subjected to ethanol washes. The deparaffined and air-dried tissues were proteinase K treated at 400 µg/µl in 0.5% SDS TE buffer at 55°C with vigorous shaking overnight. The digested samples were then RNase A treated for 1 h at 37°C, phenol-chloroform extracted and then ethanol precipitated. The MIP assay on all samples was performed as described previously (15).
DATA ANALYSIS
Copy sum and copy contrast computation
Signal from each chip is background subtracted, color separated, normalized and genotypes called as described previously (16). Using the reference samples the average signal in each of the three clusters (two homozygous clusters and a heterozygous cluster) for each marker as well as the standard deviation of the signal after removing (15%) outliers are calculated. The outlier rejection only applies for calculating average properties of the marker. Later copy number is estimated for all markers in all samples. The average signal in a cluster is then set to denote two copies since most reference samples will be diploid at any given point in the genome. For homozygous clusters we only consider the signal in the relevant allele and ignore the signal in the other allele for the computation of copy number. For heterozygous clusters we consider both signals and analyze them in two (orthogonal) directions: summing them together (copy sum analysis) and taking their ratio (allele ratio analysis). If a marker in a test sample has an allele imbalance, it may be classified as homozygous and therefore the signal in the other allele ignored. In our data we determined that on average the misclassification occurs when the two alleles are present at a ratio of 7.7:1. Therefore ignoring a real signal in one allele only occurs at extreme allele imbalance ultimately making a small difference in the copy number calculation.
Copy sum analysis is a way of measuring total copy number irrespective of allele ratio, hence it is ‘hypothesis free’ in terms of allelic composition. For each allele, we perform a straight line fit (using linear regression) of the reference sample signals against their genotype cluster membership assuming that the clusters represent 0, 1 and 2 copies (Supplementary Figure S1). This provides us with a background signal (_Y_-intercept) and signal per copy (slope) for each allele so that any signal level for any given allele of any marker in any sample can be mapped to a copy number of that allele. Summing the inferred copy numbers over both alleles gives us the ‘copy sum’ which is equal to 2, on average (by construction), for the reference samples. Supplementary Figure S2A shows that sum signal (S1 + S2) has a slight dependence on genotype, for a particular example probe, as one of the two alleles produces more signal than the other for this probe. However, copy sum has, in general, no dependence on genotype (Supplementary Figure S2B) since we have calibrated the signals in each allele using the linear regressions shown in Supplementary Figure S1. The relative standard deviation of copy sum (across the reference samples) is a good measure of the reproducibility of the copy sum measurement for any given marker. In addition the number of standard deviations of a data point away from the mean provides a confidence score that this point represents a deletion or amplification. Supplementary Figure S2 also shows that signal contrast, (S1 − S2)/(S1 + S2), is not equal to 0 for heterozygotes for this particular probe, again because of the slight bias in signal between the two alleles for the given example probe. For each probe we have corrected for this potential bias by calculating copy contrast, effectively (C1 − C2)/(C1 + C2), where we normalize the signal contrast measurement so that the average copy contrast of the heterozygous reference samples is set to 0, as seen in Supplementary Figure S2B. We also compute the standard deviation of the copy contrast. The number of standard deviations of a data point away from the mean copy contrast provides a confidence score that the specific point represents an allele ratio distinct from 1:1.
Allele ratio
Allele ratio is derived from copy contrast and is given by the smaller of C1/C2 and C2/C1 (with a proviso explained below). Its main function is to provide a ratio metric that is amenable to smoothing across neighboring markers. Since we have normalized copy contrast so that it is equal to 0, on average, for heterozygous reference samples, then the average allele ratio of the heterozygous reference samples will be 1. In addition to this normalization we have ‘symmetrized’ allele ratio so that it is confined to the interval 0–1, i.e. we always make the less abundant allele appear on the numerator and the more abundant allele on the denominator. This assignation of less/more abundant alleles is done for each sample and can flip back and forth between samples for the same given marker. This is necessary in order to allow for smoothing of allele ratio data across neighboring markers, otherwise the non-1 allele ratios would average to 1 (across a large number of markers) and allele ratio information would be lost in smoothing. Since we always calculate the ratio of the less to the more abundant alleles, random measurement fluctuation of the allele ratio for heterozygous calls generates an allele ratio <1. To obtain an allele ratio closer to 1 for the heterozygous calls we did not enforce the rule of computing the ratio of the less to the more abundant allele when the allele ratio of a specific sample was within 1 SD from the average for the particular marker. Instead in these cases, the numerator and the denominator were determined by the alphabetical order of the two alleles. This correction explains why some of the computed allele ratios are >1. Even with this correction, the allele ratio of heterozygous calls is on average <1.
Sample normalization
Each sample has a single normalization constant that is used to multiply all its measured signals before comparing it against other samples. Initially, this constant is set so that each sample has the same average (log) signal across all its markers. We then perform the copy sum analysis and use all markers with copy sum relative SD <0.2 to adjust the sample normalization constant so that each sample has a median copy number of 2 for these markers (after allowing for 15% outliers). The outlier rejection is done only for the purposes of sample normalization. Later copy sum and allele ratio is computed for all markers in all samples except for those that correspond to blemished features on the chip (<1% of the data). In most cases the adjustment factor is <10% showing that our original normalization constant was well chosen. We iteratively repeat the process of performing a copy sum analysis and adjusting sample normalizations. After three iterations the normalization factors have converged within 0.1% and so no further iterations are needed. This automated sample normalization procedure works well with samples that are mostly diploid (with some chromosome abnormalities not exceeding 20–30% of the genome). However, in the case of highly mutated cancer cell lines where the diploid nature is completely overtaken by chromosome abnormalities we have overridden the above automated normalization procedure with a manual sample normalization procedure. In these cases the sample normalization factor was used as to set mode to equal 2. Clearly this is still an invalid assumption and a better normalization may be to identify the chromosome region with the smallest copy number that is also consistent with allele ratio = 1. This is a most probable diploid region and can be used to manually adjust this sample's normalization constant so that this region's average copy number is equal to 2.
Data smoothing
For both copy number and allele ratio analyses we have developed two algorithms for smoothing across neighboring markers. In the first method, a fixed number of neighbors are considered on each side of the current marker. In the second method, neighbors are considered out to a fixed distance and are weighted according to a Gaussian function dependent on this distance (Gaussian kernel smoothing). In both methods we also apply, to each marker, a weight proportional to the inverse square of the relative standard deviation of the marker's copy sum (or allele ratio) as determined by the reference samples. In this way we weight the markers according to how ‘reliable’ they are. Hence the smoothed data are less sensitive to poorly performing markers. In addition, we allow outlier rejection for a data point that is inconsistent with its neighbors.
Restriction fragment length polymorphism (RFLP)
To confirm the allele ratio abnormality in a region on chromosome 15 in the sample NA18573, we picked six SNPs that create a RFLP and are heterozygous in this sample. PCR primers amplifying ∼200 bp centered around the SNP were designed. PCRs using genomic DNA from NA18573 and six other control samples (1–3 were heterozygous for the specific SNPs of interest) as template followed by restriction digests were performed. Quantification of the heterozygous bands on 4% agorose gels was performed on Typhoon Imager (Amersham Biosciences). The allele ratio was computed using the ratio of the cut/uncut band in NA18573 after normalization using the other three control samples.
Quantitative real-time PCR
In addition to Taqman, we performed real-time PCR using SYBR green. Experiments were performed on Opticon DNA Engine (MJ Research). Beta-actin Taqman Control reagent, Taqman Universal PCR Master Mix and SYBR Green PCR Master Mix were purchased from Applied Biosystems (Foster City, CA). Additional Taqman dual labeled probes were ordered from Ryss Lab Inc. (Union City, CA). Oligos not used in Taqman were ordered from Intergrated DNA Technologies (Iowa, USA).
Real-time PCR conditions were 95°C for 10 min, 40 cycles at 95°C for 15 s, 60°C for 1 min for Taqman; 95°C for 10 min, 40 cycles at 95°C for 20 s, 60°C for 20 s, 72°C for 20 s for SYBR Green. Quantification was calculated using the standard curve method. Of the same primer set 2–40 repeats were performed on the investigated DNA samples. The results were plotted against the standard curve to obtain copy number estimation.
RESULTS
Allele copy number determination by MIP
We wanted to assess the ability of MIP to measure allele copy number. While these probes could be used to target any unique set of sequences in the genome, targeting polymorphic sites allows allelic information to be studied in addition to copy number. We utilized a panel of 21 904 SNPs in genic regions across the genome. Genic regions encompassed the exons and introns of genes as well as 5 kb on both sides of the start and stop of the transcript. Using this gene definition and the Ensembl database genes (http://www.ensembl.org/), genic regions constitute about one-third of the genome. Choosing SNPs in only the genic regions offered the ability to obtain higher density in these higher priority genomic segments. To make the panel maximally informative, highly polymorphic SNPs were chosen from the public databases. In addition we filtered out SNPs where the probe sequence (∼40 bp) was not unique in the genome or had another SNP. The average separation between markers is ∼130 kb, and the median is 52 kb. The big difference between the median and the average reflects in part the large non-genic regions in the genome.
Using this probe panel we performed the standard MIP assay on 44 normal ‘reference’ samples (43 individuals) as well as 10 ‘test’ samples (Table 1). The reference set we used was lymphoblastoid cell lines utilized in the HapMap project and representing different ethnic groups (17).
Table 1.
Samples utilized in the study
| Sample | Characteristic |
|---|---|
| GM1201 | Monosomy 21 |
| NA04626 | 3× cell line |
| NA01416 | 4× cell line |
| GM6061 | 5× cell line |
| HCC1937 BL CRL2337 | Normal cell linea |
| HCC1937 CRL2336 | Tumor cell linea |
| HCC1395 | Cancer cell line |
| UACC812 | Cancer cell line |
| A2058 | Cancer cell line |
| MDA-MB-175-VII | Cancer cell line |
| Brain tissue | FFPE normal |
| Colon tissue | FFPE normal |
| Liver tissue | FFPE normal |
| Liver tissue | FFPE normalb |
| Liver tumor tissue | FFPE tumorb |
To determine copy number and the allele ratio at each locus we performed the analysis described in the Methods section. Briefly, the first step in the analysis was to study the reference samples. We first ran our genotype-calling algorithm on all the reference samples to generate genotype calls for each sample. The genotypes are called by clustering in the single dimension of the contrast between the two allele signals (15,16). For each of the two alleles we estimate the average signal obtained from one copy in the reference set. Signal intensity obtained for an allele in a marker of a test sample is converted to copy number by comparing with the value computed from the reference set. Similarly allele ratio of the heterozygous samples in the reference samples is set to 1:1 and is used to estimate the ratio in test samples.
In addition to the basic analysis for copy number and allele ratio at every SNP, we utilized data from the surrounding SNPs for ‘smoothing’ as described in the Methods section. The smoothed results are more precise but have lower resolution than single marker data.
Quantitative performance
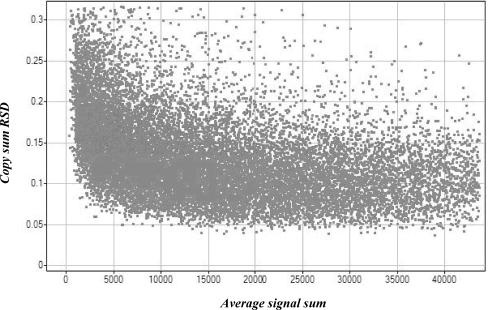
Out of 21 904 SNP markers in the panel, 18 180 passed our genotyping performance criteria. For each of these markers we have calculated copy sum relative standard deviation (copy sum RSD) in the 44 reference sample set (Supplementary Table S1) as described in the Methods section. Copy sum RSD utilizes data from all three genotype clusters to provide a single measure describing the quality of a marker. All 18 180 markers can provide some quantitative data, but markers with the lowest copy sum RSD provided higher informativeness as we show below. We noted that markers with weak signals tend to have higher copy sum RSD (Figure 1).
Figure 1.
Relationship between copy sum RSD and signal strength. For each marker copy sum RSD and the average signal strength are calculated using the reference samples as described in the Methods section. The best performing markers are those with the lowest copy sum RSD. As expected, markers with low signal are more probable to have higher copy sum RSD.
Since we utilize genotype data in the reference set to calibrate copy number estimation, we assessed the dependence of the precision of copy number determination on the number of observations in the reference set. Eight samples were taken out of the reference set and used as test samples to measure their copy number. The precision of the copy number estimation was then plotted as a function of the number of the heterozygous calls in the reference set. As shown in Supplementary Figure S3, the precision in copy number estimation is reasonable even with one observation in the reference set and it improves as the number of observation increases to ∼4.
False positive and negative rates
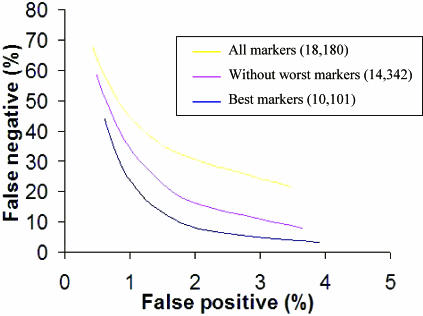
We assessed the performance of a single marker in detecting single copy changes. For each call in every sample we obtain the copy number and a significance score derived from how many standard deviations the measured copy number is away from the mean of 2. The score that is considered ‘positive’ is somewhat arbitrary and at different cut-off values the number of false positives and negatives varies. To measure the accuracy rate we treated the reference set as ‘test’ and generated quantitative data on all 44 reference samples (43 individuals). We assumed that copy number measurements significantly lower from 2 in any of the autosomes are false positives (we confirmed this hypothesis by showing that repeatability of these signals was very low consistent with the fact that the majority of these positives resulted from assay noise). We used data from the X chromosomes of the eight males in the reference set to measure the false negative rate in detecting single copy deletions. We computed the false positive and negative rates at different significance cut-off values to assess how they trade off against each other. In addition we calculated these metrics for different sets of markers with different thresholds of copy sum RSD values (Figure 2). As anticipated markers with lower copy sum RSD are better in identifying single copy changes. Unless otherwise indicated, the data presented below are from the best 10 101 markers.
Figure 2.
The trade-off between false positive and false negatives rates. The false negative rate was computed using X chromosome markers in the males, and the false positive rate was calculated using all the autosomes in the total reference sample set. The effect of selecting different sets of markers based on copy sum RSD is shown. The best markers (10 101 probes) are plotted in blue, all markers unfiltered are plotted in yellow (18 180 probes) and an intermediate cut is shown in pink (14 342 probes).
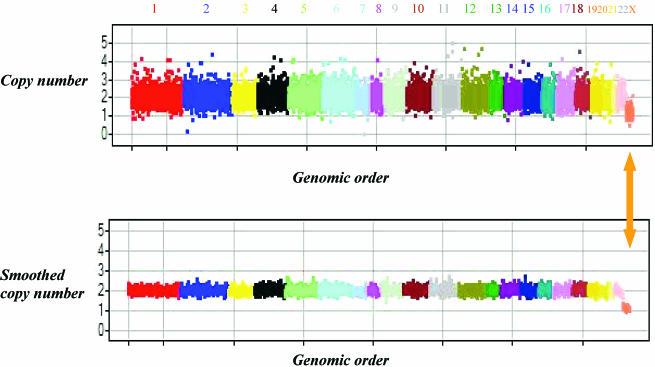
One approach to improve the false positive and negative rates is to ‘smooth’ the data utilizing information from neighboring markers trading resolution for sensitivity. Figure 3 shows example of the raw and smoothed data generated from one of the male samples.
Figure 3.
Example results from a male sample. A genomic copy number view of a male sample. Each chromosome is labeled and coded with a unique color. In both panels the _X_-axis shows the best 10 101 markers in the genomic order. The _Y_-axis shows the copy number (upper panel) and smoothed copy number using a moving window of seven markers (lower panel). The copy number of markers on the autosomes fluctuates around 2, distinctly different from markers on the X chromosome (the last chromosome marked with an arrow). As expected the fluctuation is greatly reduced with the smoothing done by surrounding markers.
Accuracy in copy number estimation
The average copy number for X markers in the males is 1.14, and the average copy number for chromosome 21 markers in a cell line with monosomy chromosome 21 is 1.22. Similarly, the average copy number for X markers is 2.75, 3.22 and 3.60 in cell line with 3, 4 and 5 X chromosomes. This non-linear effect has been observed previously with other technologies assessing copy number on arrays (4), and it is worse as the copy number increases (10). In our description of results from cancer cell lines below, we assess the precision in estimating the copy number of high degree amplifications. This is not surprising given that we know that the fluorescent signal response curve of array features is not linear when products are present at high concentrations owing to feature saturation.
Allele ratio
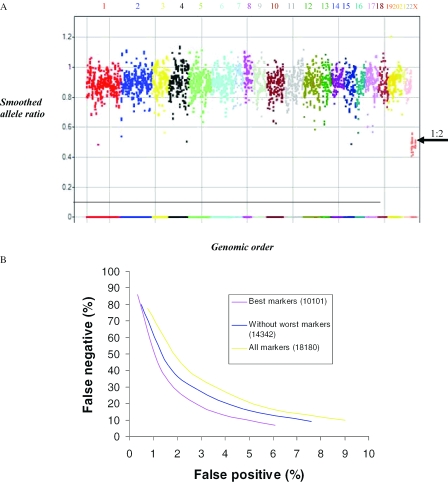
In addition to the copy number information we obtain allele ratio information for each marker in every sample. As a demonstration for the allele ratio we tested cell lines containing 3, 4 or 5 X chromosomes. Markers on the X chromosomes for the cell line containing three copies of the X chromosomes are expected to have one allele at half the concentration of the other (i.e. allele ratio of 0.5). The average measured allele ratio in this cell line was 0.48 indicating that allele ratio estimation does not have the same non-linear behavior as seen with copy number (Figure 4A). The performance of markers in detecting the aberrant (i.e. not 1:1) allele ratio in this cell line is shown in Figure 4B. We note that the difference in performance between the best and all marker sets is smaller than that seen in Figure 2 for copy number. This is because the choice of the best markers is based on copy sum and not an allele ratio measurement.
Figure 4.
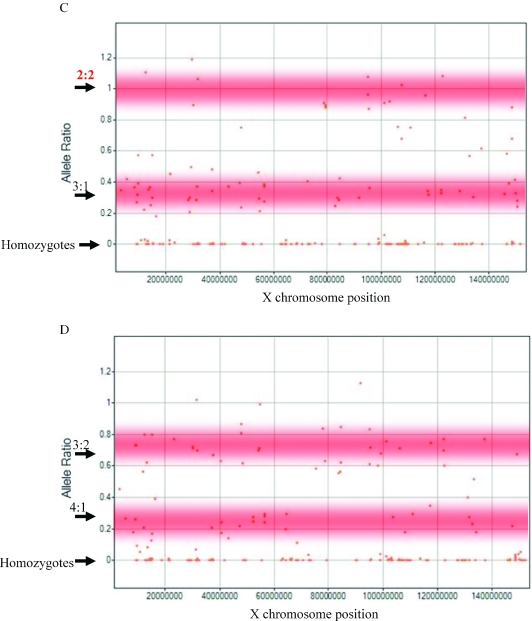
Allele ratio in polysomy X cell lines. (A) A whole genome view of the allele ratio in NA04626 cell line with 3X chromosomes. Each chromosome is labeled and coded with a unique color. The _X_-axis shows the 10 101 markers in the genomic order. The _Y_-axis shows the smoothed allele ratio. Points that are closest to the homozygous cluster are assigned an allele ratio of 0 and those near the heterozygous cluster are smoothed using data from the non-homozygous markers within the 7 marker moving window. Normal heterozygous calls are expected to have an allele ratio of 1, but our measurements generate a lower allele ratio for reasons explained in the method section. As expected for this cell line carrying three times the allele ratio for the X chromosome is 0.5 (arrow pointing to 1:2 ratio of 0.5) and for the autosomes is close to 1. (B) The false negative rate was computed using X chromosome markers in the cell line containing 3X chromosomes, and the false positive rate was calculated using all the autosomes in this sample and the reference set. The effect of selecting different sets of markers based on copy sum RSD is shown. The best markers (10 101 probes) are plotted in blue, all markers unfiltered are plotted in yellow (18 180 probes) and an intermediate cut is shown in pink (14 342 probes). (C) Allele ratio in the X chromosome of NA01416 cell line containing 4X chromosomes. The _X_-axis shows chromosome X position and the _Y_-axis depicts the allele ratio. Markers with an allele ratio around 0 are homozygous. In addition a number of markers have an allele ratio close to 1, and others have an allele ratio of 0.33. The shaded zones depict the regions with the expected allele ratio. (D) Allele ratio in the X chromosome of GM6061 cell line containing 5X chromosomes. The _X_-axis shows chromosome X position and the _Y_-axis depicts the allele ratio. Markers with an allele ratio around 0 are homozygous. In addition a number of markers have an allele ratio close to 0.67, and others have an allele ratio around 0.25. The shaded zones depict the regions with the expected allele ratio.
The origin of cells with polysomy X has been attributed previously to non-disjunction in the two meiotic events in one parent (18,19). Therefore the X chromosomes in the 4× and 5× lines originate from three of the ‘parental’ chromosomes. The allele ratio for a non-homozygous SNP on the X chromosome in a 4× cell line is expected to be either 1 (two copies of each allele) or 0.33 (one copy of one allele and three of the other) depending on which of the three ‘parental’ chromosomes carry the same allele for the SNP. Similarly the allele ratio for a non-homozygous SNP on the X chromosome in a 5× cell line is expected to be either 0.25 (one copy of one allele and four of the other) or 0.67 (two copies of one allele and three of the other). Our measured allele ratio is consistent with these expectations (Figure 4C and D).
Abnormalities in the reference samples
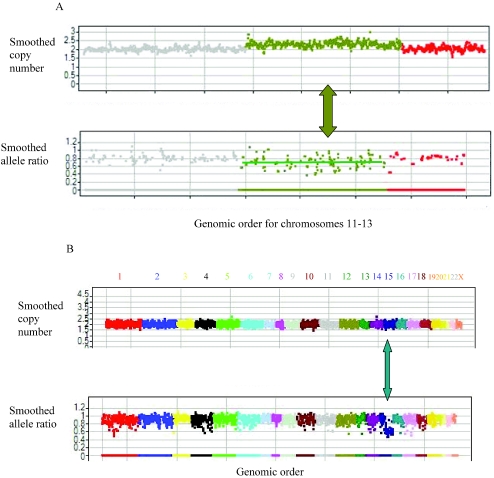
Several ‘mosaic’ abnormalities with less than one copy number change were identified in the reference set. These changes may represent in vitro artifacts during the immortalization and/or growth of the cell line. One of the abnormalities encompassed all of chromosome 12 (Figure 5A). The average allele ratio in chromosome 12 for this sample was 0.7 instead of 0.5 expected from the presence of three copies, consistent with the mosaic nature of the duplication. The mosaic nature of this abnormality was confirmed using Taqman (Table 2). Another ‘mosaic’ abnormality was a deletion smaller than 2 Mb on chromosome 1.
Figure 5.
Mosaic aberrations in reference samples. (A) A genomic copy number and allele ratio view of the reference sample NA19193 carrying a mosaic duplication of chromosome 12. Each chromosome is labeled and coded with a unique color. In both panels the _X_-axis shows the genomic order of the chromosomes 11–13 markers that belong to the best 10 101 marker set. The _Y_-axis uses a moving window of seven markers to show the smoothed copy number (upper panel) and smoothed allele ratio (lower panel). Markers on chromosome 12 have on average a higher copy number and a lower allele ratio than the surrounding chromosomes. This is consistent with a ‘mosaic’ duplication of chromosome 12 in a fraction of the cells. (B) A genomic copy number and allele ratio view of the reference sample NA18573 containing a mosaic LOH in chromosome 15. Each chromosome is labeled and coded with a unique color. In both panels the _X_-axis shows the markers in the genomic order for all chromosomes. The _Y_-axis uses a moving window of seven markers to show the smoothed copy number (upper panel) and smoothed allele ratio (lower panel). The region in chromosome 15 denoted by an arrow have the normal copy number of 2 (upper panel) but an allele ratio of 0.6 (lower panel). This is consistent with an event (e.g. mitotic recombination) leading some of the cells to have LOH with no change in copy number.
Table 2.
Summary of real-time PCR data
| Sample | Chromosome | Position (Mb) | Method | Copy number (real time PCR) | Copy number (MIP) |
|---|---|---|---|---|---|
| NA19193 | 12 | 31.3 | Taqman | 2.8 ± 0.69a | 2.4 |
| NA18573 | 15 | 71.6 | Taqman | 1.86 ± 0.31b | 2 |
| HCC1395 | 2 | 114.3 | SYBR | 0.09 ± 0.006c | 0.06 |
| HCC1395 | 6 | 105.6 | SYBR | 0.12 ± 0.008 | 0.06 |
| HCC1395 | 5 | 107.3 | Taqman | 0.05 ± 0.016 | 0.05 |
| HCC1395 | 13 | 59.2 | Taqman | 0.05 ± 0.012 | 0.02 |
| UACC-812 | 17 | 35.1 | SYBR | 42.3 ± 1.4c | 15.1 |
| UACC-812 | 17 | 12.5 | SYBR | 7.7 ± 0.16 | 4.4 |
| UACC-812 | 17 | 44.2 | SYBR | 8.4 ± 0.032 | 4.7 |
| UACC-812 | 17 | 3.4 | SYBR | 9.4 ± 1.4 | 3.4 |
| UACC-812 | 17 | 24.4 | SYBR | 8.0 ± 0.44c | 5.6 |
Utilizing allele information we have also seen evidence of ‘mosaic’ allele imbalance over a large genomic segment. This is manifested by a normal copy number of 2 but an aberrant allele ratio. Specifically instead of allele ratio ∼1, SNPs in ∼99 Mb on chromosome 2 in the sample NA18855 and ∼35 Mb on chromosome 15 in the sample NA18573 had allele ratio of 0.69 and 0.6, respectively (Figure 5B). This is a probable result of mitotic recombination or other mechanisms leading to LOH in a fraction of the cells. We confirmed the allele ratio abnormality in NA18573 by testing six of the SNPs in the region by an independent methodology, the RFLP. Using data from the six SNPs we obtained an average allele ratio of 0.52 while real time PCR results using Taqman assays were consistent with a copy number of 2 validating our observations (Table 2). In one sample NA12874, all the SNPs in ∼97 Mb on chromosome 1 were homozygous reflecting either true identity by descent for the two homologs or a somatic recombination event.
Abnormalities in the cancer cell lines
Four cancer cell lines as well as a matched normal/cancer cell line pair were studied (Table 1). Several abnormalities were identified including deletions, amplifications and LOH without copy number changes.
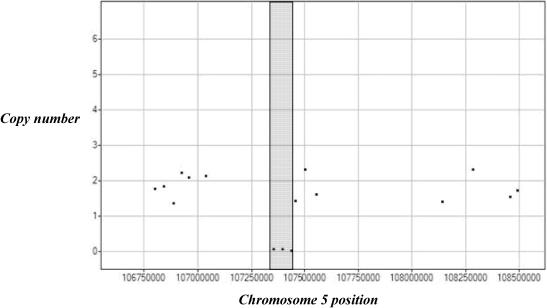
Four homozygous deletions were found in the cell line HCC1395. All were tested and confirmed using real-time PCR (Table 2). A breakpoint of one of these deletions is mapped to ∼20 kb region (Figure 6). The minimum background and cross hybridization in the assay can be seen in the lack of signal from regions with homozygous deletions in contrast to other described technologies (4).
Figure 6.
Detection of a homozygous deletion. The _X_-axis shows the chromosomal position in a region of chromosome 5, and the _Y_-axis shows the copy number in the cell line HCC1395. Three markers (in grey box) showing minimal signal indicate the presence of a homozygous deletion. On one side, the deletion breakpoint is mapped to a 20 kb segment.
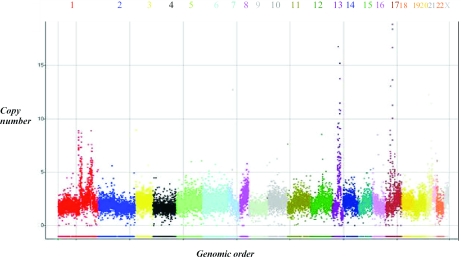
Several amplifications were detected in the cell line UACC812 (Figure 7). This cell line has been assessed previously and sites of amplification to >7 copies reported (10). We detect four amplification sites on chromosome 13; these sites overlap well with the previous report (10). In addition we found several previously unreported amplification sites on chromosome 17. We used real-time PCR to confirm the validity of the chromosome 17 findings (Table 2). In both cases we have underestimated the copy number in these amplifications possibly owing to feature saturation in a manner consistent with other techniques (10). Our copy number estimation of the amplification sites in chromosome 13 was quite similar to that reported using direct hybridization to an oligonucleotide array (10), while our results on chromosome 17 yielded more accurate measurements of copy number.
Figure 7.
Detection of amplifications. This is a genomic copy number view of the cancer cell line UACC812. Each chromosome is labeled and coded with a unique color. The use of the full set of 18 180 markers with valid genotyping data showed the amplification sites with more clarity. The _X_-axis shows the 18 180 markers in their genomic order, and the _Y_-axis shows the copy number. Several amplifications are seen with the most dramatic on chromosomes 13 and 17.
Utilization of allele information
LOH events with no copy number change can be readily detected using polymorphic markers. LOH is sometimes limited to a single chromosomal arm (Figure 8A), or it can include a large fraction of the genome as is observed in the cell line HCC1937 CRL2336 (data not shown).
Figure 8.
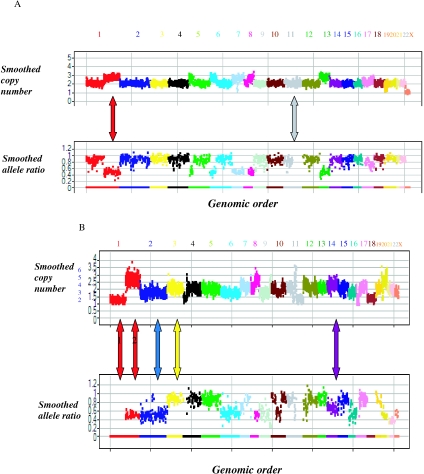
Integrated copy number and allele ratio in cancer cell lines. (A) This is a genomic copy number and allele ratio view of A2058 cell line. Each chromosome is labeled and coded with a unique color. The _X_-axis shows the best 10 101 markers in their genomic order, and the _Y_-axis shows the smoothed copy number (upper panel) and smoothed allele ratio (lower panel). The gray arrow points to a section of chromosome 11 that has undergone LOH (allele ratio of 0) with no copy number change (copy number of 2). The red arrow points to a section of chromosome 1 with an allele ratio of 0.5, consistent with the presence of three copies. Integrated copy number and allele ratio information are consistent with the presence of three copies of sections of chromosomes 5, 6, 7, 8 and 13. (B) This is a genomic copy number and allele ratio view of MDA-MB-175-VII cell line. Each chromosome is labeled and coded with a unique color and its number is noted above. The _X_-axis shows the markers in the genomic order, and the _Y_-axis shows the smoothed copy number (upper panel) and smoothed allele ratio (lower panel). The _Y_-axis shows the copy number automatically generated value assuming a modal chromosome copy number of 2 (black) or by interpretation of copy number and allele ratio (blue). When the modal number of chromosomes in a cell is not 2, interpretation of both copy number and allele ratio is necessary is helpful in determining the absolute number of chromosomal copies. This is an example of such interpretation of this combined data. There are several chromosomal regions with an allele ratio of 0.5 indicating the presence of three or the multiple of three chromosomes. Specifically both the red arrow labeled 2 pointing to a section in chromosome 1 and the blue arrow pointing to chromosome 2 have allele ratio of 0.5. However the corresponding copy numbers are quite different between the two chromosomes. We conclude that the copy number for the section on chromosome 1 and chromosome 2 are six and three copies, respectively. Similarly, chromosomes 6, 9 and the distal part of chromosome 8 have allele ratio of 0.5. Given the copy number differences we conclude that the former two have three copies, while the latter has six copies. Chromosome 3 (yellow) has an allele ratio of ∼1 and a slightly higher copy number than chromosome 2. This is consistent with four chromosome 2 copies—two for each of the two homologs. The same is true for other chromosomes, e.g. chromosomes 6 and 13. Chromosome 14 has a slightly higher copy number than chromosome 13 and has an allele ratio 0.6–0.7. This is consistent with five copies of chromosome 14—three copies of one homolog and two copies of the other. Finally there are regions of LOH as manifested by the proximal segment of chromosome 1. The copy number of this segment is almost half that determined for chromosome 3, and is therefore consistent with carrying two copies of one homolog and zero for the other. With this integrated information about copy number and allele ratio we conclude this cell line has large chromosomal segments with copy number ranging from two to six copies. The blue numbers next to the copy number axis values are those resulting from the above interpretation of the combined copy number and allele ratio views. These conclusions are consistent with previous FISH data that characterized this cell line as having 84 chromosomes and most chromosomes present in three or four copies (25) (http://www.atcc.org).
Except for techniques looking at cells directly, copy number determination is generally made by the relative copy number of a marker to the rest of the genome. With an assumption of a modal chromosome copy number of 2, absolute copy numbers are assigned for all markers. Allele ratio information is helpful in determining the absolute copy number in samples with modal chromosome copy number distinct from 2. Example of the interpretation of allele and copy number information to determine the absolute copy number is shown in Figure 8B for the cell line MDA-MB-175-VII.
FFPE samples utilization
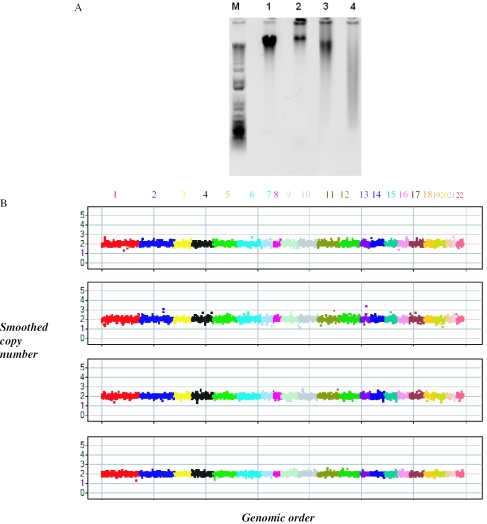
Archival FFPE blocks are a rich source of clinical specimens, but their nucleic acids are often degraded creating a challenge for molecular analysis. The intact stretch of DNA that MIP probes require for proper hybridization is only ∼40 bp, and therefore we hypothesized that MIP may generate good results from these samples. In a proof of principle experiment we assessed the copy number determination of three FFPE samples. We assessed three FFPE samples from different normal tissues with varying degrees of degradation (Figure 9A). As seen in Figure 9B the performance of the samples is very similar to a cell line sample run at the same time.
Figure 9.
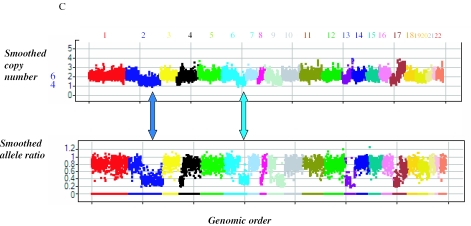
Analysis of FFPE samples. (A) We show an agarose gel picture of DNA purified from a standard blood control sample and three FFPE samples for normal brain, colon and liver. The integrity of DNA in the three samples varies. (B) A genomic copy number view of the three normal FFPE samples shown in (A) and NA12156, a normal cell line control sample. Each of the autosomes is labeled and shown with a unique color. The _X_-axis shows the markers in the genomic order. The _Y_-axis shows the smoothed copy number using a moving window of seven markers. The panels from top to bottom show results of the normal NA12156 and the three FFPE samples from normal brain, colon and liver. The performance of all three FFPE samples is quite similar to the normal control cell line. (C) A genomic copy number view of a FFPE liver tumor sample. Each of the autosomes is labeled and shown with a unique color. In both panels the _X_-axis shows the markers in the genomic order. The _Y_-axis shows the smoothed copy number using a moving window of seven markers (upper panel) and smoothed allele ratio using a moving window of seven markers (lower panel). The blue arrow points to a region of chromosome 2 with an allele ratio of 0.35, consistent with 3:1 ratio between the two alleles indicating the presence of four copies. There are other genomic segments like regions of chromosome 6 (denoted by bright blue/green arrow) that have the same allele ratio and are probable to have four copies of the chromosomes. Most other chromosomes have an allele ratio close to 1 indicating an even number of chromosomes. The copy number of these chromosomes must be higher than 4 as is evident from the copy number data, and it is most probably 6 given the measured difference in copy number with those regions with four copies. The blue numbers next to the copy number axis values are based on the interpretation of both the copy number and allele ratio views.
We then assessed one FFPE tumor/normal pair of samples. The tumor sample showed large-scale aberrations evident by abnormalities in copy number and allele ratio. We discern that most of the chromosomes in this tumor have six copies (Figure 9C). In contrast the normal sample had a similar pattern to other normal FFPE samples (data not shown).
DISCUSSION
Large-scale assessment of clinical material for genomic deletions and duplications imposes several requirements on the technology. Most fundamentally it needs to allow the scalable testing thousands of loci at the same time to cover the entire genome while being able to assess hundreds or thousands of samples at high throughput. Customization and extraction of the allele information as well as ability to study FFPE samples are additional important features in a technology. We have demonstrated these features in this proof of principle application of the highly multiplexed MIP technology to copy number determination.
We have shown the false positive and negative metrics for single marker detection of single copy number changes using MIP. These metrics are favorable when compared with previously published reports (20). We have also shown that we can choose a set of markers with better performance suggesting this can be improved by iteration if desired.
The sensitivity and resolution can be traded off against each other by using information from multiple markers. The use of multiple markers makes it easier to detect copy number changes at the expense of missing smaller changes covering only one marker. For example we have identified in this work large mosaic genomic abnormalities that would not have been detected by single markers. The resolution desired across the genome is not uniform. For example fine resolution in genes that have a higher a priori probability to undergo some form of rearrangement is more important than in a genomic region lacking genes. Being able to interrogate genomic sites of interest at the density of choice is an important advantage of our technique. Using BAC arrays one cannot obtain much greater resolution than 100 kb because of the size of the BAC clones. In addition if a specific BAC does not perform well there is no recourse but to eliminate the 100 kb it covers from the analysis. Oligonucleotide CGH technologies may theoretically be customizable to assess any genomic region with great density. However reduced representation techniques are limited to the study of those represented genomic regions. More importantly, poor hybridization uniformity and cross hybridization greatly limits the number of possible oligonucleotides that have good performance. Processes of in silico and in vitro screening are required to obtain acceptable loci in these cases, limiting the reach and flexibility of these techniques. However MIP has been developed as an efficient method for custom SNP genotyping (15), and is therefore suitable to assess copy number at high density in regions of interest. We believe the quantification performance described in this report can be replicated with other sets of SNPs or non-polymorphic sites because we have applied only limited filtering in building this panel.
We have limited ourselves to the analysis of SNPs even though relaxing this restriction improves the chances of designing better probes for copy number determination because of the dramatic increase of the number of sequences that can be designed. We believe this feature is outweighed by the advantages of obtaining allele information. These include the ability to detect LOH events that are not accompanied by copy number changes as well as the determination of the absolute copy number of a genomic segment in a sample as we have demonstrated. In addition the collection of allele information identifies alleles that are preferentially deleted or duplicated in a set of different samples (21,22). Such identification can allow the definition of the critical gene in a large genomic deletion or duplication. LOH events have been studied previously using high-throughput technologies. However, to our knowledge the assessment of allele ratio and distinguishing, e.g. a 2:1 from 1:1 ratio using high-throughput technologies has not been shown previously.
In addition to being able to detect various types of genomic abnormalities, it is critical to be capable of assessing the variety of available sample types. Most cancer tissue samples are available as FFPE. DNA from these samples is known to be degraded to different degrees. An important feature of our technology is that we use probes that have a genomic footprint of ∼40 bp, in contrast to the reduced representation methods amplifying regions that are several hundred base pairs to >1 kb in size. Therefore we expect our technology to accommodate degraded DNA. Indeed, we presented a proof of principle for the utilization of these samples in the MIP assay. This has not been shown previously for the other oligonucleotide CGH techniques.
To use MIP in large scale for copy number analysis, several tasks need to be accomplished. First, there needs to be extensive assessment of systematic error between experiments done in different days using distinct reagent sets. If no such error exists, reference samples need not be run with each set of test samples studied. More importantly, reduction of the current MIP requirement of 2 µg of DNA is necessary. We have shown the ability to utilize φ29 whole genome amplified DNA for copy number analysis with MIP (data not shown). However because many types of samples are difficult to amplify the ability to use φ29 amplified DNA is not a substitute for being able to assess small amounts of genomic DNA directly.
The ability to interrogate the wide variety of clinical samples to obtain high-resolution allele copy number information in the regions of interest will be important in oncology research. Integrating this data with other genomic information such as somatic point mutation scanning, RNA expression and/or methylation analysis is probable to shed light on the process of tumorgenesis, identify targets for pharmaceutical response and discover biomarkers that predict patients' prognosis and response to medications. In addition the study of copy number in germline DNA may prove useful in a wide variety of other phenotypes as suggested by the presence of many copy number polymorphisms associated with human disease (23,24).
SUPPLEMENTARY DATA
Supplementary Data are available at NAR Online.
Supplementary Material
[Supplementary Material]
Acknowledgments
Funding to pay the Open Access publication charges for this article was provided by ParAllele BioScience.
Conflict of interest statement. Many of the authors are employees of ParAllele BioScience, the licensee of the MIP technology.
REFERENCES
- 1.Pui C.H., Relling M.V., Downing J.R. Acute lymphoblastic leukemia. N. Engl. J. Med. 2004;350:1535–1548. doi: 10.1056/NEJMra023001. [DOI] [PubMed] [Google Scholar]
- 2.Slamon D.J., Leyland-Jones B., Shak S., Fuchs H., Paton V., Bajamonde A., Fleming T., Eiermann W., Wolter J., Pegram M., et al. Use of chemotherapy plus a monoclonal antibody against HER2 for metastatic breast cancer that overexpresses HER2. N. Engl. J. Med. 2001;344:783–792. doi: 10.1056/NEJM200103153441101. [DOI] [PubMed] [Google Scholar]
- 3.Kallioniemi O.P., Kallioniemi A., Sudar D., Rutovitz D., Gray J.W., Waldman F., Pinkel D. Comparative genomic hybridization: a rapid new method for detecting and mapping DNA amplification in tumors. Semin. Cancer Biol. 1993;4:41–46. [PubMed] [Google Scholar]
- 4.Pinkel D., Segraves R., Sudar D., Clark S., Poole I., Kowbel D., Collins C., Kuo W.L., Chen C., Zhai Y., et al. High resolution analysis of DNA copy number variation using comparative genomic hybridization to microarrays. Nature Genet. 1998;20:207–211. doi: 10.1038/2524. [DOI] [PubMed] [Google Scholar]
- 5.Pollack J.R., Perou C.M., Alizadeh A.A., Eisen M.B., Pergamenschikov A., Williams C.F., Jeffrey S.S., Botstein D., Brown P.O. Genome-wide analysis of DNA copy-number changes using cDNA microarrays. Nature Genet. 1999;23:41–46. doi: 10.1038/12640. [DOI] [PubMed] [Google Scholar]
- 6.Wang T.L., Maierhofer C., Speicher M.R., Lengauer C., Vogelstein B., Kinzler K.W., Velculescu V.E. Digital karyotyping. Proc. Natl Acad. Sci. USA. 2002;99:16156–16161. doi: 10.1073/pnas.202610899. [DOI] [PMC free article] [PubMed] [Google Scholar]
- 7.Albertson D.G., Pinkel D. Genomic microarrays in human genetic disease and cancer. Hum. Mol. Genet. 2003;12:R145–R152. doi: 10.1093/hmg/ddg261. [DOI] [PubMed] [Google Scholar]
- 8.Lucito R., Healy J., Alexander J., Reiner A., Esposito D., Chi M., Rodgers L., Brady A., Sebat J., Troge J., et al. Representational oligonucleotide microarray analysis: a high-resolution method to detect genome copy number variation. Genome Res. 2003;13:2291–2305. doi: 10.1101/gr.1349003. [DOI] [PMC free article] [PubMed] [Google Scholar]
- 9.Bignell G.R., Huang J., Greshock J., Watt S., Butler A., West S., Grigorova M., Jones K.W., Wei W., Stratton M.R., et al. High-resolution analysis of DNA copy number using oligonucleotide microarrays. Genome Res. 2004;14:287–295. doi: 10.1101/gr.2012304. [DOI] [PMC free article] [PubMed] [Google Scholar]
- 10.Zhao X., Li C., Paez J.G., Chin K., Janne P.A., Chen T.H., Girard L., Minna J., Christiani D., Leo C., et al. An integrated view of copy number and allelic alterations in the cancer genome using single nucleotide polymorphism arrays. Cancer Res. 2004;64:3060–3071. doi: 10.1158/0008-5472.can-03-3308. [DOI] [PubMed] [Google Scholar]
- 11.Barrett M.T., Scheffer A., Ben-Dor A., Sampas N., Lipson D., Kincaid R., Tsang P., Curry B., Baird K., Meltzer P.S., et al. Comparative genomic hybridization using oligonucleotide microarrays and total genomic DNA. Proc. Natl Acad. Sci. USA. 2004;101:17765–17770. doi: 10.1073/pnas.0407979101. [DOI] [PMC free article] [PubMed] [Google Scholar]
- 12.Ishikawa S., Komura D., Tsuji S., Nishimura K., Yamamoto S., Panda B., Huang J., Fukayama M., Jones K.W., Aburatani H. Allelic dosage analysis with genotyping microarrays. Biochem. Biophys Res. Commun. 2005;333:1309–1314. doi: 10.1016/j.bbrc.2005.06.040. [DOI] [PubMed] [Google Scholar]
- 13.Ishkanian A.S., Malloff C.A., Watson S.K., DeLeeuw R.J., Chi B., Coe B.P., Snijders A., Albertson D.G., Pinkel D., Marra M.A., et al. A tiling resolution DNA microarray with complete coverage of the human genome. Nature Genet. 2004;36:299–303. doi: 10.1038/ng1307. [DOI] [PubMed] [Google Scholar]
- 14.Hardenbol P., Baner J., Jain M., Nilsson M., Namsaraev E.A., Karlin-Neumann G.A., Fakhrai-Rad H., Ronaghi M., Willis T.D., Landegren U., et al. Multiplexed genotyping with sequence-tagged molecular inversion probes. Nat. Biotechnol. 2003;21:673–678. doi: 10.1038/nbt821. [DOI] [PubMed] [Google Scholar]
- 15.Hardenbol P., Yu F., Belmont J., Mackenzie J., Bruckner C., Brundage T., Boudreau A., Chow S., Eberle J., Erbilgin A., et al. Highly multiplexed molecular inversion probe genotyping: over 10,000 targeted SNPs genotyped in a single tube assay. Genome Res. 2005;15:269–275. doi: 10.1101/gr.3185605. [DOI] [PMC free article] [PubMed] [Google Scholar]
- 16.Moorhead M., et al. Optimal genotype determination in highly multiplexed SNP data. Eur. J. Hum. Genet. 2005 doi: 10.1038/sj.ejhg.5201528. in press. [DOI] [PubMed] [Google Scholar]
- 17.The International HapMap Consortium. The International HapMap Project. Nature. 2003;426:789–796. doi: 10.1038/nature02168. [DOI] [PubMed] [Google Scholar]
- 18.Leal C.A., Belmont J.W., Nachtman R., Cantu J.M., Medina C. Parental origin of the extra chromosomes in polysomy X. Hum. Genet. 1994;94:423–426. doi: 10.1007/BF00201605. [DOI] [PubMed] [Google Scholar]
- 19.Celik A., Eraslan S., Gokgoz N., Ilgin H., Basaran S., Bokesoy I., Kayserili H., Yuksel-Apak M., Kirdar B. Identification of the parental origin of polysomy in two 49,XXXXY cases. Clin. Genet. 1997;51:426–429. doi: 10.1111/j.1399-0004.1997.tb02504.x. [DOI] [PubMed] [Google Scholar]
- 20.Huang J., Wei W., Zhang J., Liu G., Bignell G.R., Stratton M.R., Futreal P.A., Wooster R., Jones K.W., Shapero M.H. Whole genome DNA copy number changes identified by high density oligonucleotide arrays. Hum. Genomics. 2004;1:287–299. doi: 10.1186/1479-7364-1-4-287. [DOI] [PMC free article] [PubMed] [Google Scholar]
- 21.Zhuang Z., Park W.S., Pack S., Schmidt L., Vortmeyer A.O., Pak E., Pham T., Weil R.J., Candidus S., Lubensky I.A., et al. Trisomy 7-harbouring non-random duplication of the mutant Met allele in hereditary papillary renal carcinomas. Nature Genet. 1998;20:66–69. doi: 10.1038/1727. [DOI] [PubMed] [Google Scholar]
- 22.Ewart-Toland A., Briassouli P., de Koning J.P., Mao J.H., Yuan J., Chan F., MacCarthy-Morrogh L., Ponder B.A., Nagase H., Burn J., et al. Identification of Stk6/STK15 as a candidate low-penetrance tumor-susceptibility gene in mouse and human. Nature Genet. 2003;34:403–412. doi: 10.1038/ng1220. [DOI] [PubMed] [Google Scholar]
- 23.Sebat J., Lakshmi B., Troge J., Alexander J., Young J., Lundin P., Maner S., Massa H., Walker M., Chi M., et al. Large-scale copy number polymorphism in the human genome. Science. 2004;305:525–528. doi: 10.1126/science.1098918. [DOI] [PubMed] [Google Scholar]
- 24.Iafrate A.J., Feuk L., Rivera M.N., Listewnik M.L., Donahoe P.K., Qi Y., Scherer S.W., Lee C. Detection of large-scale variation in the human genome. Nature Genet. 2004;36:949–951. doi: 10.1038/ng1416. [DOI] [PubMed] [Google Scholar]
- 25.Cailleau R., Olive M., Cruciger Q.V. Long-term human breast carcinoma cell lines of metastatic origin: preliminary characterization. In Vitro. 1978;14:911–915. doi: 10.1007/BF02616120. [DOI] [PubMed] [Google Scholar]
Associated Data
This section collects any data citations, data availability statements, or supplementary materials included in this article.
Supplementary Materials
[Supplementary Material]
