Heterogeneity in synaptic transmission along a Drosophila larval motor axon (original) (raw)
. Author manuscript; available in PMC: 2006 Mar 15.
Published in final edited form as: Nat Neurosci. 2005 Aug 14;8(9):1188–1196. doi: 10.1038/nn1526
Summary
At the Drosophila larval neuromuscular junction (NMJ), a motor neuron releases glutamate from 30-100 boutons onto the muscle it innervates. How transmission strength is distributed among the boutons of the NMJ is unknown. To address this, we created SynapCam, a version of the Ca2+ reporter Cameleon. SynapCam localizes to the postsynapse and selectively reveals Ca2+ influx through glutamate receptors (GluRs) with single-impulse and single-bouton resolution. GluR-based Ca2+ signals were uniform within a given connection (i.e., bouton and postsynapse pair), but differed considerably among connections of an NMJ. A steep gradient of transmission strength was observed along axonal branches, from weak proximal connections to strong distal ones. Presynaptic imaging revealed a matching axonal gradient, with higher Ca2+ influx and exocytosis at distal boutons. The results suggest that transmission strength is mainly determined presynaptically at the level of individual boutons, possibly by one or more factors existing in a gradient.
Keywords: calcium indicator, cameleon, FRET, neuromuscular junction, optical-imaging, spatial gradient, synapse, synapse heterogeneity
Neurons form synaptic connections with one, a few, or hundreds of postsynaptic cells, and an individual neuron may make single or multiple connections with a postsynaptic partner. These connections can change in number, strength, and properties of short and long-term plasticity, both during development and as a consequence of experience in the mature nervous system1-4. Classically, transmission has been measured electrophysiologically, enabling an assessment of the overall strength of transmission between a pair of cells, but without knowledge of the number of connections between them. For simplicity, it has usually been assumed that all connections between two cells share similar properties. With advances in imaging, it has become feasible to selectively measure transmission at individual connections, either by following the presynaptic release of FM dyes during transmitter exocytosis or by monitoring the rise in postsynaptic Ca2+ due to influx via transmitter-gated receptors, voltage-gated Ca2+ channels, or transmitter-triggered release from intracellular stores5-8, and to test whether or not synaptic connections between a presynaptic cell and a postsynaptic partner have equal strength. This question has not yet been extensively addressed, but elegant evidence has been obtained that Ca2+ dynamics, release probability, and short-term plasticity may vary across the different connections from one presynaptic cell8-10. Here we investigate how transmission is distributed among the multiple connections between a presynaptic neuron and its muscle partner in the developing NMJ of the Drosophila larva, a synapse that can be readily accessed for electrophysiology and easily imaged in a semi-intact preparation. The Drosophila larval NMJ shares important structural and molecular properties with mammalian CNS synapses. It is glutamatergic, with non-NMDA-type ionotropic glutamate receptors, and both the presynaptic active zones and postsynaptic specializations are organized through PDZ interactions in similar fashion to mammalian synapses11,12. In addition, as in certain CNS synapses such as hippocampal CA1 inputs13, the NMJ involves multiple neuronal connections onto the postsynaptic muscle. The NMJ also exhibits structural and functional plasticity. During larval development, muscle size increases more than 100-fold, causing a decrease in input resistance. To effectively depolarize and contract the muscle, synaptic currents must also increase as the larva grows. Two general mechanisms upregulate synaptic currents during development: one that regulates presynaptic structure and another that regulates transmission strength. During larval development the degree of axonal branching as well as the number of boutons and active zones increase14,15. Nascent boutons emerge either de novo or by budding from pre-existing boutons, and come equipped with vesicles and active zones16. A muscle-secreted BMP is essential for this developmental growth17 and its presynaptic receptor, Wishful thinking (Wit)18,19, has been implicated both in the structural growth of the NMJ as well as in the retrograde signaling that strengthens synaptic transmission20. It is not known how synaptic strength is distributed at this multisynaptic connection or how the mechanisms that regulate its growth and transmission may help to establish and maintain this distribution.
To clarify this, we compared transmission from different connections of an individual neuron in the Drosophila NMJ using a novel optical approach. A genetically-encoded fluorescent Ca2+ reporter was used to detect postsynaptic Ca2+ flux through GluRs, which in Drosophila are permeable to Ca2+ 21. Versions of the fluorescence resonance energy transfer (FRET)-based reporter Cameleon22,23 were targeted to postsynaptic sites via fusion to the single-pass transmembrane domain of CD8, as well as to the C-terminal PDZ-interaction domain of the Shaker K+ channel16. These genetic chimeras (SynapCams) were localized to the muscle's subsynaptic reticulum (SSR, i.e., postsynaptic membrane folds that envelop presynaptic boutons), through the interaction of the Shaker C-terminus with the PDZ protein Discs large (Dlg)11,12. This targeting, combined with the lower Ca2+ affinity of a mutated version of the fluorescent reporter, allowed simultaneous monitoring of synaptic transmission across a population of connections in response to single action potentials. We found that transmission strength varies among connections in a gradient along the length of axonal branches, with distal connections making stronger functional associations. We consider mechanisms that may be responsible for generating this gradient.
Results
SynapCam design: A postsynaptically targeted cameleon
Synaptic activity at the Drosophila larval NMJ was measured electrically, using voltage clamp, and optically, with genetically encoded Ca2+ sensors whose expression was driven in muscles by the myosin heavy chain promoter (MHC)24. Various versions of the FRET-based Ca2+ sensor Cameleon22,23 were used to construct reporters, which we called SynapCams, that were targeted to the postsynaptic cell membrane. The reporters were doubly addressed to the muscle plasma membrane by the heterologous transmembrane protein CD8, and to the SSR by the PDZ-interaction domain of the Shaker C-terminus (Fig. 1a), as done previously by Zito et. al. (1999) for the targeting of a GFP. The attachment of CD8 was necessary for efficient targeting. Fusion to the Shaker C-terminus without CD8 produced weaker accumulation at postsynaptic sites (data not shown). SynapCams, however, were mostly localized at postsynaptic sites that surround presynaptic boutons (i.e., postsynapses), with lower levels in the non-synaptic muscle membrane (see Fig. 1b). These reporters thus permitted vital imaging of the subsynaptic structure. Muscle 6, the muscle used in these experiments, is innervated by type Ib boutons (3-8 μm) from motor neuron RP3, and type Is boutons from motor neuron MN 6/7b (1-3 μm)15,25. SynapCam fluorescence was greater at type Ib postsynapses, presumably because these are enveloped with more extensive SSR14,16,26. We thus focused our analysison type Ib postsynapses.
Figure 1.
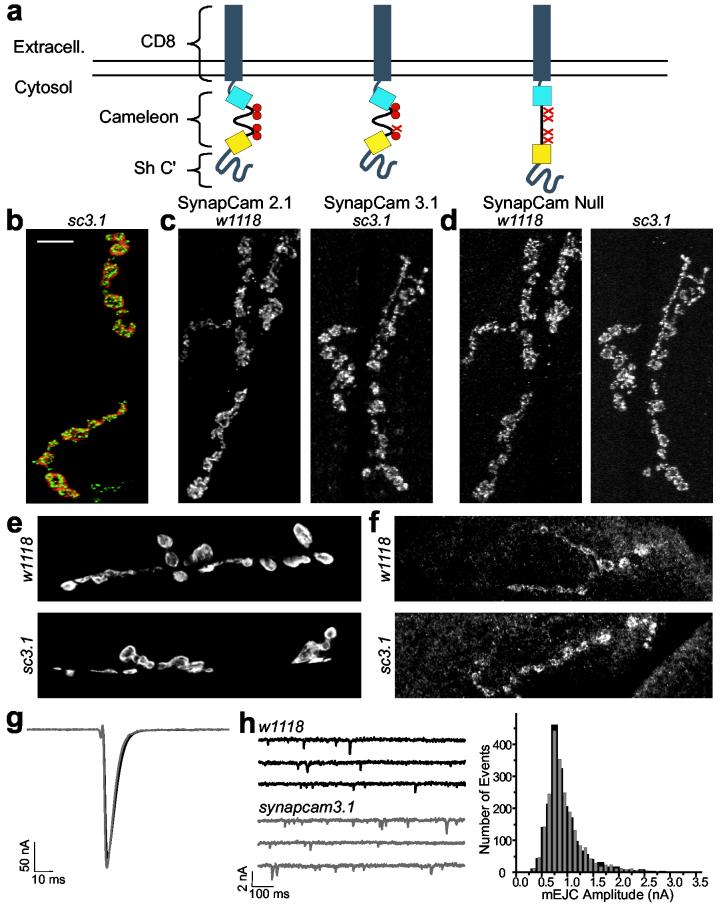
SynapCam expression does no affect on NMJ development or physiology. (a) SynapCams are cameleons with CD8 at the N-terminal and the PDZ-interaction domain of the Shaker K+ channel at the C-terminal. Three versions of cameleon, differing in their sensitivity to Ca2+ ions (red circles), were used: SynapCam2.1, with all four Ca2+ binding sites intact; SynapCam3.1, with one site mutated to reduce Ca2+ affinity, and SynapCamNull, with all four sites mutated to serve as a Ca2+-insensitive control. (b) When expressed under the control of the MHC promoter, SynapCam3.1 (red, YFP fluorescence) localized to muscle sites underlying presynaptic terminals of type Ib boutons (shown in green, stained with anti-Nc82, an active zone marker). (c-e) Flies expressing SynapCam3.1 (sc3.1) showed no observable differences in the levels or localization of pre- or postsynaptic markers when compared to control larvae (w1118). (c) Glutamate receptor subunits DGluRIIA or (d) DGluRIIB, (e) Dlg, or (f) Syt, were not perturbed by expression of SynapCam3.1. All images are muscles 6/7, except for anti-Syt which are muscle 8. Scale bar 10 μm. (g-h) Physiological parameters were also unaffected. Neither EJCs (g, n = 10 NMJs), nor the amplitude distribution of spontaneous miniature quantal events (mEJCs, h) were affected by expression of SynapCam3.1 or the experimental conditions (2 μM thapsigargin and 500 μM ryanodine) that prevented muscle contraction. The histogram in (h) is from six NMJs and 1953 events for w1118 (black) and nine NMJs and 2191 events from synapcam3.1 (gray). The holding potential for (g) and (h) was -80mV.
Expression of SynapCams did not affect muscle viability, nor did it affect NMJ morphology. In addition, the localization of synaptic proteins, such as GluRs, Dlg, or synaptotagmin (Syt) (Fig. 1c-f), as well as physiological parameters such as the resting membrane potential and the amplitudes of spontaneous and evoked junctional potentials (EJPs) and currents (EJCs) in synapcCam larvae were indistinguishable from wild-type (Fig. 1g-h and Supplemental Table 1). Thus, expression of SynapCams did not interfere with synaptic transmission, or perturb the development of the NMJ.
SynapCam reports on glutamate neurotransmission
Cameleon is a ratiometric reporter based on FRET22. When the calmodulin domain of cameleon binds Ca2+, the protein undergoes a conformational change that increases the efficiency of FRET between the CFP and YFP fluorophores, producing a decrease in CFP and an increase in YFP emission. Single stimulation of the motor axon resulted in reciprocal changes in the CFP and YFP intensities of postsynaptic areas expressing SynapCam (Fig. 2a,b) indicating an increase in FRET efficiency. Non-synaptic muscle regions of synapcam larvae (Fig. 2a,b), and muscle fibers expressing cytosolic Cam2.1, or CD8-Cam2.1 showed minimal or no fluorescence changes in response to axon stimulation (data not shown).
Figure 2.
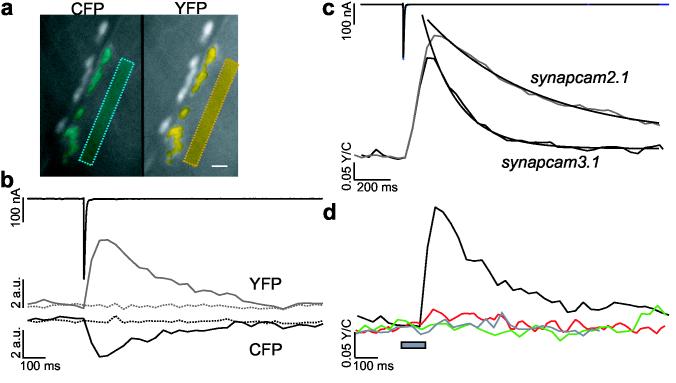
SynapCams report Ca 2+ flux through GluRs as an increase in FRET. (a) An NMJ at muscle 6 during nerve stimulation. Synaptic and non-synaptic (boxes) areas expressing SynapCam3.1 were selected for analysis (in blue for CFP and yellow for YFP). Scale bar 10 μm. (b) The total fluorescence of synaptic regions showed reciprocal CFP (lower black) and YFP (gray) intensity changes following stimulation of the motor axon (EJC, upper black trace). Non-synaptic areas (dashed lines) did not show fluorescent changes. Fluorescence levels for non-synaptic areas were adjusted to synaptic levels for display purposes. (c) Fluorescence changes were indicative of an increase in FRET between CFP and YFP upon synaptic transmission. Single stimuli to the motor axon evoked large FRET (YFP/CFP) changes measured from the entire synaptic area for both synapcam3.1 (lower black trace, 16 NMJs) and synapcam2.1 (gray, 13 NMJs). The synapcam2.1 ΔFRET was on average 18% greater than the synapcam3.1 response. FRET changes had a rapid onset (peak intensity reached after < 200 ms) and a gradual offset, which was fit with a first-order exponential, with SynapCam2.1 exhibiting a slower decay lasting up to 2 s. (d) FRET increases (black, single response for the synapse in a) were induced by Ca2+ transients, dependent on GluR activity and SynapCams did not report voltage-dependent Ca2+ influx. The Ca2+-insensitive SynapCamNull exhibited no change in FRET (green, six NMJs). FRET changes were abolished upon application of desensitizing concentrations of glutamate (1.5mM) (red, three NMJs). A voltage step from−80 to 0 mV (gray bar) did not elicit a change in FRET (gray trace, three NMJs).
The optical responses of different SynapCam constructs were compared. While synapcam2.1 retained all four Ca2+ binding sites of calmodulin, synapcam3.1 encoded a mutation (E104Q) that abolished one binding site in the N-terminal lobe22. Both reporters displayed significant changes in FRET (ΔFRET) at postsynaptic regions (Fig. 2c). ΔFRET began increasing ∼ 20 ms after the postsynaptic current, and reached the peak ratio within 120 ms for synapcam3.1, and within 200 ms for synapcam2.1. The mean peak response for synapcam2.1 was greater than that for synapcam3.1 (18.18%, 0.385 ± 0.138 and 0.315 ± 0.120, respectively) and the decay of the response was slower (τ = 192.63 ms ± 5.95 and ?= 599.65 ± 11.04, respectively). These results were consistent with the greater Ca2+ affinity of Cameleon2.122,23. Because the rise phases overlapped for SynapCam2.1 and 3.1, the earlier peaking of SynapCam3.1 is likely attributable to a faster recovery rate. Rapid kinetics and a lower Ca2+affinity made SynapCam3.1 a more attractive reporter for subsequent experiments.
Although results strongly suggested that SynapCams functioned in Drosophila muscle as synaptic Ca2+ sensors, it remained possible that the GFP variants were in part responding to changes in pH or halides. Synapses expressing SynapCamNull, a reporter with all four Ca2+ binding sites abolished by mutation (Fig. 1a), showed no fluorescence change in response to neurotransmission (Fig. 2d, green trace). This result demonstrated ΔFRET was indeed reporting an increase in postsynaptic Ca2+ resulting from neurotransmission.
To focus exclusively on Ca2+ influx via GluRs, Ca2+ from internal stores was depleted with thapsigargin27 while residual Ca2+ efflux from the stores was blocked with ryanodine28. In addition, the interrogated muscle was voltage-clamped to prevent activation of voltage-gated Ca2+ channels. Under these conditions desensitization of GluRs by bath-applied glutamate abolished both the FRET response and the EJC (current 94 ± 5%, fluorescence 88 ± 9% decrease, 3 NMJs, 3 traces each) (Fig. 2d, red trace), demonstrating that GluR-derived currents were necessary for the optical response of SynapCam. Depolarizing voltage jumps designed to open voltage-gated Ca2+ channels in fact did not induce a ΔFRET (Fig. 2d, gray trace), indicating that voltage-gated Ca2+ channels did not contribute detectable synaptic Ca2+ under our recording conditions. Thus, SynapCams provided a selective optical report of postsynaptic currents generated entirely from activated GluRs.
Heterogeneous transmission among connections of the NMJ
To assess the contribution of individual connections to overall transmission at the NMJ, discrete postsynaptic areas under presynaptic boutons were individually analyzed (Fig. 3a). Each postsynapse measured (801 in 65 NMJs from 62 larvae) showed a ΔFRET in response to axon stimulation (i.e., no silent connections were observed, consistent with previous results from focal electrophysiological recordings29). However, postsynapse ΔFRETs sometimes fluctuated in amplitude during repetitive presynaptic stimulation (Fig. 3b). These fluctuations were independent of fluctuations occurring at other postsynapses, including close neighbors (Fig. 3b, compare green postsynapse vs. blue postsynapse). Similarly, there was no pairwise correlation between the ΔFRET response of a postsynapse and the distance separating to another (Fig. 3c). These observations indicated that Ca2+ influx at one postsynapse did not activate sensor readout at a nearby postsynapse, thus providing single postsynapse (i.e. single-bouton) resolution.
Figure 3.
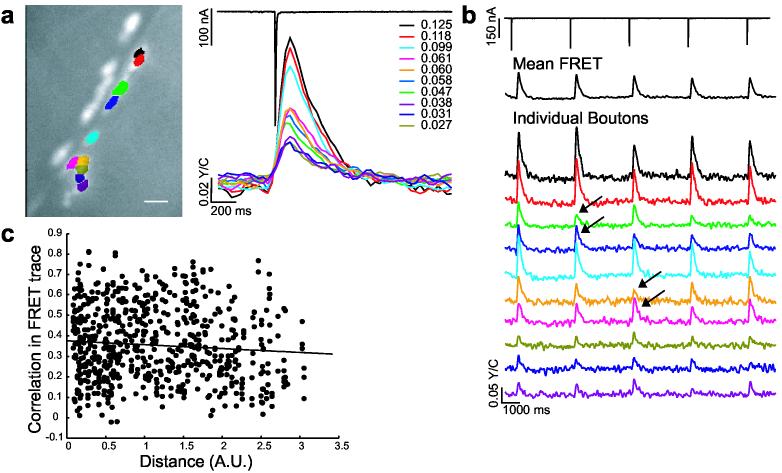
SynapCam reveals transmission heterogeneity at the Drosophila NMJ. (a) Muscle sites postsynaptic to individual boutons were analyzed for Ca2+-dependent FRET changes in response to a single motor axon stimulus. Each color represents a different postsynaptic region highlighted in the CCD image. The FRET trace is displayed to the right in corresponding color as well as the ΔFRET values for each region. A 4.6-fold difference of ΔFRET magnitudes was observed for the NMJ displayed, with a mean difference of 5.3-fold for all experiments. Scale bar 10 μm. (b) In addition to a small decrease in ΔFRET as a result of depression, small fluctuations (arrows) in the magnitude of ΔFRET were observed within single postsynapses upon repeated stimulation (0.25 Hz). These fluctuations however were not observed in the average response for the entire postysnapse (mean FRET trace, black). Fluctuations in ΔFRET were independent of the performance of other postsynapses despite physical proximity. For example at two pairs of postsynapses (green and blue, or pink and yellow), FRET changes showed different fluctuation behavior, regardless of proximity. Therefore, the ΔFRET for a single postsynapse is not influenced by FRET changes at other postsynapses. (c) Comparison of FRET response for postsynapse pairs against the distance between pairs shows no correlation (156 trials, 61 boutons, six NMJs, r = 0.009). Distance is the pythagorean distance between postsynapses centers. The correlation between the FRET traces of a pair of postsynapses was calculated from the FRET time-course vectors in Matlab 7.0 (Mathworks, Natick MA) using the “corrcoef” function.
The magnitude of ΔFRET differed considerably among postsynapses of a single axon (Fig. 3a,b). From 65 NMJs tested, the amplitudes differed 2- to 14-fold among postsynapses of the same NMJ. This observed heterogeneity in ΔFRET might stem from biological variation, such as presynaptic differences in transmitter release or differences in postsynaptic sensitivity. Alternatively, it could arise from differences between postsynapses in SynapCam numbers or readout. However, there was no correlation between relative reporter quantity and ΔFRET (Fig. 4b) and moreover, ΔFRET responses peaked sharply, arguing against saturation of SynapCam (Fig. 3). This possibility was tested directly by comparing the ΔFRET response after a single stimulus against the response to a pair of stimuli given in rapid succession. If small FRET changes were due to saturated postsynapses, stimulus pairs would not be expected to increase the FRET response.
Figure 4.
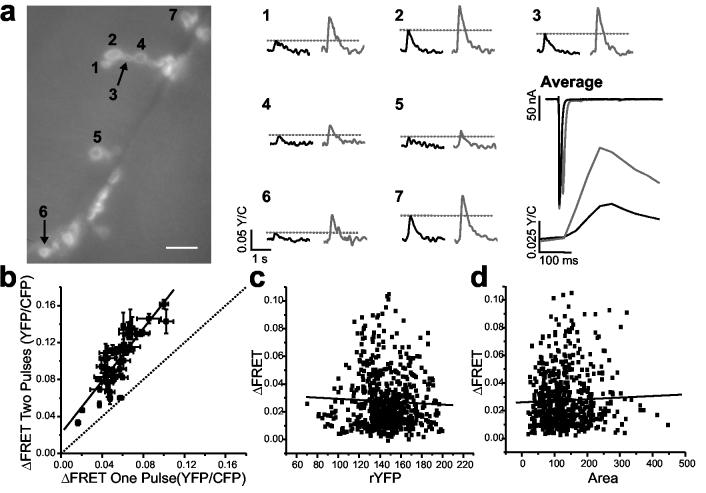
SynapCam3.1 is not saturated by single stimuli to the motor axon. NMJs like the one shown in (a) were subjected to trials of single stimulation (FRET responses are black traces) and trials where two stimuli were separated by 10 ms (gray traces). Although currents were depressed following the second pulse, the magnitude of ΔFRET was higher for dual stimulation recordings in all boutons imaged as a result of Ca2+ summation in the SynapCam response. Scale bar 10 μm. (b) This increase was observed in all boutons of five NMJs tested. When compared to the response after a single pulse, the pooled responses for two stimuli exhibited on average an 83.1 ± 5.3% increase, and the responses were fit by linear regression (r = 0.897, P < 0.0001), indicating a lack of saturation, even for boutons that responded strongly to a single stimulus. ΔFRET numbers in (b) are the mean ± s.e.m. of three single stimulation and three double stimulation trials for each NMJ. (c) No correlation was found between the level of reporter expression, as assayed by the average resting levels of sensitized YFP (rYFP), and the FRET response of the postsynapse (red line is linear fit, r = −0.047, P = 0.25). (d) No correlation was observed between the size of a bouton and the FRET response (red line is linear fit, r = 0.032, P = 0.33). For (c) and (d), n = 625 boutons, and 45 NMJs.
Stimuli were separated by 10 ms and produced two separate EJCs. Although the current amplitude of the second pulse was depressed by approximately 28% (first pulse −363.8 ± 18.5 nA, second pulse −261.9 ± 8.4 nA), as expected for the Ca2+ concentration used, the stimulus pair produced ΔFRET amplitudes larger than a single stimulus owing to summation of the SynapCam responses (Fig. 4a). Taken together, 41 boutons from five NMJs exhibited linear increases in the FRET response to the stimulus pair as compared to the single stimulus (Fig. 4b) indicating that for single pulses at low frequency, as used throughout our analysis, the reporter is not saturated at any boutons along the axon, whether they are proximal or distal or their responses large or small. The ratio of ΔFRET from a pulse pair relative to the response for single pulse (mean of 1.84 +/− 0.05) showed a slight negative dependence to the ΔFRET after a single stimulus (Supplementary Fig. 1). This dependence could be due to presynaptic depression as the EJC exhibited a similar trend (Supplementary Fig. 1). Taken together, the results indicated that heterogeneity in ΔFRET stems from biological variation in neurotransmission.
Active zone or GluR numbers do not determine heterogeneity
Because SynapCam responds to Ca2+ influx through GluRs, the inhomogeneity in synaptic transmission might arise from differences among the postsynaptic sites in the number of GluRs. Alternatively, Ca2+ influx might also be affected by GluR subunit composition. Five GluRs are expressed in the muscles of Drosophila larvae30-32. DGluRIIA and DGluRIIB compete with each other for assembly with the other subunits and for membrane expression31,32. In addition, DGluRIIB desensitizes more rapidly than DGluRIIA, leading to reduced macroscopic currents in muscles over-expressing DGluRIIB33. Differences between postsynapses in the number of DGluRIIB versus DGluRIIA might thus impact Ca2+ influx. To test these possibilities, NMJs were fixed immediately after imaging SynapCam and stained with antibodies against DGluRIIA and DGluRIIB. The amplitude of the ΔFRET signals showed very weak or no correlation to DGluRIIA, or DGluRIIB staining or to the ratio of DGluRIIA to DGluRIIB (Supplementary Fig. 2). On average, postynapses that differed by no more than 50% in GluRs could differ in ΔFRET amplitude by as much as 1000% (Supplementary Fig. 2). Thus, inhomogeneity in SynapCam responses among postsynapses of an NMJ could not be attributed to differences in the number or composition of GluRs.
Transmission heterogeneity might also stem from presynaptic differences among boutons. Type Ib boutons contain multiple active zones14, and larger boutons tend to contain more active zones. We tested if differences in the number of active zones accounted for the observed transmission inhomogeneity. There was no correlation between the amplitude of ΔFRET response and the size of the presynaptic bouton (Fig. 4d). Moreover, immuno-staining with the antibody Nc82, which stains presynaptic active zones opposite postsynaptic patches of GluRs34 (Fig. 1b), revealed that neither the immuno-fluorescence intensity, nor the density of Nc82 puncta per bouton correlated with the ΔFRET from individual boutons (Supplementary Fig. 3).
A gradient of transmission strength along axonal branches
To describe the spatial distribution of synaptic transmission across the connections of the motor axon, continuous imaging (Figs. 2-4) was replaced by episodic imaging (Fig. 5a and Methods) to minimize photobleaching and allow the acquisition of data for hundreds of events. FRET images of the synaptic region (Fig. 5b), averaged from responses to 50-300 stimuli, provided high signal-to-noise ΔFRET measurements from type Ib boutons, and also enabled optical detection of transmission from Type Is boutons (Fig. 5e). However, because the type Is boutons were more difficult to identify in the YFP images we did not pursue them at this stage.
Figure 5.
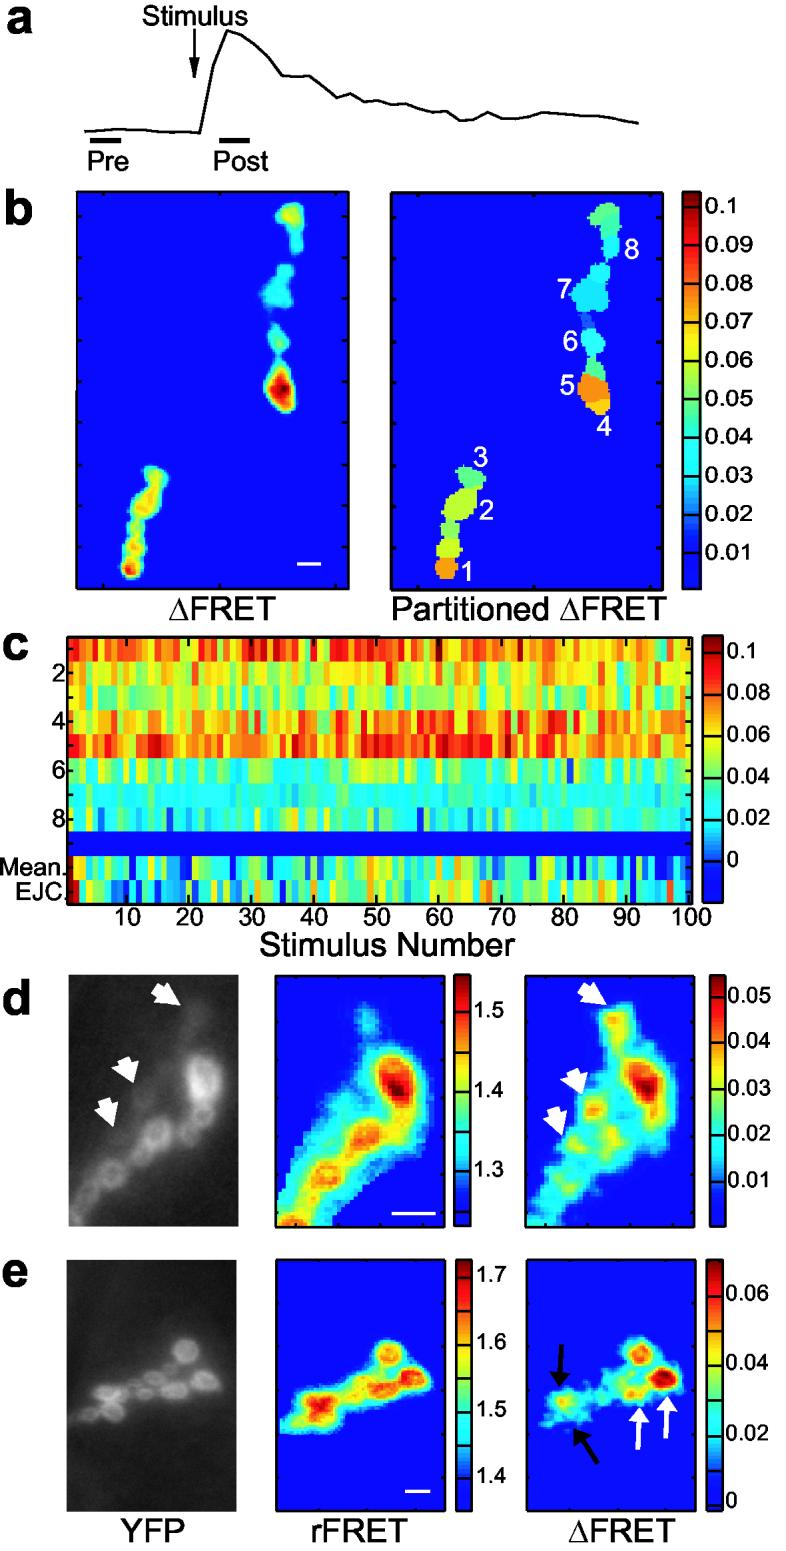
Prolonged imaging reveals the distribution of transmission strength of an NMJ. (a) Imaging conditions were optimized to allow extended imaging of the NMJ. One frame was acquired 200 ms before, and another 100 ms after, nerve stimulation (0.125 Hz), each of 50 ms exposure. The protocol was repeated for at least 30 trials, but more typically for 100-200 trials. (b) Image analysis produced mean ΔFRET scans of the entire synaptic region (left), and scans where the NMJ was partitioned into postsynaptic regions of interest with mean ΔFRET values for each postsynapse (right). (c) Array of 100 ΔFRET responses for the eight postsynapses numbered in (b). The Y-axis reflects postsynapse identity. The last two rows (separated by a blue bar) are mean ΔFRET for all postsynapses and EJC responses for each stimulus. (d-e) YFP, mean rFRET, and mean ΔFRET images of two different. (d) FRET changes were sometimes observed for type Is postsynapses (short arrows), even though reporter localization at these sites was low (see YFP image). (e) Adjacent postsynapses of similar YFP and rFRET values frequently produced different FRET changes (two examples, black and white arrows) indicating that the mean ΔFRET of a postsynapse was not determined by reporter expression or rFRET values. The scale bar for all images is 8 μm.
Pronounced differences were observed in the potency of postsynapses. Although there was some variation between individual stimuli, strong postsynapses tended to stay strong throughout the trial (Fig. 5c). We never observed a drastic change in the transmission distribution across postsynapses. FRET images from type Ib boutons revealed that adjacent postsynapses of similar size, reporter expression, and resting FRET (rFRET) could differ markedly in transmission strength (Fig. 5e), confirming results from single stimulation that suggest Ca2+ entry is confined to the physical limits of a postsynapse and that reporter expression or rFRET did not determine a postsynapse's ΔFRET.
Our analysis of 440 postsynapses from 91 axonal branches revealed that strong and weak synaptic connections were not randomly distributed throughout the motor axon, but rather were organized in a gradient along the length of axonal branches (Fig. 6). HRP-staining subsequent to imaging traced the axon branches from the first point of muscle contact, to secondary branch points, to terminal boutons (Fig. 6a). Postsynapses at the ends of branches consistently exhibited the greatest ΔFRET responses (Fig. 6c,d,f-i) while postsynapses at the origins of branches were always among the weakest. The ΔFRET gradient was not due to differences in the amount of SynapCam since rFRET (Fig. 6b) did not show consistent trends in intensity along a branch (Fig. 6e and j). ΔFRET decreased linearly with greater distance from the end of a branch and with the connection position along an axonal branch (Fig. 6j,k). This distal to proximal gradient of transmission strength, from strong distal connections to weak proximal ones, was observed in both simple and complex branching patterns (Fig. 6h). Terminal postsynapses from different branches within the same NMJ also differed significantly in terms of transmission potency (Fig. 6i). The gradient in transmission strength was not dependent upon the relative location of the axon branch along the muscle surface. Transmission at terminal connections was always stronger regardless of location along the length of the muscle fiber. Moreover, the gradient was also independent on branch orientation, whether the branch ran parallel, perpendicularly to, or obliquely across the muscle fiber (Fig. 6h,i). These observations suggested that the gradient in transmission strength was not a function of postsynaptic polarity, but instead depended solely on the location of a bouton relative to the axon branch.
Figure 6.
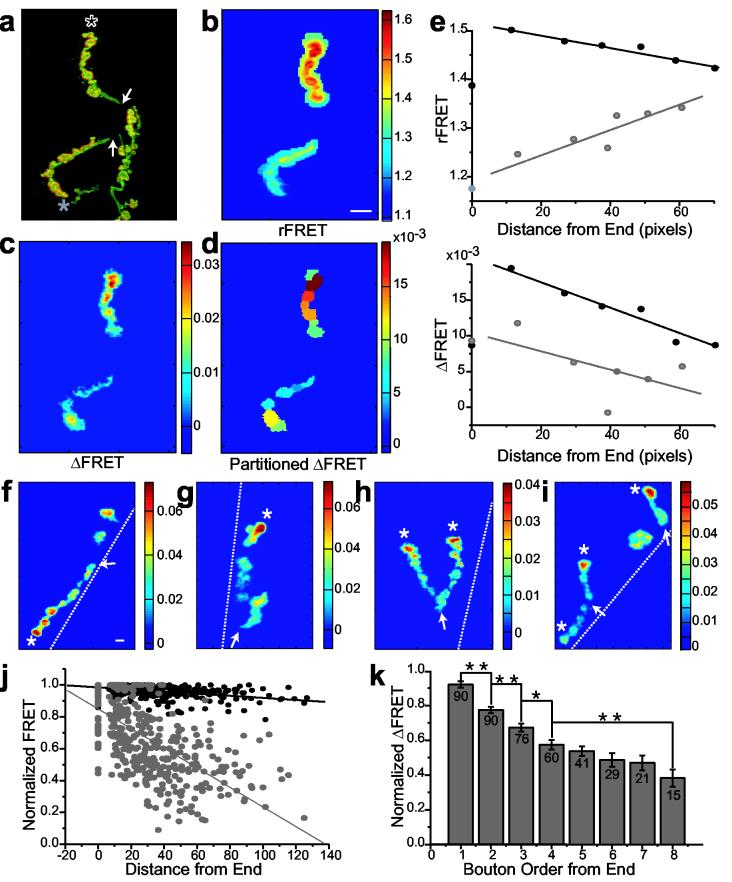
A proximal-distal gradient in transmission strength (a) HRP staining (green), overlayed on a SynapCam3.1 YFP image (red), confirms the origin and termini of two branches (marked with asterisks). Mean rFRET (b), mean ΔFRET (c), and ΔFRET partitioned and averaged within each synapse (d) for the NMJ in (a). (e) Scatter plots of the mean rFRET (top), or ΔFRET (bottom) of each postsynapse against its distance from the end of a branch for the NMJ depicted in (a-d). Color corresponds to asterisks in (a), lines are fits to depict trend. (f-i) Additional examples of the transmission strength gradient along the length of axonal branches. Branch ends are marked with asterisks, branch origins are marked with arrows, and muscle border is depicted by a dashed white line. Color bars represent rFRET for (b) and ΔFRET for all other images. Scale bar for all images is 8 μm. (j) Pooled data of all postsynapses' ΔFRET (gray) and rFRET (black) values against the distance from the branch's end show a stronger correlation for ΔFRET values. Linear fits, ΔFRET r = −0.649, P < 0.0001, rFRET r = −0.461, P < 0.0001. (k) Postsynapses at the branch end (first column) give on average greater ΔFRET than the postsynapses that follow them. Numbers are number of postsynapses averaged, mean ± s.e.m., ** P < 0.001, * P < 0.005 independent t-test. For (j) and (k), FRET values were normalized to the highest value within each branch for n = 440 postsynapses, 90 branches, 34 NMJs.
Two exceptions were found which disrupted the commonly seen gradient of transmission strength. One of these was at boutons that were budding-off from established boutons. Budding boutons at the terminus of a branch had lower transmission strength than mature boutons from which they budded (Fig. 6d, lower green bouton budding from yellow bouton). A second exception occurred when an axon branch had a sharp kink. Boutons located on the proximal side of the bend had higher ΔFRET values than boutons following it, as if they were terminal boutons (Fig. 6g). The dependence of transmission strength on fine axon morphology supported the idea that the gradient is established presynaptically.
Presynaptic release is stronger at end boutons
We have documented a gradient in synaptic transmission that makes the connections of distal boutons stronger than proximal ones along the length of the motor axon. These measurements were made postsynaptically, but the lack of correlation to GluR levels, and the dependence on axon morphology suggested that the locus of the gradient was presynaptic. To test this idea, presynaptic fluorescent reporters were used to measure Ca2+ influx and synaptic vesicle fusion at each bouton. Presynaptic Ca2+ was monitored with a version of cameleon, Cam2.335, expressed pan-neuronally. Motor axons were subjected to 40 Hz trains of stimuli, a frequency that in this preparation does not saturate the reporter36. Larger rises in Ca2+ were observed at distal boutons than at boutons 2-3 positions from the end (Fig. 7a-b), indicating greater Ca2+ influx and suggesting greater transmitter release at the ends of axons. This finding led us to assay vesicle release directly. This was done in flies expressing superecliptic Synapto-pHluorin (SpH), a GFP-based sensor that reports vesicle fusion by exploiting differences in pH between the intravesicular and extracellular space37. A greater activity-dependent increase in fluorescence, indicating greater exocytosis, was observed at distal boutons than at boutons 2-3 positions from the end (Fig. 7c). This provided direct evidence for greater release from distal boutons. Thus transmission at the Drosophila NMJ appeared to be greater at the ends of axonal branches and this gradient seems to bein part due to greater Ca2+ influx and vesicle fusion presynaptically.
Figure 7.

Presynaptic contribution to the gradient of transmission strength (a) Axons expressing cytoplasmic Cam2.3 were subjected to 2.2 s of 40 Hz stimuli (dashed lines in b and c). Before stimulation no axonal gradient was detected either in the amount of Cam2.3 at the synapse (rYFP) or the resting FRET (rFRET). However, during stimulation, boutons at the ends of axonal branches exhibited higher ΔFRET responses than more proximal boutons. (b) Average ΔFRET traces show higher presynaptic Ca2+ increase for end boutons than for ones 2-3 boutons away (ΔFRET/FRET = 18.95 ± 0.88 distal, 15.69 ± 0.73 proximal, P <0.005 independent t-test). Data from 19 distal and 32 proximal boutons from19 axonal branches of 7 NMJs. (c) Vesicle fusion was examined in animals expressing SpH and mDsRed (to aid in visualization of the axonal arbor) presynaptically. Distal boutons showed bigger fluorescent changes upon 40 Hz stimulation indicative of higher exocytosis (ΔF/F = 17.97 ± 1.49 distal, 13.20 ± 0.91 proximal, P <0.005 independent t-test). Data from 52 axonal branches in 14 NMJs, including 52 distal and 67 proximal boutons.
Discussion
By targeting a genetically-encoded Ca2+ sensor to postsynaptic sites, near Ca2+-permeant GluRs, we have monitored glutamatergic transmission optically with single-bouton resolution at the Drosophila larval NMJ. While highly responsive to Ca2+ influx through GluRs, the sensor is relatively blind to influx via voltage-gated Ca2+ channels (Fig. 2) and in response to a presynaptic action potential, the ΔFRET at one postsynapse is independent of ΔFRET at an adjacent postsynapse (Fig. 3 and 5). As a result SynapCam enables the simultaneous examination of transmission at multiple synaptic connections in response to single presynaptic action potentials. This approach is promising, in that similar targeting of low-affinity optical Ca2+ sensors to specific Ca2+ channels, such as NMDA and IP3 receptors, or voltage-gated Ca2+ channels in mammalian neurons could enable visualization in dendrites of the spatial spread of the Ca2+ fluctuations that trigger long-lasting changes in synaptic strength.
Although all connections at the Drosophila NMJ participated in neurotransmission, the strength of transmission was found to vary greatly from bouton to bouton. The position of a particular synaptic connection with respect to the origin of a branch or sub-branch determined its transmission potency. Distal boutons were the strongest, with a progressive decline in transmission strength in boutons nearer to the origin of the axon branch (Fig. 6). Although this type of organized transmission heterogeneity has never before been documented for the Drosophila NMJ, transmission gradients have been observed before at the crayfish, frog, and mouse NMJs38-41. These studies used serial single-bouton or single-muscle fiber recordings to compare proximal and distal connections. The targeting of a Ca2+ fluorescent reporter to postsynaptic sites made it possible for us to capture the same kind of information in parallel in single snapshots. In those earlier NMJ studies, differences in release probability, the size of SSR folds, or failure of action potential propagation were proposed to explain the gradients42,43. Action potential propagation failure cannot explain our observation of stronger transmission at distal connections in Drosophila larvae. In addition, we do not observe a gradient in either postsynapse size or quantity of SynapCam along the synaptic connections made by an axon (Fig. 4), arguing against systematic differences in the SSR. Finally, the quantity of GluRs and the molecular identity of the GluR subunits at a postsynapse were not organized in a gradient (Supplementary Fig. 2). It should be mentioned that in addition to receptor quantity and subunit composition, the phosphorylation state of GluRs has been shown to affect quantal size at the NMJ44. Although we did not investigate the phosphorylation state of the GluRs at each bouton, the effect of phosphorylation on GluRs cannot quantitatively account for the gradient observed. At most phosphorylation decreases quantal size by 60%44. This cannot account for the 1000% differences that we observe. In summary, we have not found a strong postsynaptic correlate for the establishment of a transmission gradient. We did however find increased presynaptic Ca2+ and vesicle fusion at distal boutons (Fig. 7) indicating that a presynaptic mechanism that controls transmitter release plays a major role in the establishment of the transmission gradient. Although release probability was not measured directly in this study, the number of active zones was not organized in a spatial gradient along the boutons of an NMJ (Supplementary Fig. 3). Still, it appears from earlier work at the Drosophila and Crayfish NMJs that more efficient transmitter release occurs at active zones that are associated with electron dense specializations known as “T-bars” 20,42,45,46. Hence, it is conceivable that more distal boutons have larger numbers of T-bars. Alternatively, differences in several other parameters that regulate release probability or the mode of release could play a role.
We find that the gradient in transmission strength does not depend on the relative position of a bouton on the muscle surface, suggesting it is determined presynaptically by the polarity of the axon. This idea is supported by our finding of greater Ca2+ influx and vesicle fusion at distal boutons. In principle, this finding is consistent with either a positive regulator of transmission that is preferentially concentrated at the ends of axon branches, or a negative regulator of transmission that is delivered in limiting amounts and accumulates more in the first boutons it reaches during anterograde transport (Supplementary Fig. 4). Because bouton addition occurs throughout the length of the axon, not only at the ends of branches but also between previously established boutons16, a proximal-distal gradient in a bouton's developmental age is not likely to fully explain the gradient in transmission strength. Notably, a gradient has been observed in the arrangement of the microtubule associated protein 1B (MAP1B) along microtubules in the presynaptic terminal. Immuno-fluorescent mapping of MAP1B shows tight bundles of microtubules along axon branches with a higher incidence of microtubule “loops” at branch points and branch ends, as well as disarrayed microtubule patterns at the most distal boutons47,48. It is possible that as well as promoting the growth of the presynaptic terminal, microtubules may also have a role transporting components needed for synaptic transmission down the length of axon branches. Perhaps microtubule loops in axon kinks and at the end of branches, as well as microtubule disarray at the most distal boutons, favor the deposition of positive regulatory factors that increase transmission strength. It will be interesting in the future to examine the role of microtubules in determining transmission strength and to identify regulatory factors exist in an axonal gradient.
Materials and Methods
DNA constructs and Flies. Yellow cameleon (cam) 3.1 (gift from R. Y. Tsien)was converted to cam2.1 by reverting the Q104E mutation through site-directed mutagenesis (Quickchange, Stratagene). cam-null was derived from cam3.1 by mutations, E31Q, E67Q and E140Q, which abolish the Ca2+ binding sites. To target cameleon variants to the synapse (synapcam), cam2.1, cam3.1, and cam-null were amplified with _Spe_I primers (5′ GG ACT AGT GCC GCC ACC ATG GTG AGC 3′ and 5′GG ACT AGT GCA GAA TTC CTT GTA CAG 3′) and inserted into the _Spe_I sites of the CD8-GFP-Sh construct16, exchanging GFP for each cam variant. The genetic chimeras were placed under control of the MHC promoter24. Transgenic flies were made using standard germline transformation by embryo injection. Single insertions on the X chromosome were identified by orange eye color and confirmed by segregation analysis. Female larvae were used in all experiments.
For presynaptic exocytosis and calcium imaging respectively UAS-SpH37 and UASCam2.336 were driven pan-neuronally with elavC155-Gal4. UAS-monomeric-DsRed flies were a gift from G. Tavosanis. The genotype of animals expressing SpH and mDsRed was elavC155-Gal4/+, UAS-SpH/+, UAS-mDsRed/+.
Immunohistochemistry and Analysis. Larvae were fixed immediately after physiological recordings, either with Bouin's fixative for 5 min (DGluRIIA and DGluRIIB) or with 4% formaldehyde for 30 min (Nc82, Syt, HRP). The following primary antibodies were used: mouse anti-DGluRIIA (1:100)31, mouse anti-Syt (1:5), mouse anti-Dlg (1:100), mouse anti-HRP (1:100; Sigma), rabbit anti-DGluRIIB (1:2500)31, and NC-82 (1:100, gift from E. Buchner). Alexa 647-conjugated goat anti-mouse and Cy3-conjugated goat anti-rabbit secondary antibodies were used for double-labeling experiments (Molecular Probes).
Metamorph (Universal Imaging) was used to calculate the intensities of YFP, GluRs and Nc82 staining from confocal images. Because GluRs and Nc82 antibodies label in a punctal pattern, images were thresholded in Metamorph to discard grey levels below minimal staining. Total intensity was calculated for values above threshold within each postsynapse. The density of staining was taken as the percentage of area above threshold for a postsynapse.
Electrophysiology. Two-electrode voltage clamp recordings were done with an AxoClamp 2B amplifier (Axon Instruments) on Drosophila muscle 6 at segments A2 or A3 of third instar larvae. Unless otherwise stated recording solution consisted of physiological saline HL349 containing 1.5 mM Ca2+, 20 mM Mg+2, 2 μM thapsigargin, and 500 μM ryanodine. For presynaptic imaging 7 mM glutamate was added to prevent muscle contraction during high frequency stimulation. Recording electrodes contained 3M KCl and had resistances between 10-20 Ω. Only muscles with a resting membrane potential below −60 were chosen for study. For EJC studies the nerve was stimulated at 0.1 Hz and muscles clamped at −80 mV. During image acquisition muscles were held at −100 mV. The more negative holding potential (−100mV) improved cameleon signaling, presumably by increasing the Ca2+ driving force. Data were filtered at 1 KHz and recorded using a Digidata 1200A/B board and Clampex 8.0 software (Axon Instruments). mEJCs were analyzed with MiniAnalysis software (Synaptosoft), and other electrophysiological data were analyzed with Clampfit 8.0 (Axon Instruments).
Optical recording of FRET. Larvae were imaged with an ORCA-ER CCD camera (Hamamatsu) and an Olympus BX-50WI microscope (Olympus) with a 75W Xenon lamp and a 60x 0.9NA objective (Olympus). Excitation was at 434 ± 10 nm using a 460 nm dichroic filter. Emission wavelengths were separated with a dual-emission beam splitter (Optical Insights) with a 510 nm dichroic filter and 480 ± 20 nm and 535 ± 20 nm emission filters. Images were collected with SimplePCI software (Compix) at either 53 or 35 frames per second (8×8 or 4×4 binning, respectively). For presynaptic vesicle fusion experiments mDsRed was excited at 550 nm with Q585LP and HQ620/60 filters, and SpH was excited at 470 nm with a Q480LP and a HQ535/50 bandpass. All filters and dichroics were from Chroma Technology.
To obtain an accurate representation of amplitude and spatial distributions of transmission across synapses, the initial continuous imaging (Figs. 2-4) was substituted with episodic imaging, thereby minimizing photobleaching and allowing more responses to be measured. A pair of CCD images was acquired per stimulus, one prior to stimulation (baseline), and a second 100 ms after stimulation (around the peak of the SynapCam response) (Fig. 5a). Under these conditions the synapse could be imaged for up to 30 minutes while recording hundreds of responses. As shown in Figure 4a, responses were sub-saturating at all boutons, with a similar doubling of ΔFRET at distal (1.98 ± 0.15) and proximal (1.96 ± 0.8) postsynapses in response to a pulse pair.
Image analysis. Image analysis (Figs. 2-4) was performed with Bouton Project, software that enables overlaying CFP and YFP data, defining regions of interest, and quantifying fluorescence change over time (D. Raymond, personal communication). For extended experiments where two frames were acquired before and after stimulation (Figs. 5-7), images were analyzed in Matlab 7.0 (Mathworks). Details about image analysis are described in the Supplementary Methods.
Supplementary Material
Supplementary Materials and Methods
Supplementary Figure Legends
Supplementary Figure 1
Supplementary Figure 2
Supplementary Figure 3
Supplementary Figure 4
Acknowledgments
We thank D. Raymond for developing the Bouton Project software, K. Zito for initial cloning and transfection of _SynapCam_3.1, and M-M. Poo, R. Zucker, and M. Neff for comments on the manuscript. This work was funded by an NIH grant (E.Y.I. and C.S.G.), the Max-Planck-Society (D.F.R. and A.B.), and by support from the Howard Hughes Medical Institute (G.G. and C.S.G.).
References
- 1.Hua JY, Smith SJ. Neural activity and the dynamics of central nervous system development. Nat. Neurosci. 2004;7:327–332. doi: 10.1038/nn1218. [DOI] [PubMed] [Google Scholar]
- 2.Constantine-Paton M, Cline HT. LTP and activity-dependent synaptogenesis: the more alike they are, the more different they become. Curr. Opin. Neurobiol. 1998;8:139–48. doi: 10.1016/s0959-4388(98)80017-2. [DOI] [PubMed] [Google Scholar]
- 3.Turrigiano GG, Nelson SB. Hebb and homeostasis in neuronal plasticity. Curr. Opin. Neurobiol. 2000;10:358–64. doi: 10.1016/s0959-4388(00)00091-x. [DOI] [PubMed] [Google Scholar]
- 4.Liu G. Presynaptic control of quantal size: kinetic mechanisms and implications for synaptic transmission and plasticity. Curr. Opin. Neurobiol. 2003;13:324–31. doi: 10.1016/s0959-4388(03)00078-3. [DOI] [PubMed] [Google Scholar]
- 5.Oertner TG. Functional imaging of single synapses in brain slices. Exp. Physiol. 2002;87:733–6. doi: 10.1113/eph8702482. [DOI] [PubMed] [Google Scholar]
- 6.Fetcho JR, O'Malley DM. Imaging neuronal networks in behaving animals. Curr. Opin. Neurobiol. 1997;7:832–8. doi: 10.1016/s0959-4388(97)80143-2. [DOI] [PubMed] [Google Scholar]
- 7.Murthy VN. Optical detection of synaptic vesicle exocytosis and endocytosis. Curr. Opin. Neurobiol. 1999;9:314–20. doi: 10.1016/s0959-4388(99)80046-4. [DOI] [PubMed] [Google Scholar]
- 8.Koester HJ, Johnston D. Target Cell-Dependent Normalization of Transmitter Release at Neocortical Synapses. Science. 2005;308:863–866. doi: 10.1126/science.1100815. [DOI] [PubMed] [Google Scholar]
- 9.Murthy VN, Sejnowski TJ, Stevens CF. Heterogeneous release properties of visualized individual hippocampal synapses. Neuron. 1997;18:599–612. doi: 10.1016/s0896-6273(00)80301-3. [DOI] [PubMed] [Google Scholar]
- 10.Koester HJ, Sakmann B. Calcium dynamics associated with action potentials in single nerve terminals of pyramidal cells in layer 2/3 of the young rat neocortex. J. Physiol. 2000;529(Pt 3):625–46. doi: 10.1111/j.1469-7793.2000.00625.x. [DOI] [PMC free article] [PubMed] [Google Scholar]
- 11.Zito K, Fetter RD, Goodman CS, Isacoff EY. Synaptic clustering of Fasciclin II and Shaker: Essential targeting sequences and role of Dlg. Neuron. 1997;19:1007–1016. doi: 10.1016/s0896-6273(00)80393-1. [DOI] [PubMed] [Google Scholar]
- 12.Tejedor FJ, et al. Essential role for dlg in synaptic clustering of shaker K+ channels in vivo. J. Neurosci. 1997;17:152–159. doi: 10.1523/JNEUROSCI.17-01-00152.1997. [DOI] [PMC free article] [PubMed] [Google Scholar]
- 13.Sorra KE, Harris KM. Occurrence and three-dimensional structure of multiple synapses between individual radiatum axons and their target pyramidal cells in hippocampal area CA1. J. Neurosci. 1993;13:3736–48. doi: 10.1523/JNEUROSCI.13-09-03736.1993. [DOI] [PMC free article] [PubMed] [Google Scholar]
- 14.Atwood HL, Govind CK, Wu C-F. Differential ultrastructure of synaptic terminals on ventral longitudinal abdominal muscles in Drosophila larvae. J. Neurobiol. 1993;24:1008–1024. doi: 10.1002/neu.480240803. [DOI] [PubMed] [Google Scholar]
- 15.Schuster CM, Davis GW, Fetter RD, Goodman CS. Genetic dissection of structural and functional components of synaptic plasticity. I. Fasciclin II controls synaptic stabilization and growth. Neuron. 1996;17:641–54. doi: 10.1016/s0896-6273(00)80197-x. [DOI] [PubMed] [Google Scholar]
- 16.Zito K, Parnas D, Fetter RD, Isacoff EY, Goodman CS. Watching a synapse grow: Noninvasive confocal imaging of synaptic growth in Drosophila. Neuron. 1999;22:719–729. doi: 10.1016/s0896-6273(00)80731-x. [DOI] [PubMed] [Google Scholar]
- 17.McCabe BD, et al. The BMP homolog Gbb provides a retrograde signal that regulates synaptic growth at the Drosophila neuromuscular junction. Neuron. 2003;39:241–54. doi: 10.1016/s0896-6273(03)00426-4. [DOI] [PubMed] [Google Scholar]
- 18.Aberle H, et al. wishful thinking encodes a BMP type II receptor that regulates synaptic growth in Drosophila. Neuron. 2002;33:545–58. doi: 10.1016/s0896-6273(02)00589-5. [DOI] [PubMed] [Google Scholar]
- 19.Marques G, et al. The Drosophila BMP type II receptor Wishful Thinking regulates neuromuscular synapse morphology and function. Neuron. 2002;33:529–43. doi: 10.1016/s0896-6273(02)00595-0. [DOI] [PubMed] [Google Scholar]
- 20.Haghighi AP, et al. Retrograde control of synaptic transmission by postsynaptic CaMKII at the Drosophila neuromuscular junction. Neuron. 2003;39:255–67. doi: 10.1016/s0896-6273(03)00427-6. [DOI] [PubMed] [Google Scholar]
- 21.Chang H, Ciani S, Kidokoro Y. Ion permeation properties of the glutamate receptor channel in cultured embryonic Drosophila myotubes. J. Physiol. 1994;476:1–16. [PMC free article] [PubMed] [Google Scholar]
- 22.Miyawaki A, et al. Fluorescent indicators for Ca2+ based on green fluorescent proteins and calmodulin. Nature. 1997;388:882–887. doi: 10.1038/42264. [DOI] [PubMed] [Google Scholar]
- 23.Miyawaki A, Griesbeck O, Heim R, Tsien RY. Dynamic and quantitative Ca2+ measurements using improved cameleons. Proc. Natl. Acad. Sci. U. S. A. 1999;96:2135–2140. doi: 10.1073/pnas.96.5.2135. [DOI] [PMC free article] [PubMed] [Google Scholar]
- 24.Chiba A, Snow P, Keshishian H, Hotta Y. Fasciclin III as a synaptic target recognition molecule in Drosophila. Nature. 1995;374:166–8. doi: 10.1038/374166a0. [DOI] [PubMed] [Google Scholar]
- 25.Johansen J, Halpern ME, Johansen KM, Keshishian H. Stereotypic morphology of glutamatergic synapses on identified muscle cells of Drosophila larvae. J. Neurosci. 1989;9:710–25. doi: 10.1523/JNEUROSCI.09-02-00710.1989. [DOI] [PMC free article] [PubMed] [Google Scholar]
- 26.Jia XX, Gorczyca M, Budnik V. Ultrastructure of neuromuscular junctions in Drosophila: comparison of wild type and mutants with increased excitability. J. Neurobiol. 1993;24:1025–44. doi: 10.1002/neu.480240804. [DOI] [PMC free article] [PubMed] [Google Scholar]
- 27.Treiman M, Caspersen C, Christensen SB. A tool coming of age: thapsigargin as an inhibitor of sarcoendoplasmic reticulum Ca2+-ATPases. Trends Pharmacol. Sci. 1998;19:131–135. doi: 10.1016/s0165-6147(98)01184-5. [DOI] [PubMed] [Google Scholar]
- 28.Sullivan KMC, Scott K, Zuker CS, Rubin GM. The ryanodine receptor is essential for larval development in Drosophila melanogaster. Proc. Natl. Acad. Sci. U. S. A. 2000;97:5942–5947. doi: 10.1073/pnas.110145997. [DOI] [PMC free article] [PubMed] [Google Scholar]
- 29.Davis GW, Goodman CS. Synapse-specific control of synaptic efficacy at the terminals of a single neuron. Nature. 1998;392:82–6. doi: 10.1038/32176. [DOI] [PubMed] [Google Scholar]
- 30.Petersen SA, Fetter RD, Noordemeer JN, Goodman CS, DiAntonio A. Genetic analysis of glutamate receptors in Drosophila reveals a retrograde signal regulating presynaptic transmitter release. Neuron. 1997;19:1237–1248. doi: 10.1016/s0896-6273(00)80415-8. [DOI] [PubMed] [Google Scholar]
- 31.Marrus SB, Portman SL, Allen MJ, Moffat KG, DiAntonio A. Differential localization of glutamate receptor subunits at the Drosophila neuromuscular junction. J. Neurosci. 2004;24:1406–15. doi: 10.1523/JNEUROSCI.1575-03.2004. [DOI] [PMC free article] [PubMed] [Google Scholar]
- 32.Qin G, et al. Four Different Subunits Are Essential for Expressing the Synaptic Glutamate Receptor at Neuromuscular Junctions of Drosophila. J. Neurosci. 2005;25:3209–3218. doi: 10.1523/JNEUROSCI.4194-04.2005. [DOI] [PMC free article] [PubMed] [Google Scholar]
- 33.DiAntonio A, Petersen SA, Heckmann M, Goodman CS. Glutamate Receptor Expression Regulates Quantal Size and Quantal Content at the Drosophila Neuromuscular Junction. J. Neurosci. 1999;19:3023–3032. doi: 10.1523/JNEUROSCI.19-08-03023.1999. [DOI] [PMC free article] [PubMed] [Google Scholar]
- 34.Wucherpfennig T, Wilsch-Brauninger M, Gonzalez-Gaitan M. Role of Drosophila Rab5 during endosomal trafficking at the synapse and evoked neurotransmitter release. J. Cell Biol. 2003;161:609–624. doi: 10.1083/jcb.200211087. [DOI] [PMC free article] [PubMed] [Google Scholar]
- 35.Griesbeck O, Baird GS, Campbell RE, Zacharias DA, Tsien RY. Reducing the environmental sensitivity of yellow fluorescent protein. Mechanism and applications. J. Biol. Chem. 2001;276:29188–94. doi: 10.1074/jbc.M102815200. [DOI] [PubMed] [Google Scholar]
- 36.Reiff DF, et al. In vivo performance of genetically encoded indicators of neural activity in flies. J. Neurosci. 2005;25:4766–78. doi: 10.1523/JNEUROSCI.4900-04.2005. [DOI] [PMC free article] [PubMed] [Google Scholar]
- 37.Miesenbock G, De Angelis DA, Rothman JE. Visualizing secretion and synaptic transmission with pH-sensitive green fluorescent proteins. Nature. 1998;394:192–195. doi: 10.1038/28190. [DOI] [PubMed] [Google Scholar]
- 38.Atwood HL. Variation in physiological properties of crustacean motor synapses. Nature. 1967;215:57–8. doi: 10.1038/215057a0. [DOI] [PubMed] [Google Scholar]
- 39.Lavidis NA, Bennett MR. Probabilistic secretion of quanta from visualized sympathetic nerve varicosities in mouse vas deferens. J. Physiol. 1992;454:9–26. doi: 10.1113/jphysiol.1992.sp019252. [DOI] [PMC free article] [PubMed] [Google Scholar]
- 40.Bennett MR, Jones P, Lavidis NA. The probability of quantal secretion along visualized terminal branches at amphibian (Bufo marinus) neuromuscular synapses. J. Physiol. 1986;379:257–74. doi: 10.1113/jphysiol.1986.sp016252. [DOI] [PMC free article] [PubMed] [Google Scholar]
- 41.Bittner GD. Differentiation of Nerve Terminals in the Crayfish Opener Muscle and Its Functional Significance. J. Gen. Physiol. 1968;51:731–758. doi: 10.1085/jgp.51.6.731. [DOI] [PMC free article] [PubMed] [Google Scholar]
- 42.Cooper RL, Harrington CC, Marin L, Atwood HL. Quantal release at visualized terminals of a crayfish motor axon: intraterminal and regional differences. J. Comp. Neurol. 1996;375:583–600. doi: 10.1002/(SICI)1096-9861(19961125)375:4<583::AID-CNE3>3.0.CO;2-Y. [DOI] [PubMed] [Google Scholar]
- 43.Robitaille R, Tremblay JP. Non-uniform responses to Ca2+ along the frog neuromuscular junction: effects on the probability of spontaneous and evoked transmitter release. Neuroscience. 1991;40:571–85. doi: 10.1016/0306-4522(91)90142-b. [DOI] [PubMed] [Google Scholar]
- 44.Davis GW, DiAntonio A, Petersen SA, Goodman CS. Postsynaptic PKA controls quantal size and reveals a retrograde signal that regulates presynaptic transmitter release in Drosophila. Neuron. 1998;20:305–15. doi: 10.1016/s0896-6273(00)80458-4. [DOI] [PubMed] [Google Scholar]
- 45.Reiff DF, Thiel PR, Schuster CM. Differential Regulation of Active Zone Density during Long-Term Strengthening of Drosophila Neuromuscular Junctions. J. Neurosci. 2002;22:9399–9409. doi: 10.1523/JNEUROSCI.22-21-09399.2002. [DOI] [PMC free article] [PubMed] [Google Scholar]
- 46.Quigley PA, Msghina M, Govind CK, Atwood HL. Visible evidence for differences in synaptic effectiveness with activity-dependent vesicular uptake and release of FM1-43. J. Neurophys. 1999;81:356–370. doi: 10.1152/jn.1999.81.1.356. [DOI] [PubMed] [Google Scholar]
- 47.Roos J, Hummel T, Ng N, Klambt C, Davis GW. Drosophila Futsch regulates synaptic microtubule organization and is necessary for synaptic growth. Neuron. 2000;26:371–82. doi: 10.1016/s0896-6273(00)81170-8. [DOI] [PubMed] [Google Scholar]
- 48.Ruiz-Canada C, et al. New synaptic bouton formation is disrupted by misregulation of microtubule stability in aPKC mutants. Neuron. 2004;42:567–80. doi: 10.1016/s0896-6273(04)00255-7. [DOI] [PMC free article] [PubMed] [Google Scholar]
- 49.Stewart BA, Atwood HL, Renger JJ, Wang J, Wu C-F. Improved stability of Drosophila larval neuromuscular preparations in haemolymph-like physiological solutions. J. Comp. Phys. 1994;175:179–191. doi: 10.1007/BF00215114. [DOI] [PubMed] [Google Scholar]
Associated Data
This section collects any data citations, data availability statements, or supplementary materials included in this article.
Supplementary Materials
Supplementary Materials and Methods
Supplementary Figure Legends
Supplementary Figure 1
Supplementary Figure 2
Supplementary Figure 3
Supplementary Figure 4