Rac1-null Mouse Embryonic Fibroblasts Are Motile and Respond to Platelet-derived Growth Factor (original) (raw)
Abstract
Previous studies of Rac1 in fibroblasts have used dominant negative constructs, which may have nonspecific effects. We used a conditional Rac1 allele to critically examine Rac1 function in mouse fibroblasts. Lack of Rac1 had dramatic effects on nonconfluent cells, which were elongated and had extensive blebbing, but no lamellipodia or ruffle formation. However, Rac1-null fibroblasts translocated using pseudopodia-like protrusions without lamellipodia, migrating toward a platelet-derived growth factor (PDGF) gradient as efficiently as their wild-type counterparts. Rac1-null fibroblasts closed wounds in vitro and spread on a fibronectin substrate, although at a slower rate than wild-type cells. However, Rac1-null cells were markedly impaired in proliferation, with a defect in G1 to S transition, although they were capable of surviving in culture for more than 2 wk. These results refine our understanding of the functions of Rac1, indicate that lamellipodia formation is not required for cell motility, and show that PDGF-induced chemotaxis can occur in the absence of both lamellipodia and Rac1.
INTRODUCTION
Rac is a small Rho-type GTPase that has been shown to play a critical role in cell movement (Anand-Apte et al., 1997; Allen et al., 1998; Nobes and Hall, 1999; Banyard et al., 2000; Ridley, 2001; Etienne-Manneville and Hall, 2002), cell spreading (Clark et al., 1998; Price et al., 1998), cell cycle progression (Westwick et al., 1997; Joyce et al., 1999), and transformation (Qiu et al., 1995). In mammals there are three Rac isoforms: Rac1, which is ubiquitous (Didsbury et al., 1989); Rac2, expressed only in the hematopoetic system (Didsbury et al., 1989; Shirsat et al., 1990); and Rac3, with predominant nervous system expression (Haataja et al., 1997).
Most functional analysis of Rac1 in mammalian cells has been done using dominant negative (DN) mutants where threonine 17 is mutated to asparagine (T17N; Ridley et al., 1992). These mutants are thought to act by sequestering guanine nucleotide exchange factors (GEFs), which function as activators for Rac1 (Feig, 1999; Manser, 2002). DN mutants typically have both severely reduced affinity for GTP and a higher affinity for GEFs than wild-type proteins, explaining this sequestration activity (Feig, 1999).
Using DN mutants of Rac1 in fibroblasts, it was found that Rac1 is responsible for the generation of lamellipodia and ruffles (Ridley et al., 1992). Moreover, these experiments indicated that Rac1 but not Cdc42 was indispensable for fibroblast chemotaxis toward platelet-derived growth factor (PDGF; Anand-Apte et al., 1997) and suggested that Rac1 is also important for invasion into collagen matrices (Banyard et al., 2000). Rac1 was also proposed to be indispensable for in vitro wound closure of cell monolayers (Fenteany et al., 2000; Nobes and Hall, 1999) and has been implicated in the process of fibroblast spreading on fibronectin (Clark et al., 1998; Price et al., 1998; Berrier et al., 2000). In addition, Rac1 has been identified as a critical intermediate in cell proliferation, in particular as an activator of a signaling cascade that results in growth factor-dependent cyclin D1 expression (Westwick et al., 1997; Joyce et al., 1999).
Although the use of DN mutants has revealed numerous processes where Rac1 is involved, this approach has significant limitations, which are often ignored. Most importantly, such constructs may bind to multiple GEFs in a promiscuous manner, leading to impaired GTPase loading of not only Rac isoforms but also Cdc42 and rho family members (Hiraoka et al., 1992; Schmidt and Hall, 2002; Guo et al., 2003).
Mouse embryos deficient for Rac1 die at embryonic day 6.5 (E6.5) from incomplete gastrulation (Sugihara et al., 1998). For essential genes, such as Rac1, the creation of conditional alleles enables embryonic survival and normal development, and allows for the conversion to null alleles in more differentiated cell types. Using this approach, we and others have examined the function of Rac1 in a variety of hematopoietic cells (Gu et al., 2003; Walmsley et al., 2003), demonstrating that in neutrophils, Rac1 is necessary for chemotactic gradient sensing (Sun et al., 2004), whereas Rac2 is required for cell motility and NADPH oxidase-dependent superoxide production (Glogauer et al., 2003; Gu et al., 2003). In mouse macrophages, Rac1 deficiency leads to normal motility but with altered morphology and reduced ruffling activity (Wells et al., 2004).
We have now used this approach to generate mouse embryonic fibroblast lines lacking Rac1. This cell type was chosen because it is the prototypical cell line most commonly used for motility studies and also lacks both Rac2 and Rac3. Although Rac1-null fibroblasts have a dramatically altered morphology and are unable to form lamellipodia or ruffles, they are still capable of translocation and chemotaxis toward PDGF.
MATERIALS AND METHODS
Mouse Alleles, PCR, and Southern Blot
Rac1 conditional and null alleles were generated as previously reported (Glogauer et al., 2003; Gu et al., 2003). The conditional Rac1 allele contains loxP sites flanking exon 1; upon cre-mediated excision this allele generates a null allele. We also used an EGFP reporter gene driven by the Rosa26 promoter (Mao et al., 2001). In the reporter gene, the promoter has been interrupted by a stop cassette flanked by loxP sites. EGFP-expressing cells were analyzed by FACS (FACSCalibur system, Becton Dickinson, Mountain View, CA). Allele identification was done by PCR genotyping mice and cells as described (Mao et al., 2001; Glogauer et al., 2003).
Southern blots were performed by standard methods. DNA was digested with StuI, and after electrophoresis and transfer to a nylon membrane, was probed with a random primer labeled 0.8-kb NsiI-AccI genomic fragment from intron 1 of Rac1. The DNA fragment corresponding to the conditional allele has size 11 kb, the knockout allele (k) has size 7 kb, and the wild-type (w) allele 5 kb.
Cell Culture
Mouse embryonic fibroblasts (MEFs) were derived from decapitated E13.5 embryos. Matings between Rac1c/c mice (no phenotype) and Rac1c/w, Rac1w/w, and Rac1k/w were all used. Cells were cultured in DMEM containing glutamine, nonessential amino acids, penicillin/streptomycin, 20 mM HEPES, 70 μM β-mercaptoethanol, and 15% heat-inactivated fetal bovine serum (HI-FBS). All tissue culture materials were from Cellgro Mediatech (Herndon, VA).
Primary cells were frozen in aliquots after the second passage. Cell line immortalization was done using the 3T3 immortalization protocol (Todaro and Green, 1963). Briefly, cells were subcultured every 3 d at a density of 1.17 × 10⁶ cells per 10-cm dish. Immortalization was inferred when cells reached passage 30. At that point aliquots were frozen and experiments were performed with cells between passage 30 and 40 for all experiments reported here.
HTNC Purification and Transduction
A cell permeant version of cre-recombinase, with engineered HTNC (polyhistidine, HIV TAT fusion protein, and nuclear localization sequences added to the cre cDNA), was used to convert the Rac1 conditional allele to a null allele (Peitz et al., 2002; kindly provided by Dr. Edenhofer from Institute for Genetics, University of Cologne, Germany). We modified the HTNC purification protocol as follows. The HTNC plasmid construct was expressed in Escherichia coli strain TUNER (DE3)pLacI (Novagen, Madison, WI). Beginning with a single colony, an overnight culture of 100 ml was grown in LB media with 200 μg/ml ampicillin and 34 μg/ml chloramphenicol. The overnight culture was then inoculated into 4 l of LB with 100 μg/ml ampicillin and grown at 37°C until an OD600 of 0.7 (approximately 3-4 h). IPTG was then added to 0.5 mM and the cells were grown for an additional 3-4 h. Cell pellets were collected by centrifugation at 6000 × g for 30 min and frozen in aliquots. Pellets corresponding to 2-l culture were resuspended in 100 ml of 1 M NaCl, 20 mM HEPES, pH 7.4, 10 mM imidazole. Lysis was achieved by addition of 10 ml of 10× bugbuster (Novagen), 200 ml benzoase (Novagen), and 2 mg/ml lysozyme (Sigma-Aldrich, St. Louis, MO) with gentle rocking at room temperature for 20 min. The extracts were spun at 16,000 × g for 20 min at 4°C and the supernatant was incubated with 20 ml of Ni-NTA agarose slurry for 1 h. The slurry was loaded into a column and washed extensively (10 vol) with 1 M NaCl, 20 mM HEPES, pH 7.4, 20 mM imidazole. For elution the slurry was resuspended in 10 ml of 1 M NaCl, 20 mM HEPES, pH 7.4, and 250 mM imidazole and eluted with 30 ml more of this high imidazole buffer. Fractions of 5 ml were collected and dialyzed against 50% glycerol 1 M NaCl, 20 mM HEPES. Under these conditions the protein remains soluble and the final concentration is 10-20 mg/ml. HTNC preparations were stored at -20°C for use within 1-2 mo, or frozen at -80°C for long-term storage.
Cells were transduced with HTNC at a density of 2 × 10⁶ cells per 10-cm dish. HTNC was diluted to 200 μg/ml in Opti-MEM (Invitrogen) plus glutamine, nonessential amino acids, penicillin/streptomycin, 20 mM HEPES, 70 μM β-mercaptoethanol. The solution was put through a 0.2-μm filter for sterilization, and 3 ml was added to a phosphate-buffered saline (PBS)-rinsed 10-cm plate containing the cells. Cells were incubated at 37°C for 16 h, allowed to recover for 8 h in the presence of serum, and treated with HTNC in medium for an additional 16 h. Control cells were treated in the same way but no HTNC was added to the Opti-MEM medium. After the last HTNC treatment cells were allowed to recover in the presence of serum for 24 h and split to a density of 0.5 × 10⁶ cells per 10-cm dish. Cells were analyzed the next day after passage (day 4 after HTNC) and for up to a week thereafter.
Time-Lapse Microscopy and Motility
For time-lapse microscopy, the cells were plated on MatTek dishes (MatTek, Ashland, MA) containing a glass coverslip coated with 2 μg/ml fibronectin (Sigma-Aldrich) at a density of 10,000-20,000 cells per plate. At least 12 h after plating the cells were starved for 12 h. Cell dishes were then placed on the 37°C heated stage of a Nikon Diaphot 300 inverted microscope (Melville, NY; courtesy of Dr. Phil Allen). The medium included 20 mM HEPES to stabilize the pH. Fluorescent images were acquired using a cooled CCD camera with a 1300 × 1030 chip (Roper Scientific, Tucson, AZ).
Most image sequences were acquired at 10-min intervals, using a 10× phase objective and flat field correction, using acquisition software Esee (ISee Imaging Systems, Raleigh, NC). This system also drove automated sampling such that images were acquired from 5 to 10 fields simultaneously. Images were imported as stacks to ImageJ (NIH) and analyzed with the manual tracking plug-in. Results presented are reported as the average velocity from 60 to 70 cells tracked over a period of 6 h.
Blebbistatin (Tocris, Ellisville, MO) was dissolved in dimethyl sulfoxide to 100 mM and added to cells at 100 μM while on the microscope stage. Immediately after blebbistatin was added to the medium, a sequence of images with a 1-min interval was collected.
The wound closure assay was performed by a single scratch of a cell monolayer with a plastic pipette tip. A consistently straight region was identified and images were acquired in a single field every 10 min as indicated above. For wound closure rates, images at 2-h intervals were selected. Wound edges were approximated by manually marking the image with 5 points on each side of the wound and fitting them to a straight line with a fixed vertical slope. The intersection with the _x_-axis was used as the position of the wound edge. Results from both edges were averaged. In addition, 10 randomly selected single cells at the wound edge were tracked at 40-min intervals using the ImageJ (NIH) manual tracking plug-in. Persistence was defined as the ratio of absolute displacement (D) over total (T) length of the path (D/T).
Chemotaxis Assay
Chemotaxis was assayed in a modified Boyden chamber. Six-millimeter-diameter transwell inserts with 8-μm pores were used in 24-well plates (Corning Glass Works, Corning, NY). Trypsinized cells recovered for 30 min in full media and were then plated in 0.2 ml of DMEM in the upper chamber with 0.7 ml of DMEM containing the chemoattractant (PDGF) at the indicated concentration in the bottom chamber. Cells were incubated in a standard incubator for 4 h. Medium was removed from the upper chamber by aspiration and the inserts were placed in 1 ml of 3.7% formaldehyde (Fisher, Pittsburgh, PA) in PBS. After 15 min the fixative was removed from the upper chamber and the inserts were placed in 1 ml of PBS. At this point the inserts were either immediately processed or stored at 4°C for up to 1 wk.
To count the cells, their nuclei were stained by placing the inserts in 2 μg/ml Hoechst 33258 (Molecular Probes, Eugene, OR; Invitrogen), in PBS + 0.5% saponin (ICN Biomedicals, Costa Mesa, CA) for 15 min. The inserts were then placed in 1 ml PBS and imaged with a fluorescent microscope, a cooled CCD camera and a 10× objective (see above). Images were collected from five fields on each membrane; afterward the cells on top of the chamber were mechanically removed with a cotton swab and the membrane was imaged again in five places. Cell migration was calculated as the fraction of cells remaining after removing all of the cells on the upper surface. To differentiate chemotaxis from chemokinesis, parallel wells were incubated without chemoattractant or with the same concentration of chemoattractant in the lower and upper chamber. All measurements were done in duplicate and the experiment was repeated three times.
To test the effect of dominant negative (DN) Rac1 expression on the chemotaxis of Rac1-null cells, we transiently transfected cells with an expression vector (pcDNA3.1+) containing a 2x-myc-N-terminus-tagged DN Rac1 (T17N mutation), using Lipofectamine 2000 (Invitrogen). The vector was obtained from the cDNA Resource Center at the University of Missouri-Rolla. Cells were transfected during the second day of HTNC treatment and were thus treated simultaneously with HTNC and Lipofectamine 2000. The next day the cells were incubated in fresh medium. Cells were passaged the following day, and at day 6 after HTNC addition the chemotaxis transwell assay was performed. After fixation the cells were washed in PBS, blocked, and permeabilized in 1 ml of PBFS buffer (PBS + 5% BSA + 10% fetal bovine serum + 0.5% saponin) for 1 h. A monoclonal antibody (mAb) against myc was diluted 1:200 in PBFS, and the transwell inserts were incubated overnight at 4°C. The inserts were washed three times in PBS for 5 min and then exposed to a goat anti-mouse Alexa-546-labeled secondary antibody (Invitrogen) for 2 h. The inserts were stained with 2 ml of 2 μg/ml Hoechst (Invitrogen) for 30 min and washed two times with PBS. Images were acquired with a KineticScan (Cellomics, Pittsburgh, PA) automated microscope for 15 fields per insert using a 10× lens. Cells were analyzed using the Target Activation Bioapplication (Cellomics). Nuclei were identified in the Hoechst channel and the area dilated by 2 pixels in the Alexa 546 channel to include some cytoplasmic signal. Positive cells were identified by setting the background using an insert with untransfected cells. After scanning the wells in the presence and absence of PDGF, the top surface was wiped using a cotton swab and the transwell was scanned again. The transwells without PDGF did not give a significant signal after wiping. Using the nuclei to identify the total number of cells, the fraction of positive cells was compared from the initial and wiped images. All measurements were done in duplicate and the experiment was repeated four times.
Akt-PH-GFP Translocation
Cells were serum-starved for 16 h and microinjected with an expression vector encoding the PH-domain of murine Akt tagged with a yellow variant of the green fluorescent protein (GFP; YPH-Akt), as described previously (Zhang et al., 2003). Cells were studied 3-4 h after microinjection and were stimulated with 20 ng/ml PDGF. YFP was excited using a 500 ± 15-nm bandpass filter and YFP emission was recorded using a 535 ± 15-nm bandpass filter. During imaging, cells were kept at 37°C. Several cells were observed in each experiment, the experiment was performed twice. Images were analyzed as described previously (Zhang et al., 2003).
Antibodies, Immunoblots, and Immunofluorescence
mAb against Rac1 was obtained from Becton Dickinson (clone 102). The polyclonal antibody against the p34 subunit of the Arp2/3 complex and anti-myc-tag (clone 4A6) were from Upstate Biotechnology (Lake Placid, NY). Polyclonal anti Akt and monoclonal anti phospho-Akt (S473; clone 587F11) were from Cell Signaling Technology (Beverly, NA). Anti-tubulin (clone E7) was from the Developmental Studies Hybridoma Bank, Iowa. Monoclonal anti-vinculin was from ICN Biomedicals (Costa Mesa, CA; clone FB11). HRP-conjugated secondary antibodies were from Santa Cruz Biotechnology (Santa Cruz, CA). Proteins were separated on NuPage gels (Invitrogen) blotted onto nitrocellulose (Bio-Rad, Richmond, CA) and probed using standard Western protocols (Zhang et al., 2003).
To test the specificity of the anti-Rac antibody, HEK293 cells were separately transfected with GST fusion constructs corresponding to the three different Rac isoforms (kindly provided by Dr. Nora Heisterkam, Department of Pathology, Children's Hospital Los Angeles Research Institute and School of Medicine, University of Southern California, Los Angeles); protein was extracted and probed by Western blotting.
For immunostaining, cells were fixed in 3.7% formaldehyde in PBS for 30 min, washed in PBS, permeabilized, and blocked in PBFS for 1 h. Primary antibodies were diluted in PBFS and then incubated for 2 h, washed three times in PBS for 5 min, and then exposed to secondary antibody for 1 h, washed, and mounted in ProLong Antifade (Molecular Probes). F-actin was localized in formaldehyde-fixed and saponin-permeabilized cells using 200 nM Alexa- or TRITC-conjugated phalloidin (Molecular Probes). TRITC-conjugated secondary antibodies were from Sigma-Aldrich.
Cdc42-GTP Pulldown Assay
Cells were rendered quiescent by incubation in serum-free medium for 16 h. After incubation with or without PDGF, cells were washed twice in ice-cold Tris-buffered saline (20 mM Tris/HCl, pH 7.5, 120 mM NaCl) and lysed in RIPA buffer (20 mM Tris/HCl, pH 7.5, 120 mM NaCl, 1% Triton X-100, 0.5% sodium deoxycholate, 0.1% SDS, 10 mM MgCl2, 0.2 M phenylmethylsulfonyl fluoride, 10 μg/ml aprotinin, and 10 μg/ml leupeptin) at 4°C. The cell lysates were precleared, samples of supernatant were withdrawn for determination of total GTPases, and the remaining supernatant was incubated with 20 μg of GST-PAK-CRIB protein (Sander et al., 1998) in the presence of glutathione-Sepharose beads (GE Healthcare) at 4°C for 30 min. The beads were washed three times with 20 mM Tris/HCl (pH 7.5), 1% Triton X-100, and 10 mM MgCl2, and the extent of GTP-bound Cdc42 was determined by Western blot using anti-Cdc42 antibody (Transduction Laboratories, Lexington, KY). This experiment was performed in duplicate.
Cell Cycle Analysis and Bromodeoxyuridine Incorporation
Cell cycle analysis was done by determining the DNA concentration per cell using 40 μg/ml propidium iodide (PI) for total DNA staining (Crissman and Steinkamp, 1973) with FACS analysis. The PI fluorescent signal was collected from width and area scatter plots, and cell cycle phases were estimated by fitting the resulting histograms with ModFit LT (Verity Software House, Topsham, ME).
DNA synthesis was measured by bromodeoxyuridine (BrdU) incorporation and FACS (Dolbeare et al., 1983). For PDGF and serum stimulation of growth, cells were starved for 16 h, and together with the stimulus (either 20 ng/ml PDGF or 15% HI-FBS) 20 μM BrdU was added. After 16 h the cells were harvested by trypsinization, washed in PBS, resuspended in 300 μl of PBS, and fixed by the addition of 700 μl of ice-cold absolute ethanol. Fixed cells were stored at -20°C until use. To detect BrdU, an FITC-conjugated anti-BrdU antibody from Becton Dickinson (BD) was used following supplier protocols. Briefly, cells in 70% ethanol were pelleted, resuspended in 1 ml of 2 N HCl with 0.5% Triton X-100, incubated for 30 min at room temperature, pelleted, and neutralized with 2 ml of 100 mM Tris HCl, pH 8.5 + 0.5% Triton X-100. Cells were pelleted and resuspended in 1 ml of PBS + 0.5 Tween + 1% BSA (PBSTB) twice, and then 15 μl of the BD antibody was added and incubated for 1 h. Cells were then diluted 10-fold in PBSTB, centrifuged, and resuspended in 300 μl of PBS for FACS analysis. BrdU incorporation from starved cells over the same period of time was subtracted from the stimulated values. To estimate the fraction of cells undergoing DNA synthesis in the presence of serum at steady state, the cells were incubated for 1 h with 20 μM BrdU, and immediately harvested and processed as above.
Statistical Analysis
All statistical analysis were done using student t test, and p ≤ 0.05 was considered significant. All error bars shown are the SEM. The number of replicates and statistical significance are indicated in Results and in the figure legends.
RESULTS
Generation of Rac1 Conditional Mouse Embryonic Fibroblasts
Primary and immortalized MEFs were generated, containing various combinations of a conditional, floxed Rac1 allele (c) and null (k) and wild-type (w) Rac1 alleles (Glogauer et al., 2003; Gu et al., 2003). To be able to track gene conversion upon exposure to cre recombinase, these lines also contained an EGFP reporter allele in the Rosa26 locus for which expression is blocked by a _loxP_-flanked stop fragment (Mao et al., 2001).
To efficiently excise _loxP_-flanked genomic fragments, a fusion protein consisting of an HTNC protein (Peitz et al., 2002) was applied to cells. Cells were exposed to the HTNC protein for two consecutive treatments of 16 h each, with 8-h recovery in serum-containing media between them. Analysis of EGFP expression demonstrated that nearly all Rosa26-EGFP cells expressed EGFP 4 d after HTNC exposure (Figure 1A). Southern blot analysis 4 d after HTNC exposure confirmed that there was quantitative conversion of the c allele of Rac1 to the k allele in cells treated this way (Figure 1B). Hereafter, we use the term c/c-k/k and c/k-k/k to denote cells in which the HTNC peptide has been used to generate Rac1-null cells of genotype Rac1k/k, from Rac1c/c and Rac1c/k cells, respectively (see Materials and Methods). In the studies that follow, we examined both primary and immortalized MEFs, always in paired samples that were examined 5-7 d after HTNC treatment. The primary MEFs had genotypes Rac1c/k and Rac1c/w only, whereas the immortalized cell line had genotype Rac1c/c only.
Figure 1.

Rac1 deletion in MEF cultures. (A) Flow cytometry analysis of EGFP expression. A floxed EGFP reporter gene is activated by cre-mediated recombination in these cells (see Materials and Methods). Cells with genotypes Rac1k/c (k/c), and Rac1w/c (w/c) are primary cultures, whereas cells with genotype Rac1c/c (c/c) are immortalized. Note that nearly all cells contain EGFP after HTNC exposure. (B) Southern blot analysis of DNA from immortalized (c/c) and primary (w/c and k/c) MEF cultures was digested with StuI and probed with a DNA fragment from Rac1 intron 1. Bands corresponding to different alleles of Rac1 are indicated, conditional (c) 11 kb, knockout (k) 7 kb, and wild-type (w) 5 kb. Note that conversion of the c to the k allele is qualitatively complete after HTNC treatment. (C) Western blot analysis showing Rac1 depletion after HTNC treatment, using an antibody that recognizes all three Rac isoforms (see Supplementary Figure S1). Tubulin serves as a loading control. 1×, 5×, etc. indicate relative amount of cell lysate loaded. The genotypes of cells are indicated, k/c-k/k means Rac1k/c converted to Rac1k/k, etc. All data are shown for cells 4-5 d after HTNC application.
Quantitative Western blot analysis demonstrated that 5 d after HTNC protein treatment, there was more than 90% depletion of the endogenous Rac1 in c/c-k/k and c/k-k/k cells, when compared with untreated controls or HTNC-treated _Rac1_c/w cells (Figure 1C).
Because there are three different Rac genes in the mouse and human genomes that encode highly similar proteins, we tested the antibody used in this analysis to ensure that it would react with all three Rac protein forms. Western blot analysis of cell extracts from mammalian cells expressing recombinant GST fusions of Rac1, Rac2, and Rac3 demonstrated that the antibody was equally reactive for all three isoforms (Supplementary Figure S1).
In summary, these results demonstrate that Rac1 is the only Rac isoform expressed in these MEFs and that Rac1 depletion is efficiently accomplished by HTNC protein exposure, generating Rac1-null MEF cells from immortalized _Rac1_c/c and primary _Rac1_c/k cells.
Morphological Analysis and F-Actin Distribution of Rac1-null Cells
Rac1-null primary (k/c-k/k) and immortalized (c/c-k/k) MEFs showed striking morphological differences in comparison to untreated control cells (Figures 2, 3, 4). The majority of these cells had an elongated spindle-shaped form (Figure 2D, large arrows) that was seen only occasionally in control cells. In addition, the majority of cells had numerous tiny dynamic blebs (0.2-5 μm in diameter), as revealed by video imaging (Supplementary Videos 4 and 7). The spindle-shaped morphology was not invariable, but was enhanced under sparsely plated conditions when cells had no cell-cell contacts (Figure 2) and during cell translocation (Supplementary Videos 7 and 9). Rac1-null cells rarely had lamellipodial structures or ruffles (<5%) in contrast to control cells, but the percent of cells containing filopodia remained the same (Figure 3).
Figure 2.

Morphology of Rac1-null cells. Phase-contrast images were acquired 5 d after HTNC treatment of one immortalized line (c/c) and two primary (k/c and w/c) MEF cultures. (A, C, and E) Untreated cells; (B, D, and F) the corresponding lines after treatment. Note the elongated morphology of the majority of Rac1-null cells in B and D. (C) Arrows indicate fibroblasts with polygonal morphology. (D) Arrows indicate fibroblasts with elongated morphology, arrowheads those with triangular morphology, and small arrows those with small cell morphology.
Figure 3.

Quantitative assessment of morphology of Rac1-null cells. Primary cells (k/c and w/c) were analyzed 5 d after HTNC treatment when plated at 20% confluency; a total of 100 cells were analyzed per condition. Error bars, SEM. (A) Fraction of cells with various shapes. Normal shape indicates well-spread polygonal cells not in any of the other categories (see Figure 2). (B) Fraction of cells with various motile projections. Spontaneous motile activity was determined in 10-min time-lapse sequences at 40× magnification in media with 15% serum.
Figure 4.

F-actin distribution in Rac1-null cells. F-actin was detected with Alexa-phalloidin under normal culture conditions; results from the immortalized cell line are shown. (A and A′) Control (c/c) cells. (B and B′) Rac1-null (c/c-k/k) cells. Note presence of actin-rich peripheral ruffles in control but not Rac1-null cells and presence of stress fibers throughout the Rac1-null cells. White arrows, lateral ruffles; black arrow, F-actin arch.
To investigate the nature of the blebs in the Rac1-null cells, we used the myosin II inhibitor blebbistatin (Straight et al., 2003; Limouze et al., 2004). This inhibitor rapidly blocked the blebbing activity of these cells and promoted the formation of filopodia-like, long, thin projections (Supplementary Video 2). In contrast, in control cells, blebbistatin promoted lamellipodia formation (Supplementary Video 1). These observations indicate that the observed blebbing is generated by a myosin II-dependent mechanism.
Rac1-null cells contained abundant actin stress fibers, similar to control cells, as seen after phalloidin staining (Figure 4). However, in many control cells F-actin structures were seen forming arcs; these structures were not seen in Rac1-null cells. In contrast, in Rac1-null cells, actin bundles tended to extend all the way parallel to the cell edge, similar to areas of retraction seen in wild-type cells. Finally, in contrast to control cells, no ruffles were seen in the null cells under any conditions (Figure 4).
Wound Closure, Cell Spreading, and Focal Adhesions in the Absence of Rac1
Using DN mutants, Rac1 has been implicated in the polarized migration necessary for in vitro wound closure by a fibroblast monolayer (Nobes and Hall, 1999). We analyzed the process of wound closure by Rac1-null cells using time-lapse digital microscopy. After wounding of near confluent cells, Rac1-null cells were capable of closing the wound at just over half the rate of wild-type control cells (0.100 ± 0.002 μm/min for Rac1-null cells vs. 0.190 ± 0.003 μm/min for control cells; t test, p < 0.05, n = 6; Figure 5, A-C). In contrast to wild-type cells, Rac1-null cell migration into the wound occurred through pseudopodial-like protrusions without lamellipodia formation or ruffling (Figure 5A, Supplementary Video 3). The Rac1-null cells also appeared to remain tethered to other cells at the wound's edge (Supplementary Video 3), which may have contributed to slower wound closure rates.
Figure 5.

Wound closure by Rac1-null cells. (A and B) Time-lapse video sequences (See Supplementary Video 3) demonstrate the morphology of immortalized control (c/c; A) and Rac1-null (c/c-k/k) cells (B) during tissue culture wound closure. Note the predominant pseudopodial type of protrusive activity in the Rac1-null cells at right in contrast to the control cells at left. Arrows indicate pseudopodia-like protrusions. (C) Quantification of the speed of wound closure; data are the average of two experiments using the immortalized cell line (c/c) and four experiments using primary cells (k/c). Error bars, SEM. (D) Trajectories of individual cells at the wound edge during closure during a 12-h interval. Immortalized cell line (c/c and c/c-k/k) and primary cells (k/c and k/c-k/k). (E and F) Quantification of the directionality (persistence) and speed of individual cells at the wound edge. Persistence is calculated as the ratio of the shortest distance from the initial to the last position over the length of the trajectory (D/T). Data were obtained from two experiments using the immortalized cell line (c/c) and four experiments using primary cells (k/c). Error bars, SEM from a total of 60 cells.
To explore migratory differences that cause the reduction in wound closure rates, we performed tracking of cells at the edge of the wound. We found a significant reduction in both the persistence and speed of the Rac1-null cells (Figure 5, D-F). Rac1-null cells have an average speed during wound closure of 0.07 ± 0.004 μm/min, whereas their wild-type counterparts move at 0.16 ± 0.022 μm/min (t test, p < 0.01, n = 60). Persistence, as defined by the ratio of D/T (see Material and Methods), was slightly reduced in Rac1-null cells (0.48 ± 0.04) in comparison to control cells (0.64 ± 0.03, t test, p < 0.01, n = 60). These results suggest that a combination of reduced speed and impaired directionality are the cause of the reduction of wound closure rates, but a defect in release from other cells may also contribute.
In addition, we examined both cell attachment and spreading after trypsinization. Attachment of Rac1-null cells to fibronectin was similar in Rac1-null and control cells (L.Vidali, unpublished observations). In both cases attachment was fast (<10 min) and independent of cell spreading. Once attached, wild-type cells showed a rapid spreading process that involved a combination of lammelipodial expansion and spikelike protrusion (see Figure 7). This spreading process was completed in ∼45 min, occurring at an average rate of 51.5 ± 6.2 μm2/min (Figure 6). In contrast, Rac1-null cells spread in a process that involved formation of pseudopodia-like structures without ruffling activity (Figure 7). Overall the rate of spreading of Rac1-null cells was ∼43% of that of wild-type cells (22.6 ± 1.1 μm2/min), requiring 90-120 min for maximal spreading (t test, p < 0.01, n = 3; Figure 6).
Figure 7.

F-actin and vinculin distribution in Rac1-null cells during cell spreading. Immortalized Rac1-null (c/c-k/k; B, D, F, and H) and control (c/c; A, C, E, and G) cells were visualized at various time points after plating using Alexa-phalloidin to stain F-actin (pseudocolored red) and an anti-vinculin mAb (pseudocolored green). Note punctate focal adhesions stained yellow in the control cells, which are not seen in the Rac1-null cells.
Figure 6.

Delayed cell spreading by Rac1-null cells. Immortalized Rac1-null (c/c-k/k) and control (c/c) cells were trypsinized and plated on 5 μg/ml fibronectin. At the indicated time points the cells were fixed and stained with Alexa-phalloidin. Cell area was calculated using fluorescent-based thresholding in ImageJ software from n > 100 cells per time point. Results are the mean of three independent experiments. Error bars, SEM. To compare between different experiments, results are expressed as a fraction of maximum spreading.
The distribution of focal adhesions was analyzed in Rac1-null cells at different stages of spreading on fibronectin in the absence of serum. Focal adhesions were identified by immunostaining vinculin. Focal adhesions are present in the Rac1-null cells but they appeared fewer in number (Figure 7). The distribution in the Rac1-null cells is consistent with a role for focal adhesions in the process of cell spreading because they appear at the tips of the pseudopodia-like protrusions that the Rac1-null cells display during spreading (Figure 7H). However, they do not develop into classic focal adhesions that are abundant in the ventral areas of wild-type cells (compare Figure 7, G and H).
Responses to PDGF in Rac1-null Cells
We next analyzed the requirement of Rac1 for response to PDGF in fibroblasts. Wild-type MEFs respond within minutes to PDGF stimulation with the formation of prominent F-actin-rich dorsal and lateral ruffles and lamellipodial projections (Figure 8, A, B, E, and F and Supplementary Videos 4-6). In contrast, Rac1-null cells showed no dorsal ruffling or lamellipodial projections in response to PDGF treatment (Figure 8, C, D, G, and H, and Supplementary Videos 4 and 6). Only occasional cells with dorsal ruffles were seen, and these were likely cells in which conversion to the k allele had not occurred. Despite the lack of ruffling, Rac1-null cells did respond to PDGF treatment by slightly expanding their area and generating small filopodia-like projections (Figure 8H and Supplementary Videos 4 and 6).
Figure 8.

Lack of peripheral and dorsal ruffling activity and F-actin and Arp 2/3 complex localization in PDGF-stimulated Rac1-null cells. Cells were starved for 12 h and stimulated for 10 min with 20 ng/ml PDGF and stained for F-actin with Alexa-phalloidin. (A) Starved and (B) PDGF-treated immortalized control (c/c) cells. (C) Starved and (D) PDGF-treated immortalized Rac1-null cells. Note the presence of dorsal ruffles in the majority of control cells (B), whereas there is a single c/c-k/k cell in the middle of D with a dorsal ruffle, likely a cell in which recombination and loss of Rac1 failed to occur. (E and H) Arp2/3 complex was localized by staining against its p34 subunit (red). Actin was stained with Alexa-phalloidin (green). (E) Starved and (F) PDGF-treated immortalized control (c/c) cells. (G) Starved and (H) PDGF-treated immortalized Rac1-null cells (c/c-k/k). Note lack of ruffles and predominant perinuclear p34 localization in Rac1-null cells.
The localization of the Arp2/3 complex was examined in Rac1-null and control cells, in response to PDGF stimulation. In contrast to control cells, where it colocalized with membrane ruffles in response to PDGF stimulation (Figure 8F), the Arp2/3 complex remained in a cytoplasmic location in the majority of Rac1-null cells, with only faint association with the tips of pseudopodia-like projections (Figure 8H).
Despite the dramatic difference in ruffle formation, Rac1-null cells responded to PDGF with activation of PI-3-kinase and the synthesis of 3′-phosphoinositides, as indicated by the translocation of an Akt PH-domain-GFP fusion protein construct to the cell membrane in a manner indistinguishable from wild-type cells (Figure 9, A-F). In addition, the extent and kinetics of Akt activation, as assessed by phosphorylation at S473, was identical in Rac1-null and control cells (Supplementary Figure 2).
Figure 9.

PDGF-induced PIP3 generation. A plasmid encoding the PH domain of Akt fused to GFP was used to detect 3′-phosphoinositide synthesis. (A) Primary Rac1-null (k/c-k/k) cells starved for 12 h. (B) Primary Rac1-null (k/c-k/k) cells plus 20 ng/ml PDGF. (C) Primary Rac1 containing (k/c) cells starved for 12 h. (D) Primary Rac1 containing (k/c) cells plus 20 ng/ml PDGF. (B and D) Uniform GFP distribution across the plasma membrane of the cell after PDGF treatment in both control and Rac1-null cells. (E and F) Graphic representation of the GFP signal across the width of the cells (line) shown in A-B and C-D, respectively. Green signal is before PDGF addition, and red signal is after PDGF addition.
We also examined the possibility that Cdc42 activation was affected by loss of Rac1. However, Cdc42 activation was similar in Rac1-null and control cells in both the absence (GTP-Cdc42 was 5.3 ± 0.25% of the total Cdc42 for Rac1-containing cells [c/c] vs. 4.6 ± 1.02% for Rac1 depleted cells [c/c-k/k], t test, p > 0.05, n = 2) or presence of PDGF (GTP-Cdc42 was 4.3 ± 0.23% of the total Cdc42 for Rac1 containing cells [c/c] vs. 4.4 ± 0.29% for Rac1 depleted cells [c/c-k/kv], t test, p > 0.05, n = 4; Figure 10).
Figure 10.
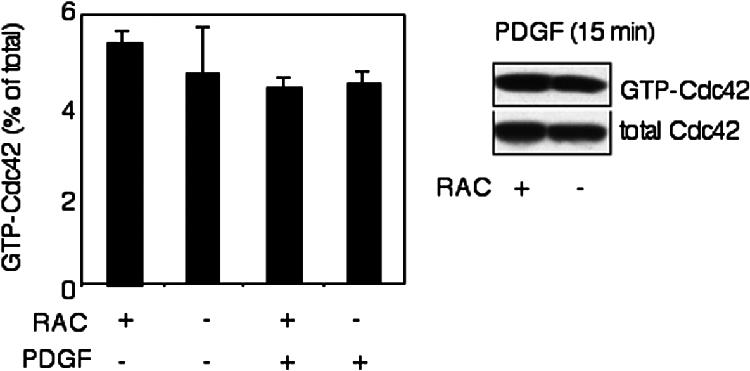
Cdc42 activity in Rac1-null cells. Cdc42 activity was determined using a GST-PAK-CRIB fusion protein to pull down GTP-bound Cdc42. Immortalized Rac1-null (c/c-k/k) and control cells (c/c) were starved for 16 h and stimulated with 20 ng/ml PDGF for 15 min. Total and GTP-bound Cdc42 were calculated from densitometry of Western blots. The experiment was performed in duplicate.
Next we used time-lapse microscopy to examine the motility of cells crawling on fibronectin-coated surfaces in a PDGF-dependent manner (chemokinesis). In sparsely plated cultures of cells lacking Rac1, protrusion occurred through the development of elongated fingerlike projections resembling pseudopodia (Supplementary Videos 7 and 9). In contrast, wild-type cells mainly translocated through lamellipodia formation and ruffling activity as is typically seen in MEF cultures (Supplementary Videos 7-9). The Rac1-null cells also seemed to have difficulty releasing from the substratum, as many spindle-shaped cells rocked back and forth without net movement. Correspondingly, the unstimulated average velocity of primary cells was reduced from 0.18 ± 0.01 μm/min (k/c) to 0.13 ± 0.01 μm/min (k/c-k/k; t test, p < 0.01, n = 70 cells), and the average velocity of the immortalized cells was also reduced from 0.16 ± 0.01 μm/min (c/c) to 0.14 ± 0.01 μm/min (c/c-k/k; _t_ test, p < 0.05, n = 70 cells), whereas the average velocity of the control primary cells (0.19 ± 0.01 μm/min [w/c]) was not affected by HTNC treatment (0.20 ± 0.01 μm/min [w/c-w/k]; _t_ test, p > 0.05, n = 70 cells; Figure 11A).
Figure 11.

Chemokinesis and chemotaxis of Rac1-null cells. (A) HTNC-treated cells with various genotypes were plated on 2 μg/ml fibronectin and analyzed for random motility for 6 h in the presence or absence of 20 ng/ml PDGF. Note that spontaneous and PDGF-induced motility is decreased by ∼25% in Rac1-null cells, but the relative increase is similar in both genotypes. A total of 70 cells were tracked for each condition. Error bars, the SEM. (B) Immortalized cells were plated on a modified Boyden chamber (8-μm pores). PDGF was added at the indicated concentration in the bottom chamber. Cells were incubated for 4 h at 37°C. The total number of cells attached to the membrane and the number of cells passing through the membrane were determined by fluorescent DNA staining. Note that Rac1-null cells (c/c-k/k) traverse the membrane about as well as control cells (c/c). The results are the mean of three independent experiments done in duplicate. Error bars, SEM. (C) Rac1-null cells (c/c-k/k) generated from the immortalized cell line (c/c) were transfected with an expression vector expressing myc-tagged dominant negative Rac1 (N17). The percent of myc-positive cells attached to the membrane (total) and the percent of myc-positive cells passing through the membrane (chemotactic) are shown. The results are the mean of four independent experiments. Error bars, SEM.
The average velocity of Rac1-null cells in the presence of PDGF was also reduced in comparison to controls. Primary cells were reduced from 0.40 ± 0.03 μm/min (k/c) to 0.28 ± 0.03 μm/min (k/c-k/k; t test, p < 0.01, n = 70 cells), whereas immortalized cells went from 0.30 ± 0.02 μm/min (c/c) to 0.21 ± 0.01 μm/min (c/c-kk; _t_ test, p < 0.01, n = 70 cells). There was no significant difference in control primary cells due to HTNC treatment (0.38 ± 0.02 μm/min [w/c] vs. 0.39 ± 0.01 μm/min [w/c-w/k], _t_ test, p > 0.05, n = 70 cells). However, the increase in translocation in response to PDGF was similar in all sets of cells, though somewhat reduced in the c/c-k/k cells when compared with the c/c cells (Figure 11A).
Chemotaxis toward PDGF was analyzed with a modified Boyden chamber system, using 8-μm pores and a 4-h incubation. There were small, statistically insignificant differences between Rac1-null and control cells at lower doses of PDGF in the rate of membrane translocation (at 5 ng/ml PDGF, 16 ± 4% of the total Rac1-containing cells [c/c] vs. 10 ± 2% of the total Rac1-null cells [c/c-k/k], t test, p > 0.05, n = 6). These differences disappeared at higher doses of PDGF (at 20 ng/ml PDGF, 32 ± 3% of the total Rac1-containing cells [c/c] vs. 36 ± 2% of the total Rac1-null cells [c/c-k/k], t test, p > 0.05, n = 6; Figure 11B). This assay was measuring true chemotaxis, as addition of PDGF to both upper and lower chambers did not result in a significant number of cells crossing the membrane (unpublished data). Because these observations contrast with results seen upon expression of a dominant negative Rac1 (DN Rac1) construct in fibroblasts (Anand-Apte et al., 1997), we examined the effect of expressing DN Rac1 in the Rac1-null fibroblasts. We observed a significant reduction in chemotaxis toward PDGF of the DN expressing Rac1-null cells. 6.2 ± 0.38% of the Rac1-null cells expressed the DN construct, but only 1.4 ± 0.33% of cells that transversed the membrane expressed the DN construct (t test, p < 0.01, n = 4; Figure 11C).
Cell Proliferation and Cell Cycle Analysis of Rac1-null Cells
Rac1-null cells demonstrated a dramatic decrease in the rate of cell proliferation, although they continued to grow at a very slow rate without apparent cell death (Figure 12A). We did not detect any evidence of apoptosis using TUNEL or annexin V staining during 2 wk of culture after HTNC peptide treatment (L.Vidali, unpublished observations). This lack of proliferation was not a side effect of treatment with the peptide, because Rac1c/w lines showed no change in their rate of proliferation after HTNC treatment (Figure 12A).
Figure 12.

Reduced growth of Rac1-null cells. (A) Cell growth curve. All cells were plated at a density of 20,000 cells/well and counted after 2-7 d. Immortalized (c/c and c/c-k/k) and primary cells (k/c, k/c-k/k, c/c, and w/c-w/k) were analyzed. All measurements were performed in triplicate. Error bars, SEM. (B) Cell cycle phase analysis of immortalized cells (c/c and c/c-k/k), performed by PI DNA staining with FACS analysis, in cells grown in constant 15% serum; results are from three independent experiments done in quadruplicate. Error bars, SEM. (C) S phase percent was measured by incorporation of BrdU in constant 15% serum with 1 h BrdU exposure. Results are from three independent experiments. Error bars, SEM. Note that there is a marked decrease in S phase percent in the c/k-k/k cells in each of B and C. (D) Stimulation of DNA synthesis by serum or PDGF. After serum starvation for 16 h, BrdU and either 15% serum or 20 ng/ml PDGF were added for 16 h. Results are from three independent experiments. Error bars, SEM.
We characterized the defect in proliferation of the Rac1-null cells in several ways. Cell cycle analysis in normal growth conditions (constant serum) showed that Rac1-null cells (c/c-k/k) were shifted to the G1 phase (68.3 ± 1.0%) with a reduction of cells in S phase (11.1 ± 0.6%), in comparison to control lines (c/c; G1 50.5 ± 2.3%; S 30.0 ± 2.3%; t test, both G1 and S phase p < 0.01, n = 12; Figure 12B). This block in DNA synthesis was confirmed by use of BrdU labeling (34.1 ± 4.1% for Rac1 control cells [c/c] vs. 5.9 ± 1.8% for Rac1-null cells [c/c-k/k], t test, p < 0.01, n = 3; Figure 12C).
The G1 to S phase transition was not completely blocked in Rac1-null cells, as a fraction were able to respond to serum (20.7 ± 4.0%) or PDGF (10.5 ± 2.9%) stimulation after serum deprivation for 16 h. However, this response was reduced to ∼42% of the DNA incorporation seen in control cell lines in response to serum (48.5 ± 8.5%) and PDGF (25.0 ± 4.5%; t test, both serum and PDGF p < 0.05, n = 3; Figure 12D).
DISCUSSION
We have analyzed the phenotype of Rac1-null MEFs, generated in vitro in a highly efficient and specific manner, to better define the function of Rac1 in mammalian cells. In several respects we found that the effects of loss of Rac1 were similar to those of expression of DN mutants of Rac1, in particular with respect to lamellipodia formation and ruffling behavior (Ridley et al., 1992), as well as proliferation (Westwick et al., 1997; Joyce et al., 1999). In contrast, we found that several other aspects of motility in these cells, including chemotaxis (Anand-Apte et al., 1997), cell spreading on fibronectin (Clark et al., 1998; Price et al., 1998; Berrier et al., 2000), and wound closure (Nobes and Hall, 1999; Fenteany et al., 2000), were less dependent on Rac1 than previously thought based on analyses using DN mutants.
Two issues are critical for the interpretation of our data. First, we confirm that Rac1 represents the only Rac isoform present in the MEFs under study here (Supplementary Figure S1). Second, we demonstrate that the aggregate level of Rac1 expression in the Rac1-null cells is <10% of normal (Figure 1C). In addition, given that recombination induced by cre in the Rac1c allele will generate a complete null allele (Glogauer et al., 2003; Gu et al., 2003), we expect that in the vast majority of the HTNC-treated cells, there is no Rac1 expression at all. Any residual Rac1 expression in the population of cells as a whole is contributed by rare (<5%) cells in which recombination has not occurred. Such rare cells in both c/c-k/k and c/k-k/k populations with retained Rac1 expression were observed and had a phenotype similar to untreated control cells.
Our results match well with those from expression of Rac DN mutants with respect to the absolute requirement of Rac1 for the formation of lamellipodia and dorsal and lateral ruffles (Ridley et al., 1992). The PDGF-induced formation of dorsal ruffles is a WAVE1-dependent process, whereas the formation of lateral ruffles and lamellipodia is WAVE2-dependent (Suetsugu et al., 2003; Yan et al., 2003). Our results are consistent with a model in which Rac1 regulates both WAVEs, which are likely to be further regulated by additional components of the WAVE complex (Eden et al., 2002; Innocenti et al., 2004; Steffen et al., 2004). Our results indicate that no other GTPase can substitute for Rac1 in the activation of the WAVE complex in response to PDGF stimulation (Chen et al., 2000b; Eden et al., 2002).
Surprisingly, despite the lack of lamellipodia, Rac1-null cells are able to migrate both spontaneously and in response to a chemotactic gradient. This indicates that lamellipodia are not required for cell translocation or chemotaxis. Here we want to emphasize that we are using a definition of lamellipodia that includes both of the subdomains that have recently been designated lamella and lamellipodium (Ponti et al., 2004; Vallotton et al., 2004). The migration of the Rac1-null cells appears different from cells injected with tropomyosin, because in those cells only the most distal part (lamellipodium) of the protruding structure is missing (Gupton et al., 2005). In the Rac1-null cells there is a complete absence of both structures: lamella and lamellipodium.
The capacity of the Rac1-null cells to move by a pseudopodial-like process without lamellipodia or ruffling activity is strikingly similar to observations we have made previously in dermal fibroblasts from gelsolin null mice (Azuma et al., 1998). Those gelsolin null fibroblasts demonstrated a lack of normal ruffling activity, but with normal recruitment of Rac to the cell membrane, suggesting that gelsolin was a downstream effector of Rac for motility. Although motility in other cell types that are gelsolin null is relatively normal (Witke et al., 1995), this observation confirms that translational motility can occur in cells in the absence of normal Rac function, through a mechanism that involves the generation of blunt filopodia or pseudopodia.
Interestingly, the polymerization/depolymerization of actin in the lamella involves myosin contraction (Ponti et al., 2004), and we observed that the inhibition of myosin II causes lamella-lamellipodium formation in wild-type, but not Rac1-null MEFs. These observations suggest that an opposing balance between myosin II and Rac1 activity regulates lamella-lamellipodium production. In the absence of Rac1, myosin II promotes bleb formation, whereas loss of both proteins leads to formation of pseudopodia-like structures as a result of protrusive activity. In the light of these and previous observations (Ponti et al., 2004), it will be important to reevaluate the participation of the lamella-lamellipodium in cell motility (Small et al., 2002).
What are the signaling intermediates and mechanism through which Rac1-null cells are able to migrate? It is possible that Cdc42 mediates some of the dynamic actin filament changes that are necessary for migration, particularly chemotaxis (Allen et al., 1998; Chen et al., 2000a; Pankov et al., 2005). However, a recent report on the morphology and migratory behavior of Cdc42 null cells did not identify major motility defects, though the cells became elongated and had decreased Rac1 activation (Czuchra et al., 2005). The Rac1 activity was further reduced in the Cdc42 null cells by expressing DN Cdc42, which led to a phenotype similar to what we have seen here, with cell elongation, increased membrane blebbing, and reduced wound closure rates. We interpret these findings as indicating that loss of Cdc42 has some effect on Rac1 activation, leading to a relatively mild phenotype, whereas complete loss of both proteins should have more severe consequences. In the Rac1-null cells studied here, we did not see an increase in the level of Cdc42 activation, consistent with the prevailing model that Rac lies downstream of Cdc42 in activation and signaling (Nobes and Hall, 1995).
While this work was in progress, studies were reported in which lower levels of total and activated Rac1 were achieved through three different approaches including RNA interference, in three types of cells including human fibroblasts (Pankov et al., 2005). The reduction in Rac levels was more moderate than achieved here, 50-80%. The cells displayed a reduction in random as opposed to directionally persistent motility, with an increase in D/T ratio from 0.25-0.40 to 0.55-0.75, as assessed by time-lapse videomicroscopy, along with a modest (0-25%) reduction in velocity (Pankov et al., 2005). In contrast, under our conditions, there was complete loss of Rac1 in nearly all cells, but without a significant change of persistence in sparsely plated cultures (L.Vidali, unpublished observations) and a marked reduction in speed (13-30%; Figure 11A). Furthermore, in the wound closure assay there was a reduction in persistence as assessed by the D/T ratio, from 0.64 to 0.48 (Figure 5E), and a much greater reduction in velocity, by 57%. (Figure 5F). These results suggest that at limiting concentrations, Rac may be targeted to the leading lamella, aborting formation of secondary lamella, leading to increased persistence (Pankov et al., 2005); however, when Rac1 is absent there is no leading lamella, and motility proceeds by an alternative mechanism.
We found that expression of a DN Rac1 construct markedly reduced the PDGF-directed chemotaxis of the Rac1-null cells we generated (Figure 11C). Because Cdc42 is not globally activated to a detectible extent in Rac1-null cells in response to PDGF (Figure 10), this suggests that there is another GTPase target of the DN-Rac expression, which plays an important role in this effect. However, despite the lack of a net increase in Cdc42-GTP levels in response to PDGF, it is still possible that in the microdomain near the protrusive region in these cells, Cdc42 activation plays an important role.
The capacity of Rac1-null cells to form filopodia and other protrusive structures without lamellipodia suggests that additional consideration be given to some models of filopodia formation in which filopodia are derived from lamellipodial structures (Svitkina et al., 2003; Vignjevic et al., 2003). Lamellipodia are not present in the Rac1-null cells, which nevertheless are still able to form filopodia. How these structures organize in the absence of visible lamellipodia will require additional investigation.
It is interesting that cell spreading is only partially impaired in Rac1-null cells, a result similar to that observed with DN mutants (Clark et al., 1998; Price et al., 1998). This suggests that both lamellipodial and pseudopodial mechanisms are involved in cell spreading.
Rac1-null macrophages, also generated using a conditional allele, have several features in common with the Rac1-null MEFs studied here (Wells et al., 2004). Rac1-null macrophages are elongated and do not ruffle; nevertheless they are able to migrate. However, Rac2 is expressed at significant levels in macrophages and may contribute to some aspects of their motile function. Neutrophils lacking Rac1 have reduced chemotaxis, but a much more significant defect is seen when both Rac1 and Rac2 are eliminated from neutrophils (Sun et al., 2004). This neutrophil motility defect in the absence of both Rac1 and Rac2 is much stronger than what is seen in the absence of Rac in MEFs, suggesting the critical importance of lamellipodia formation in neutrophil motility.
A striking phenotype of the Rac1-null MEFs was their reduced proliferation. Cell cycle G1 block was present in the majority of cells, although cell cycle progression and DNA synthesis occurred to a limited extent in response to both serum and PDGF. These observations are consistent with results using rac DN mutants (Olson et al., 1995), in which cell cycle block appears due to an absence of cyclin D synthesis (Westwick et al., 1997; Joyce et al., 1999). Our results in MEFs contrast with those in Rac1-null macrophages where a defect in proliferation was not detected (Wells et al., 2004), suggesting that Rac2 may fulfill this function in macrophages.
Supplementary Material
[Supplemental Material]
Acknowledgments
We thank members of the Kwiatkowski and Hartwig labs, Dr. Phil Allen, and Dr. Tom Stossel for discussions and general assistance, particularly Dr. Allen for the use of his microscope. We also thank Dr. Frank Edenhofer for the HTNC construct, Dr. Stuart Orkin and Dr. Xiaohong Mao for the cre reporter mouse strain, and Dr. Nora Heisterkam for Rac-GST fusion constructs. We also thank Jan Eric Ahlfors and New World Laboratories for the use of their KineticScan Cellomics microscope.
Abbreviations used: HTNC, histidine-TAT-nuclear localization-cre fusion peptide; MEF, mouse embryonic fibroblast; PDGF, platelet-derived growth factor; PI, propidium iodide.
References
- Allen, W. E., Zicha, D., Ridley, A. J., and Jones, G. E. (1998). A role for Cdc42 in macrophage chemotaxis. J. Cell Biol. 141, 1147-1157. [DOI] [PMC free article] [PubMed] [Google Scholar]
- Anand-Apte, B., Zetter, B. R., Viswanathan, A., Qiu, R. G., Chen, J., Ruggieri, R., and Symons, M. (1997). PDGF and fibronectin-stimulated migration are differentially regulated by the Rac and extracellular signal-regulated kinase pathways. J. Biol. Chem. 272, 30688-30692. [DOI] [PubMed] [Google Scholar]
- Azuma, T., Witke, W., Stossel, T. P., Hartwig, J. H., and Kwiatkowski, D. J. (1998). Gelsolin is a downstream effector of rac for fibroblast motility. EMBO J. 17, 1362-1370. [DOI] [PMC free article] [PubMed] [Google Scholar]
- Banyard, J., Anand-Apte, B., Symons, M., and Zetter, B. R. (2000). Motility and invasion are differentially modulated by Rho family GTPases. Oncogene 19, 580-591. [DOI] [PubMed] [Google Scholar]
- Berrier, A. L., Mastrangelo, A. M., Downward, J., Ginsberg, M., and LaFlamme, S. E. (2000). Activated R-ras, Rac1, PI 3-kinase and PKCepsilon can each restore cell spreading inhibited by isolated integrin beta1 cytoplasmic domains. J. Cell Biol. 151, 1549-1560. [DOI] [PMC free article] [PubMed] [Google Scholar]
- Chen, F. et al. (2000a). Cdc42 is required for PIP(2)-induced actin polymerization and early development but not for cell viability. Curr. Biol. 10, 758-765. [DOI] [PubMed] [Google Scholar]
- Chen, M., She, H., Kim, A., Woodley, D. T., and Li, W. (2000b). Nckbeta adapter regulates actin polymerization in NIH 3T3 fibroblasts in response to PDGF bb. Mol. Cell. Biol. 20, 7867-7880.11027258 [Google Scholar]
- Clark, E. A., King, W. G., Brugge, J. S., Symons, M., and Hynes, R. O. (1998). Integrin-mediated signals regulated by members of the rho family of GTPases. J. Cell Biol. 142, 573-586. [DOI] [PMC free article] [PubMed] [Google Scholar]
- Crissman, H. A., and Steinkamp, J. A. (1973). Rapid, simultaneous measurement of DNA, protein, and cell volume in single cells from large mammalian cell populations. J. Cell Biol. 59, 766-771. [DOI] [PMC free article] [PubMed] [Google Scholar]
- Czuchra, A., Wu, X., Meyer, H., van Hengel, J., Schroeder, T., Geffers, R., Rottner, K., and Brakebusch, C. (2005). Cdc42 is not essential for filopodium formation, directed migration, cell polarization, and mitosis in fibroblastoid cells. Mol. Biol. Cell 16, 4473-4484. [DOI] [PMC free article] [PubMed] [Google Scholar]
- Didsbury, J., Weber, R. F., Bokoch, G. M., Evans, T., and Snyderman, R. (1989). rac, a novel ras-related family of proteins that are botulinum toxin substrates. J. Biol. Chem. 264, 16378-16382. [PubMed] [Google Scholar]
- Dolbeare, F., Gratzner, H., Pallavicini, M. G., and Gray, J. W. (1983). Flow cytometric measurement of total DNA content and incorporated bromodeoxyuridine. Proc. Natl. Acad. Sci. USA 80, 5573-5577. [DOI] [PMC free article] [PubMed] [Google Scholar]
- Eden, S., Rohatgi, R., Podtelejnikov, A. V., Mann, M., and Kirschner, M. W. (2002). Mechanism of regulation of WAVE1-induced actin nucleation by Rac1 and Nck. Nature 418, 790-793. [DOI] [PubMed] [Google Scholar]
- Etienne-Manneville, S., and Hall, A. (2002). Rho GTPases in cell biology. Nature. 420, 629-635. [DOI] [PubMed] [Google Scholar]
- Feig, L. A. (1999). Tools of the trade: use of dominant-inhibitory mutants of Ras-family GTPases. Nat. Cell Biol. 1, E25-E27. [DOI] [PubMed] [Google Scholar]
- Fenteany, G., Janmey, P. A., and Stossel, T. P. (2000). Signaling pathways and cell mechanics involved in wound closure by epithelial cell sheets. Curr. Biol. 10, 831-838. [DOI] [PubMed] [Google Scholar]
- Glogauer, M., Marchal, C. C., Zhu, F., Worku, A., Clausen, B. E., Foerster, I., Marks, P., Downey, G. P., Dinauer, M., and Kwiatkowski, D. J. (2003). Rac1 deletion in mouse neutrophils has selective effects on neutrophil functions. J. Immunol. 170, 5652-5657. [DOI] [PubMed] [Google Scholar]
- Gu, Y. et al. (2003). Hematopoietic cell regulation by Rac1 and Rac2 guanosine triphosphatases. Science 302, 445-449. [DOI] [PubMed] [Google Scholar]
- Guo, X., Stafford, L. J., Bryan, B., Xia, C., Ma, W., Wu, X., Liu, D., Songyang, Z., and Liu, M. (2003). A Rac/Cdc42-specific exchange factor, GEFT, induces cell proliferation, transformation, and migration. J. Biol. Chem. 278, 13207-13215. [DOI] [PubMed] [Google Scholar]
- Gupton, S. L. et al. (2005). Cell migration without a lamellipodium: translation of actin dynamics into cell movement mediated by tropomyosin. J. Cell Biol. 168, 619-631. [DOI] [PMC free article] [PubMed] [Google Scholar]
- Haataja, L., Groffen, J., and Heisterkamp, N. (1997). Characterization of RAC3, a novel member of the Rho family. J. Biol. Chem. 272, 20384-20388. [DOI] [PubMed] [Google Scholar]
- Hiraoka, K. et al. (1992.) Both stimulatory and inhibitory GDP/GTP exchange proteins, smg GDS and rho GDI, are active on multiple small GTP-binding proteins. Biochem. Biophys. Res. Commun. 182, 921-930. [DOI] [PubMed] [Google Scholar]
- Innocenti, M., Zucconi, A., Disanza, A., Frittoli, E., Areces, L. B., Steffen, A., Stradal, T. E., Di Fiore, P. P., Carlier, M. F., and Scita, G. (2004). Abi1 is essential for the formation and activation of a WAVE2 signalling complex. Nat. Cell Biol. 6, 319-327. [DOI] [PubMed] [Google Scholar]
- Joyce, D. et al. (1999). Integration of Rac-dependent regulation of cyclin D1 transcription through a nuclear factor-kappaB-dependent pathway. J. Biol. Chem. 274, 25245-25249. [DOI] [PubMed] [Google Scholar]
- Limouze, J., Straight, A. F., Mitchison, T., and Sellers, J. R. (2004). Specificity of blebbistatin, an inhibitor of myosin II. J. Muscle Res. Cell Motil. 25, 337-341. [DOI] [PubMed] [Google Scholar]
- Manser, E. J. (2002). The GTPase cycle. How dominant inhibitory mutants block the biological functions of small GTPases. Methods Mol. Biol. 189, 3-11. [DOI] [PubMed] [Google Scholar]
- Mao, X., Fujiwara, Y., Chapdelaine, A., Yang, H., and Orkin, S. H. (2001). Activation of EGFP expression by Cre-mediated excision in a new ROSA26 reporter mouse strain. Blood 97, 324-326. [DOI] [PubMed] [Google Scholar]
- Nobes, C. D., and Hall, A. (1995). Rho, rac, and cdc42 GTPases regulate the assembly of multimolecular focal complexes associated with actin stress fibers, lamellipodia, and filopodia. Cell 81, 53-62. [DOI] [PubMed] [Google Scholar]
- Nobes, C. D., and Hall, A. (1999). Rho GTPases control polarity, protrusion, and adhesion during cell movement. J. Cell Biol. 144, 1235-1244. [DOI] [PMC free article] [PubMed] [Google Scholar]
- Olson, M. F., Ashworth, A., and Hall, A. (1995). An essential role for Rho, Rac, and Cdc42 GTPases in cell cycle progression through G1. Science 269, 1270-1272. [DOI] [PubMed] [Google Scholar]
- Pankov, R., Endo, Y., Even-Ram, S., Araki, M., Clark, K., Cukierman, E., Matsumoto, K., and Yamada, K. M. (2005). A Rac switch regulates random versus directionally persistent cell migration. J. Cell Biol. 170, 793-802. [DOI] [PMC free article] [PubMed] [Google Scholar]
- Peitz, M., Pfannkuche, K., Rajewsky, K., and Edenhofer, F. (2002). Ability of the hydrophobic FGF and basic TAT peptides to promote cellular uptake of recombinant Cre recombinase: a tool for efficient genetic engineering of mammalian genomes. Proc. Natl. Acad. Sci. USA 99, 4489-4494. [DOI] [PMC free article] [PubMed] [Google Scholar]
- Ponti, A., Machacek, M., Gupton, S. L., Waterman-Storer, C. M., and Danuser, G. (2004). Two distinct actin networks drive the protrusion of migrating cells. Science 305, 1782-1786. [DOI] [PubMed] [Google Scholar]
- Price, L. S., Leng, J., Schwartz, M. A., and Bokoch, G. M. (1998). Activation of Rac and Cdc42 by integrins mediates cell spreading. Mol. Biol. Cell 9, 1863-1871. [DOI] [PMC free article] [PubMed] [Google Scholar]
- Qiu, R. G., Chen, J., Kirn, D., McCormick, F., and Symons, M. (1995). An essential role for Rac in Ras transformation. Nature 374, 457-459. [DOI] [PubMed] [Google Scholar]
- Ridley, A. J. (2001). Rho GTPases and cell migration. J. Cell Sci. 114, 2713-2722. [DOI] [PubMed] [Google Scholar]
- Ridley, A. J., Paterson, H. F., Johnston, C. L., Diekmann, D., and Hall, A. (1992). The small GTP-binding protein rac regulates growth factor-induced membrane ruffling. Cell 70, 401-410. [DOI] [PubMed] [Google Scholar]
- Sander, E. E., van Delft, S., ten Klooster, J. P., Reid, T., van der Kammen, R. A., Michiels, F., and Collard, J. G. (1998). Matrix-dependent Tiam1/Rac signaling in epithelial cells promotes either cell-cell adhesion or cell migration and is regulated by phosphatidylinositol 3-kinase. J. Cell Biol. 143, 1385-1398. [DOI] [PMC free article] [PubMed] [Google Scholar]
- Schmidt, A., and Hall, A. (2002). Guanine nucleotide exchange factors for Rho GTPases: turning on the switch. Genes Dev. 16, 1587-1609. [DOI] [PubMed] [Google Scholar]
- Shirsat, N. V., Pignolo, R. J., Kreider, B. L., and Rovera, G. (1990). A member of the ras gene superfamily is expressed specifically in T, B and myeloid hemopoietic cells. Oncogene 5, 769-772. [PubMed] [Google Scholar]
- Small, J. V., Stradal, T., Vignal, E., and Rottner, K. (2002). The lamellipodium: where motility begins. Trends Cell Biol. 12, 112-120. [DOI] [PubMed] [Google Scholar]
- Steffen, A., Rottner, K., Ehinger, J., Innocenti, M., Scita, G., Wehland, J., and Stradal, T. E. (2004). Sra-1 and Nap1 link Rac to actin assembly driving lamellipodia formation. EMBO J. 23, 749-759. [DOI] [PMC free article] [PubMed] [Google Scholar]
- Straight, A. F., Cheung, A., Limouze, J., Chen, I., Westwood, N. J., Sellers, J. R., and Mitchison, T. J. (2003). Dissecting temporal and spatial control of cytokinesis with a myosin II Inhibitor. Science 299, 1743-1747. [DOI] [PubMed] [Google Scholar]
- Suetsugu, S., Yamazaki, D., Kurisu, S., and Takenawa, T. (2003). Differential roles of WAVE1 and WAVE2 in dorsal and peripheral ruffle formation for fibroblast cell migration. Dev. Cell 5, 595-609. [DOI] [PubMed] [Google Scholar]
- Sugihara, K. et al. (1998). Rac1 is required for the formation of three germ layers during gastrulation. Oncogene 17, 3427-3433. [DOI] [PubMed] [Google Scholar]
- Sun, C. X., Downey, G. P., Zhu, F., Koh, A. L., Thang, H., and Glogauer, M. (2004). Rac1 is the small GTPase responsible for regulating the neutrophil chemotaxis compass. Blood 104, 3758-3765. [DOI] [PubMed] [Google Scholar]
- Svitkina, T. M., Bulanova, E. A., Chaga, O. Y., Vignjevic, D. M., Kojima, S., Vasiliev, J. M., and Borisy, G. G. (2003). Mechanism of filopodia initiation by reorganization of a dendritic network. J. Cell Biol. 160, 409-421. [DOI] [PMC free article] [PubMed] [Google Scholar]
- Todaro, G. J., and Green, H. (1963). Quantitative studies of the growth of mouse embryo cells in culture and their development into established lines. J. Cell Biol. 17, 299-313. [DOI] [PMC free article] [PubMed] [Google Scholar]
- Vallotton, P., Gupton, S. L., Waterman-Storer, C. M., and Danuser, G. (2004). Simultaneous mapping of filamentous actin flow and turnover in migrating cells by quantitative fluorescent speckle microscopy. Proc. Natl. Acad. Sci. USA 101, 9660-9665. [DOI] [PMC free article] [PubMed] [Google Scholar]
- Vignjevic, D., Yarar, D., Welch, M. D., Peloquin, J., Svitkina, T., and Borisy, G. G. (2003). Formation of filopodia-like bundles in vitro from a dendritic network. J. Cell Biol. 160, 951-962. [DOI] [PMC free article] [PubMed] [Google Scholar]
- Walmsley, M. J., Ooi, S. K., Reynolds, L. F., Smith, S. H., Ruf, S., Mathiot, A., Vanes, L., Williams, D. A., Cancro, M. P., and Tybulewicz, V. L. (2003). Critical roles for Rac1 and Rac2 GTPases in B cell development and signaling. Science 302, 459-462. [DOI] [PubMed] [Google Scholar]
- Wells, C. M., Walmsley, M., Ooi, S., Tybulewicz, V., and Ridley, A. J. (2004). Rac1-deficient macrophages exhibit defects in cell spreading and membrane ruffling but not migration. J. Cell Sci. 117, 1259-1268. [DOI] [PubMed] [Google Scholar]
- Westwick, J. K., Lambert, Q. T., Clark, G. J., Symons, M., Van Aelst, L., Pestell, R. G., and Der, C. J. (1997). Rac regulation of transformation, gene expression, and actin organization by multiple, PAK-independent pathways. Mol. Cell. Biol. 17, 1324-1335. [DOI] [PMC free article] [PubMed] [Google Scholar]
- Witke, W., Sharpe, A. H., Hartwig, J. H., Azuma, T., Stossel, T. P., and Kwiatkowski, D. J. (1995). Hemostatic, inflammatory, and fibroblast responses are blunted in mice lacking gelsolin. Cell 81, 41-51. [DOI] [PubMed] [Google Scholar]
- Yan, C. et al. (2003). WAVE2 deficiency reveals distinct roles in embryogenesis and Rac-mediated actin-based motility. EMBO J. 22, 3602-3612. [DOI] [PMC free article] [PubMed] [Google Scholar]
- Zhang, H., Cicchetti, G., Onda, H., Koon, H. B., Asrican, K., Bajraszewski, N., Vazquez, F., Carpenter, C. L., and Kwiatkowski, D. J. (2003). Loss of Tsc1/Tsc2 activates mTOR and disrupts PI3K-Akt signaling through downregulation of PDGFR. J. Clin. Invest. 112, 1223-1233. [DOI] [PMC free article] [PubMed] [Google Scholar]
Associated Data
This section collects any data citations, data availability statements, or supplementary materials included in this article.
Supplementary Materials
[Supplemental Material]