Myosin-V stepping kinetics: A molecular model for processivity (original) (raw)
Abstract
Myosin-V is a molecular motor that moves processively along its actin track. We have used a feedback-enhanced optical trap to examine the stepping kinetics of this movement. By analyzing the distribution of time periods separating discrete ≈36-nm mechanical steps, we characterize the number and duration of rate-limiting biochemical transitions preceding each such step. These data show that myosin-V is a tightly coupled motor whose cycle time is limited by ADP release. On the basis of these results, we propose a model for myosin-V processivity.
Class-V myosins, two-headed actin-based motors (1), have been implicated in several forms of organelle transport (2). The various roles of molecular motors require special kinetic adaptations (3). Unlike muscle myosin-II, which assembles in large arrays, myosin-V is a processive motor (4), meaning that one molecule can undergo multiple productive catalytic cycles and associated mechanical steps before it detaches from its track. To understand the mechanism for chemomechanical transduction, one must decipher the kinetic scheme underlying ATP turnover and movement. Presteady-state kinetic studies have helped clarify such mechanisms in many motor proteins (5). In the case of myosin-V, kinetic characterization of truncated single-headed constructs in bulk studies has contributed important insights into the myosin-V ATPase cycle (6, 7). However, to understand the mechanism for myosin-V processivity, it is essential to study the full-length double-headed dimer through the course of its movement. In the present study, we used a force feedback-enhanced laser trap to measure the stepping rate of myosin-V molecules purified from brain. This allowed us to characterize the rate-limiting transition in the turnover cycle.
Materials and Methods
Bead Preparation.
One-microliter Polystyrene beads (Ø 356 nm, Polysciences, 2.5% solid) were incubated for 15 min in 99 μl of buffer (25 mM imidazole HCl, pH 7.4/25 mM KCl/1 mM EGTA/10 mM DTT/4 mM MgCl2) containing 10 μg/ml BSA (to preblock the surface), 1 μg/ml tetramethyl rhodamine-labeled BSA, and 30 pM tissue-purified chick-brain myosin-V [purification as described in (8)]. Buffer conditions during the experiment were as in ref. 4.
Optical Trap.
Beads were optically trapped and positioned near a fluorescently labeled biotinylated actin filament immobilized onto an avidin-coated coverslip. Imaging and trap steering were as described (9–11). A feedback loop (M44 DSP-board, Innovative Integration, West Lake Village, CA) maintains a constant separation between the bead and trap centers. This distance scales with the load experienced by the molecule as it steps along the actin filament. The trap stiffness was calibrated for each trapped bead from the amplitude of the thermal diffusion. For some beads, it was also calibrated by measurement of the bead rise time in response to sudden trap displacement and by the 3-dB corner frequency in the diffusion power spectrum. The three methods gave consistent results.
Results and Discussion
Polystyrene beads, sparsely coated with myosin-V molecules, were optically trapped in a focused laser beam and positioned near a surface-immobilized actin filament (Fig. 1A). To confirm that a single molecule is sufficient to generate the movement observed, we examined the fraction of beads that bind and move processively on an actin filament as a function of myosin-V/bead stoichiometry. Observed Poisson statistics (Fig. 1B) confirm that single myosin-V molecules are sufficient to move beads (12). The experiments described here used protein-to-bead stoichiometries low enough that less than 33% of the beads were moving. Assuming a myosin-V molecule has 100 nm of reach, >95% of moving beads should be driven by only one molecule (13).
Figure 1.
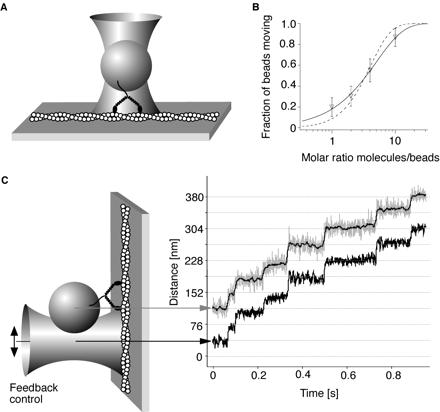
(A) Experimental scheme for single-molecule myosin-V experiments. (B) The fraction of beads moving continuously (>four steps) along actin is recorded as a function of the molar ratio of incubated beads to myosin-V molecules. Values are displayed as mean ±√[f⋅(1-f)/N]. The probability that a bead carries one or more motors is 1-exp(−λc), where c is the molar ratio of myosin-V molecules to beads during the incubation and λ is a fit parameter (12) accounting for the fact that not all myosin-V molecules incubated together with the beads will find a bead or adsorb in a functional conformation. The data can be well fit by this functional form (solid line, λ = 0.2, reduced χ2 = 0.04), showing that a single molecule is sufficient to move a bead. The data cannot be fit assuming that two or more molecules per bead are required for movement (dashed line, reduced χ2 = 0.98). When the trap was turned off during processive stepping, the bead continued to advance for >1 μm before dissociating. (C) Experimental scheme of the force feedback enhanced laser trap. A feedback loop keeps the distance between the bead center (gray curve) and the trap center (lower black curve) constant as the myosin-V molecule steps along the actin filament. Thus the myosin-V molecule is always kept under constant load. The thin black line within the gray curve is a filtered bead position signal (box filter, 15 ms).
If the motor moves the bead against a stationary optical trap, two problems complicate the experiment: compliant linkages can absorb some of the protein displacement, making the observed bead advance less than the motor (4, 14–18), and the motor can take relatively few steps before facing prohibitive resistance (4). To circumvent these problems, we used a force feedback system (16, 17), in which a digitally positioned optical trap is moved to maintain a constant separation between the trap and bead center and thus constant load Fig. 1C.
Three consecutive runs of a single myosin-V molecule along an actin filament at saturating ATP concentration (2 mM) are shown in Fig. 2A. As soon as the force reaches the preset value, the feedback is activated and the trap (lower black curve) follows the stepping bead. The bead starts from the bottom and steps through the whole feedback range (400 nm) (gray curve). Beyond the limit of the feedback range, the optical load increases, the bead stalls, the motor releases its track, and the bead falls back to the starting position where it can rebind and begin again.
Figure 2.
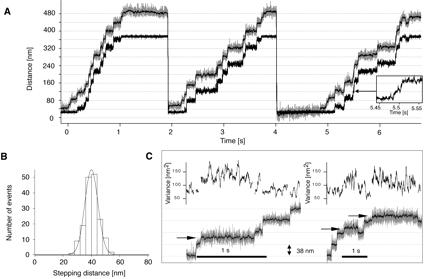
(A) Stepping record of a single myosin-V molecule at 2 mM ATP and 1 pN. The bead position is shown in gray. The superimposed black line is the filtered bead position data (15 ms box filter). The lower black trace marks the position of the trap center. (B) Histogram of step sizes measured at 2 mM ATP and 1 pN. The black line is a Gaussian fit to the data (mean = 40.2 nm, standard deviation = 6.4 nm). (C) Two sample traces for stepping at high loads (2 pN). Among the regular steps of 40 nm, steps of intermediate size (arrows) can also be observed. The increased variance (curves above each trace) indicates higher conformational flexibility/fluctuations within the system connecting the bead to the surface, through the myosin molecule and its actin connection.
We observed regular steps of 40.2 ± 6.4 nm that match the long-pitch actin helix pseudorepeat (36 nm) within calibration errors (10–15%), at all ATP and load conditions tested. Although the mean step value is consistent with that in our earlier study (4), the step distribution is much tighter here (Fig. 2B). This may in part reflect the rotational freedom of the suspended actin filament in the earlier work. Remarkably, consecutive stepping records showed dwell points at the same positions (Fig. 2A), indicating that the exposed and accessible binding sites on the surface-bound actin filament determine the myosin-V stepping path. The remaining width in the measured step size distribution (Fig. 2B) may reflect myosin binding to different accessible actin monomers just adjacent to the true 36-nm repeat monomer and still lying along the upper surface of the actin filament.
At very high loads (2 pN), we observe more frequent reverse stepping and, among the regular (≈40 nm) steps, we also observe intermediate step transitions of approximately half the regular step size (see Fig. 2C, arrows). The intermediate levels exhibit increased variance of the bead fluctuation, indicating a higher compliance in the system. Such “half steps” were always followed by another ≈20-nm step in either the forward or backward direction. We believe this reflects an off-pathway state, because such intermediate-length steps remain rare even under the high load conditions that induce them.
The stepping rate and the kinetic scheme underlying it can be characterized via the distribution of dwell times separating step transitions (19–21). In studies of the processive microtubule motor, kinesin, such analysis has been hindered by the inability to identify short intervals in records that contain thermal noise exceeding the 8-nm step distance. To circumvent this, investigators have applied fluctuation analysis to ensembles of stepping records to extract moments of the dwell-time distribution (16, 19, 22, 23). However, reverse-directed steps, transient inactive states, or futile hydrolyses can compromise this analysis. Because myosin-V steps at a slower rate and with step lengths larger relative to thermal noise, one can examine and characterize the dwell periods directly.
At saturating ATP (2 mM) and low loads (1 pN), where motor speed is unaffected by load (4), the dwell time distribution is nearly single exponential (Fig. 3A), indicating only one rate-limiting transition (12.5 ± 1 s−1) in the actin-activated myosin-V cycle. However, a single exponential distribution fits only the right-hand slope that includes dwell times >0.03 s (reduced χ2 = 0.97) but not the whole histogram (reduced χ2 = 3.9). A model incorporating an additional fast rate fits the whole histogram well (χ2 = 1.14; see Fig. 3A) and yields 12.5 ± 0.7 s−1 for the slow rate-limiting transition and 150 ± 38 s−1 for the fast rate. An alternative explanation for the dip in the histogram below 0.03 s involves missing fast events (22). We exclude this possibility because the “missing events” would produce apparent 80-nm steps at a higher frequency (9% of all steps) than we observe (1% of all steps). The second, fast rate of 150 s−1 therefore reflects a composite of rate constants other than the rate-limiting one. This demonstrates that all other chemomechanical transitions in the cycle are at least 10 times faster than the single rate-limiting transition, a finding consistent with kinetic measurements of ATP hydrolysis, phosphate release, and ATP-induced actin dissociation of expressed myosin-V monomers (6, 7).
Figure 3.
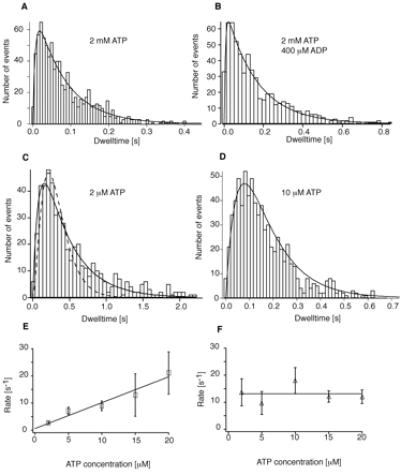
(A) Histogram of dwell times at 2 mM ATP and 1 pN. All histograms shown contain only durations of dwell periods preceding forward steps. The solid line is a fit to [k1⋅k2/(k1 − k2)](e−k2⋅t − e−k1⋅t) assuming two rates, yielding k1 = 150 s−1 and k2 = 12.5 s−1. (B) Histogram of dwell times at 2 mM ATP and 0.4 mM ADP. Fit parameters are k1 = 161 s−1 and k2 = 6.4 s−1. (C) Histogram of dwell times at 2 μM ATP. The solid line is a fit to the same equation as in A and B, yielding k1 = 2.7 s−1 and k2 = 13.8 s−1. The dashed line is a fit assuming sequential binding two ATP molecules at similar rates. (D) Histogram of dwell times at 10 μM ATP. Fit parameters are k1 = 9 s−1 and k2 = 17 s−1. (E and F) Rate constants obtained from fits to histograms recorded at varying ATP concentrations. One of the rate constants is independent of ATP concentrations and averages to 13 s−1 (E); the other rate constant is linearly dependent on ATP concentrations (F). The rate of 150 s−1 observed at saturating ATP was too fast to be detected at limiting ATP conditions (no significant change in χ2) and was therefore not included in the fits to these histograms. The slope of the ATP-dependent rate constants provides a second-order ATP binding constant of 0.9 μM−1 s−1. Error bars represent the standard deviation of the rates obtained from fits to 100 simulated histograms for each ATP concentration.
Analysis of the dwell time distribution in the presence of ADP allows us to identify ADP release as the rate-limiting transition in the chemomechanical cycle of the double-headed myosin-V molecule (Fig. 3B). In the absence of ADP, myosin-V will hydrolyze ATP, release its hydrolysis products Pi and ADP, and then bind another ATP. After product release in the presence of ADP, rebinding of ADP now competes with binding of ATP and can thus delay completion of a catalytic cycle; the motor must release the bound ADP before binding a new ATP. If ADP release is not rate limiting, the dwell time distribution should now exhibit two rates: one reflecting the rate-limiting transition and the other reflecting the binding and release of multiple ADP molecules. If, instead, ADP release is rate-limiting, the dwell time distribution should exhibit a single rate: the binding and release of multiple ADP molecules.
The distribution of dwell times recorded under 400 μM ADP and 2 mM ATP shows only one rate-limiting transition, now slowed by a factor of ≈2 to 6.4 s−1 (Fig. 2B), inconsistent with the first prediction and consistent with the hypothesis that ADP release is rate limiting.‖ ADP, the rate-limiting transition reduces to 4.5 s−1 (data not shown). These measurements demonstrate not only that ADP release is the only rate-limiting step in the cycle, but also that the ADP-binding rate is five times higher than the ATP-binding rate (described below). To identify the rate-limiting transition under saturating ATP conditions, investigators have measured various biochemical rate constants for truncated single-headed myosin-V constructs. One study (7) measured an ATPase activity of 12–15 s−1 and an ADP release rate of 12–16 s−1 and came to the conclusion that ADP release is the rate-limiting step. Two other studies (6, 24) measured a similar ADP release rate of 11.5–22 s−1 but an ATPase activity of only 3.3 s−1 and concluded that ADP release is at most partially rate limiting. Unlike those studies, our data provide direct measurement of mechanical transition times in a single stepping molecule of native tissue-purified dimeric protein. Our methods depend not on the disparate measurements of the ATP turnover rate, but rather on the distribution of the discrete steps we observe.
Under limiting ATP (2 μM, below the measured Km of 12 μM; see below), the distribution (Fig. 3C) could be fit with a fast rate of 13.7 ± 2 s−1 reflecting ADP release and a slow rate of 2.7 ± 0.25 s−1 (reduced χ2 = 1.05), presumably reflecting ATP binding. This result provides a strong indication that myosin-V uses one ATP molecule per mechanical step. If sequential or independent binding of two ATP molecules were required for a step, a scenario that would still be consistent with Michaelis–Menten dependence of mean dwell times (21, 23), the histogram should reflect three rates: two similar rates from ATP-binding events and an ATP-independent ADP release rate of around 13 s−1. The dashed line is a fit to the data with those assumptions. Such a tight distribution does not fit our data well (reduced χ2 = 2.3). We cannot exclude scenarios where two ATP molecules bind with a significantly different affinity. There is, however, no biochemical evidence for such a scenario. Other scenarios that involve two or more steps resulting from a single ATP hydrolysis (25) should lead to a broader multiexponential dwell period distribution, which we do not observe. A randomness analysis of our data computing the randomness r = (standard deviation)2/mean2 (19) as a measurement for the width of the dwell time distribution yields r = 0.9 for the histogram at 2 μM ATP. This is close to r = 0.73 predicted from the rate constants (k1 = 2.7 s−1 and k2 = 13.7 s−1) for one ATP per step. A scenario for two ATP molecules per step would lead to r = 0.35, inconsistent with our data. A scenario for two steps per ATP, one occurring fast (13 s−1) and one limited by ATP binding (2.7 s−1), leads to r = 1.7, equally inconsistent with our data.
To confirm our finding that at low ATP concentrations myosin-V stepping can be described by one ATP-dependent and one ATP-independent rate, we collected additional records at 5, 10, 15, and 20 μM ATP (Fig. 3 D–F). The histogram in Fig. 3D obtained at 10 μM ATP shows a peaked distribution of dwell times reflecting two similar rates (one for ATP binding and one for ADP release). Note the difference in shape between this histogram and that in Fig. 3B, with only one rate-limiting step. Although the average dwell times and therefore the average motor speed are similar for both histograms, the dwell-time analysis can reveal the different underlying kinetic schemes. The rates obtained from dwell-time distributions at the various ATP concentrations showed the expected behavior: the ATP-independent rate constant (Fig. 3F) averaged to 13.1 s−1, close to the 12.5 ± 0.7 s−1 obtained for ADP release at saturating ATP. From the ATP-dependent rate constants (Fig. 3E), we obtain a value of 0.9 μM−1s−1 for the second-order ATP-binding constant, in excellent agreement with recently published values (6, 7). Combining this number with our above result, that the ADP-binding constant is five times higher than ATP-binding, yields a value of 4.5 μM−1s−1 for ADP binding. This is somewhat lower than the 12.6 μM−1s−1 for MantADP binding to single-headed myosin-V (7). From the intercept of the two curves in Fig. 3 E and F, we determine a value for the _K_m of ATP hydrolysis of 12 μM.
We combine our findings of tight chemomechanical coupling and that ADP release is rate limiting with other data (6, 7): ATP promotes fast dissociation of monomers from actin, phosphate release occurs quickly after actin binding, the hydrolysis step is fast, and the ADP state has high affinity for actin. From the available data, we pose the following hand-over-hand model (Fig. 4).
Figure 4.
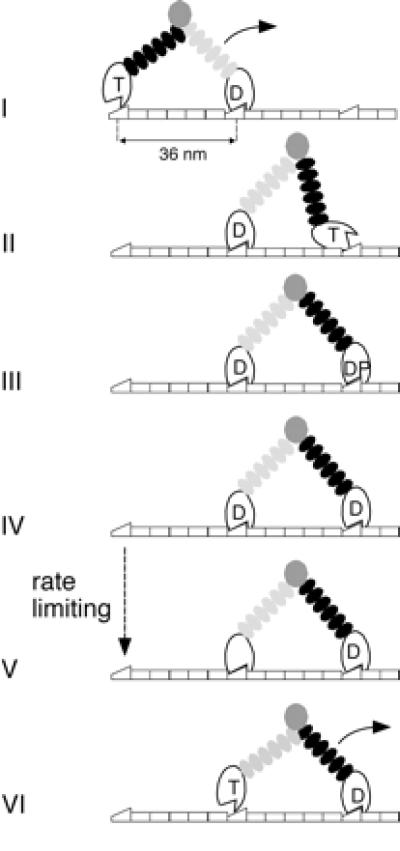
Model for myosin-V stepping (see text).
Myosin-V dwells with both heads attached to the actin filament, the leading head with ADP and the trailing head in rigor. ATP binding to the trailing head promotes its dissociation from actin (i), and forward movement of the released head then discharges intramolecular strain (i, ii); the previous leading head then becomes the trailing head. The new detached leading head quickly hydrolyzes ATP and then binds actin. Force generation follows either actin binding or phosphate release, which itself occurs either concomitant with or immediately after actin binding (iii, iv). These steps are fast relative to ADP release. At this point, one finds the molecule in its kinetically dominant state: both heads bound to actin and ADP, the leading head in a prestroke-like configuration and the trailing head in a poststroke-like configuration. The leading head is stressed against the direction of motion, and the trailing head is stressed along this direction. This asymmetry could bias ADP release to occur at the trailing head and not the leading head in state (iv). Two facts suggest that intramolecular strain does not affect the ADP release step directly. First, the rate of ADP release (13 s−1) measured for the processively moving double-headed myosin-V is similar to the ADP release rate obtained for single-headed myosin-V construct in the absence of strain (6, 7). Second, the independence of the myosin-V velocity of force at low forces (<1.5 pN) (4) suggests that the rate-limiting transition at low forces (ADP release) is not force dependent. Therefore force is likely to slow another transition in the leading head, perhaps isomerization between a state that releases ADP very slowly and the state competent to release ADP at the 13 s−1 rate. Such a transition has been recently proposed by De La Cruz et al. for thermodynamic reasons (7) and is also believed to exist in smooth muscle myosin-II and myosin-I (26, 27). Given the large size of the myosin-V molecule, stress provides an elegant way for distant heads to communicate.
A model where only one head of the dimer can create processive movement cannot be completely ruled out by our data; however, it would require unrealistically fast combined rates of ATP hydrolysis and weak-to-strong isomerization (>1,000/s) to prevent detachment and reverse steps even under loads up to 2 pN. Even assuming an additional actin-binding loop (6), it remains difficult to explain how a single head can jump across 36 nm. Moreover, single-headed myosin-V constructs do not appear to be kinetically processive (6, 7).
In summary, single-molecule stepping kinetics has identified myosin-V as a tightly coupled motor with a single rate transition limiting its cycle. Such measurements, combined with solution kinetic studies, support a model for myosin-V processivity distinct from those suggested for other processive enzymes (28).
Acknowledgments
We thank Olga Rodriguez for expert assistance in myosin-V purification and Katherine Pullen for help with the feedback control. M.R. was supported by a fellowship of the Deutsche Forschungsgemeinschaft. R.S.R. is a Helen Hay Whitney fellow. R.C. is supported by National Institutes of Health (NIH) Grant DC03299. J.A.S. is supported by NIH Grant GM33289.
Footnotes
See commentary on page 9357.
‖
Dwell time and randomness analysis used here assume that all relevant rates are nearly irreversible. Because ADP release becomes highly reversible under our high ADP solution conditions, our measured single exponential dwell time statistics could reflect a rapid reversible ADP release occurring just before a rate-limiting 13 s−1 step that, in turn, occurs before ATP binding. However, this scenario requires ADP inhibition to be independent of ATP concentration. Inconsistent with this, we find that the inhibitory effect of ADP scales with ATP concentration (data not shown).
References
- 1.Cheney R E, O'Shea M K, Heuser J E, Coelho M V, Wolenski J S, Espreafico E M, Forscher P, Larson R E, Mooseker M S. Cell. 1993;75:13–23. doi: 10.1016/S0092-8674(05)80080-7. [DOI] [PubMed] [Google Scholar]
- 2.Reck-Peterson S L, Provance D W, Jr, Mooseker M S, Mercer J A. Biochim Biophys Acta. 2000;1496:36–51. doi: 10.1016/s0167-4889(00)00007-0. [DOI] [PubMed] [Google Scholar]
- 3.Howard J. Nature (London) 1997;389:561–567. doi: 10.1038/39247. [DOI] [PubMed] [Google Scholar]
- 4.Mehta A D, Rock R S, Rief M, Spudich J A, Mooseker M S, Cheney R E. Nature (London) 1999;400:590–593. doi: 10.1038/23072. [DOI] [PubMed] [Google Scholar]
- 5.Hackney D D. Annu Rev Physiol. 1996;58:731–750. doi: 10.1146/annurev.ph.58.030196.003503. [DOI] [PubMed] [Google Scholar]
- 6.Trybus K M, Krementsova E, Freyzon Y. J Biol Chem. 1999;274:27448–27456. doi: 10.1074/jbc.274.39.27448. [DOI] [PubMed] [Google Scholar]
- 7.De La Cruz E M, Wells A L, Rosenfeld S S, Ostap E M, Sweeney H L. Proc Natl Acad Sci USA. 1999;96:13726–13731. doi: 10.1073/pnas.96.24.13726. [DOI] [PMC free article] [PubMed] [Google Scholar]
- 8.Cheney R E. Methods Enzymol. 1998;298:3–18. doi: 10.1016/s0076-6879(98)98003-x. [DOI] [PubMed] [Google Scholar]
- 9.Finer J T, Simmons R M, Spudich J A. Nature (London) 1994;368:113–119. doi: 10.1038/368113a0. [DOI] [PubMed] [Google Scholar]
- 10.Simmons R M, Finer J T, Chu S, Spudich J A. Biophys J. 1996;70:1813–1822. doi: 10.1016/S0006-3495(96)79746-1. [DOI] [PMC free article] [PubMed] [Google Scholar]
- 11.Mehta A D, Finer J T, Spudich J A. Methods Cell Biol. 1998;55:47–69. doi: 10.1016/s0091-679x(08)60402-1. [DOI] [PubMed] [Google Scholar]
- 12.Block S M, Goldstein L S, Schnapp B J. Nature (London) 1990;348:348–352. doi: 10.1038/348348a0. [DOI] [PubMed] [Google Scholar]
- 13.Svoboda K, Block S M. Cell. 1994;77:773–784. doi: 10.1016/0092-8674(94)90060-4. [DOI] [PubMed] [Google Scholar]
- 14.Svoboda K, Schmidt C F, Schnapp B J, Block S M. Nature (London) 1993;365:721–727. doi: 10.1038/365721a0. [DOI] [PubMed] [Google Scholar]
- 15.Wang M D, Schnitzer M J, Yin H, Landick R, Gelles J, Block S M. Science. 1998;282:902–907. doi: 10.1126/science.282.5390.902. [DOI] [PubMed] [Google Scholar]
- 16.Visscher K, Block S M. Methods Enzymol. 1998;298:460–489. doi: 10.1016/s0076-6879(98)98040-5. [DOI] [PubMed] [Google Scholar]
- 17.Visscher K, Schnitzer M J, Block S M. Nature (London) 1999;400:184–189. doi: 10.1038/22146. [DOI] [PubMed] [Google Scholar]
- 18.Coppin C M, Finer J T, Spudich J A, Vale R D. Proc Natl Acad Sci USA. 1996;93:1913–1917. doi: 10.1073/pnas.93.5.1913. [DOI] [PMC free article] [PubMed] [Google Scholar]
- 19.Schnitzer M J, Block S M. Cold Spring Harbor Symp Quant Biol. 1995;60:793–802. doi: 10.1101/sqb.1995.060.01.085. [DOI] [PubMed] [Google Scholar]
- 20.Kojima H, Muto E, Higuchi H, Yanagida T. Biophys J. 1997;73:2012–2022. doi: 10.1016/S0006-3495(97)78231-6. [DOI] [PMC free article] [PubMed] [Google Scholar]
- 21.Hua W, Young E C, Fleming M L, Gelles J. Nature (London) 1997;388:390–393. doi: 10.1038/41118. [DOI] [PubMed] [Google Scholar]
- 22.Svoboda K, Mitra P P, Block S M. Proc Natl Acad Sci USA. 1994;91:11782–11786. doi: 10.1073/pnas.91.25.11782. [DOI] [PMC free article] [PubMed] [Google Scholar]
- 23.Schnitzer M J, Block S M. Nature (London) 1997;388:386–390. doi: 10.1038/41111. [DOI] [PubMed] [Google Scholar]
- 24.Wang F, Chen L, Arcucci O, Harvey E V, Bowers B, Xu Y, Hammer J A, 3rd, Sellers J R. J Biol Chem. 2000;275:4329–4335. doi: 10.1074/jbc.275.6.4329. [DOI] [PubMed] [Google Scholar]
- 25.Kitamura K, Tokunaga M, Iwane A H, Yanagida T. Nature (London) 1999;397:129–134. doi: 10.1038/16403. [DOI] [PubMed] [Google Scholar]
- 26.Cremo C R, Geeves M A. Biochemistry. 1998;37:1969–1978. doi: 10.1021/bi9722406. [DOI] [PubMed] [Google Scholar]
- 27.Jontes J D, Milligan R A, Pollard T D, Ostap E M. Proc Natl Acad Sci USA. 1997;94:14332–14337. doi: 10.1073/pnas.94.26.14332. [DOI] [PMC free article] [PubMed] [Google Scholar]
- 28.Lohman T M, Thorn K, Vale R D. Cell. 1998;93:9–12. doi: 10.1016/s0092-8674(00)81139-3. [DOI] [PubMed] [Google Scholar]