Neural stem cells display extensive tropism for pathology in adult brain: Evidence from intracranial gliomas (original) (raw)
Abstract
One of the impediments to the treatment of brain tumors (e.g., gliomas) has been the degree to which they expand, infiltrate surrounding tissue, and migrate widely into normal brain, usually rendering them “elusive” to effective resection, irradiation, chemotherapy, or gene therapy. We demonstrate that neural stem cells (NSCs), when implanted into experimental intracranial gliomas in vivo in adult rodents, distribute themselves quickly and extensively throughout the tumor bed and migrate uniquely in juxtaposition to widely expanding and aggressively advancing tumor cells, while continuing to stably express a foreign gene. The NSCs “surround” the invading tumor border while “chasing down” infiltrating tumor cells. When implanted intracranially at distant sites from the tumor (e.g., into normal tissue, into the contralateral hemisphere, or into the cerebral ventricles), the donor cells migrate through normal tissue targeting the tumor cells (including human glioblastomas). When implanted outside the CNS intravascularly, NSCs will target an intracranial tumor. NSCs can deliver a therapeutically relevant molecule—cytosine deaminase—such that quantifiable reduction in tumor burden results. These data suggest the adjunctive use of inherently migratory NSCs as a delivery vehicle for targeting therapeutic genes and vectors to refractory, migratory, invasive brain tumors. More broadly, they suggest that NSC migration can be extensive, even in the adult brain and along nonstereotypical routes, if pathology (as modeled here by tumor) is present.
Keywords: gene therapy, transplantation, migration, brain tumors, vascular
Malignant brain tumors, e.g., glioblastoma multiforme, remain virtually untreatable and inevitably lethal despite extensive surgical excision and adjuvant radio- and chemotherapy (1). Their treatment resistance is related to their exceptional migratory nature and ability to insinuate themselves seamlessly and extensively into normal neural tissue, often migrating great distances from the main tumor mass. These cells are responsible for the recurrent tumor growth near the borders of the resection cavity (1). It is this behavior that has also limited their accessibility to otherwise promising gene therapeutic vectors and interventions (2). Intriguingly, one of the cardinal features of neural stem cells (NSCs) is their exceptional migratory ability (3–10). Indeed, it is their migratory capacity that has made them so useful in therapeutic paradigms demanding brainwide gene and cell replacement in various animal models of neurodegeneration, albeit usually in the newborn (8–10). We hypothesized that pathology promotes NSC migration to an extent not assumed possible based on knowledge drawn from the normal adult brain and that, therefore, an approach for targeting gene therapy to the most migratory tumor cells in the adult central nervous system (CNS) might be the use of inherently migratory NSCs to deliver therapeutic genes and/or their products.
Experimental Methods
In Vitro Migration Studies.
CNS-1 is a virulent, invasive rat-derived glioblastoma cell line. Cells engineered to express green fluorescent protein (GFP) as previously described (11, 12) were plated to 60–70% confluence onto 100-mm culture dishes around a central 5-mm metal cylinder that was sealed and, therefore, remained cell-free. The plate was incubated overnight, by which time the glioma cells had attached. A suspension of 4 × 10⁴ dissociated fibroblasts (in control dishes) or murine NSCs (in experimental dishes) were seeded into the central cylinder (i.e., no direct contact with CNS-1 cells) (Fig.1, arrowheads). A similar number of fibroblasts or NSCs, respectively, were placed into a 5-mm cylinder placed directly on top of the adherent CNS-1 monolayer and cultured as before (at extreme right edge of plates) (Fig. 1, arrows). The fibroblasts (clone TR-10) were derived from 3T3 cells infected with a retroviral vector encoding lacZ. The murine NSCs were derived from the prototypical constitutively lacZ_-expressing helper virus-free murine NSC clonal line C17.2 (8–10, 13), which, because of its well-documented ability to integrate into most CNS structures and in a number of normal and abnormal animal models, has been useful for delineating the range of therapeutic possibilities for NSCs (8–10, 13). (Although self-renewing, NSCs become contact inhibited; never grow in soft agar; are nontumorigenic in nude mice; fail to incorporate BrdUrd after 48 h in vivo; and respond to normal cues for cell cycle withdrawal, differentiation, and interaction with host cells.) The day after plating of fibroblasts and NSCs, the cylinders were removed, and the dishes were rinsed and incubated for an additional 5 days. Dishes were stained for the_lacZ gene product Escherichia coli β-galactosidase (β-gal) by 5-bromo-4-chloro-3-indolyl β-d-galactoside (X-Gal) histochemistry (8).
Figure 1.
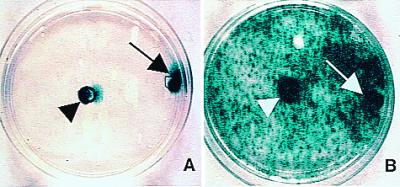
Migratory capacity of NSCs in culture. CNS-1 glioblastoma cells were plated around a central cylinder (i.e., free of CNS-1 cells). Fibroblasts (A) or NSCs (B) were seeded into the center cylinder (i.e., no direct contact with CNS-1 cells) (arrowheads) or into cylinders placed directly on top of adherent tumor cells (at the extreme right edge of plates; arrows). After removal of the cylinders and 5 additional days of incubation, there was wide distribution of blue X-Gal+ NSCs (B), compared with fibroblasts (A), which remained localized to their area of initial seeding.
Animal Studies in Vivo.
For some studies, not only were murine NSCs (C17.2) used but also some of human derivation were used (5). To establish intracranial tumors, either the CNS-1 rat glioblastoma line (11, 12) or the HGL21 human glioblastoma line (14) was implanted into the brains of adult female nude mice, or the D74 glioma line was implanted into the brains of adult female Fisher rats by using procedures previously described (15). Briefly, animals received stereotactically guided injections over 3–5 min into the forebrain (2 mm lateral and 1 mm anterior to bregma; depth 2–4 mm from dura) of tumor cells (of a number specified below) suspended in 1 μl of PBS. Animals receiving a second implant at a later date of NSCs or fibroblasts [suspended in PBS at 2–4 × 10⁴ cells per μl as detailed elsewhere (8–10,13)] were injected stereotactically with cells in a quantity and location to yield the various paradigms described below. On the days specified below, the brains were processed as detailed below (e.g., for β-gal, GFP, BrdUrd, human markers, and/or cell type-specific antigen expression). CD-1 mice, when used, received daily cyclosporin injections (10 μg/g).
Specific Protocols for in Vivo Experiments.
NSC implantation directly into tumor bed (Fig.2, Paradigm 1).
Figure 2.
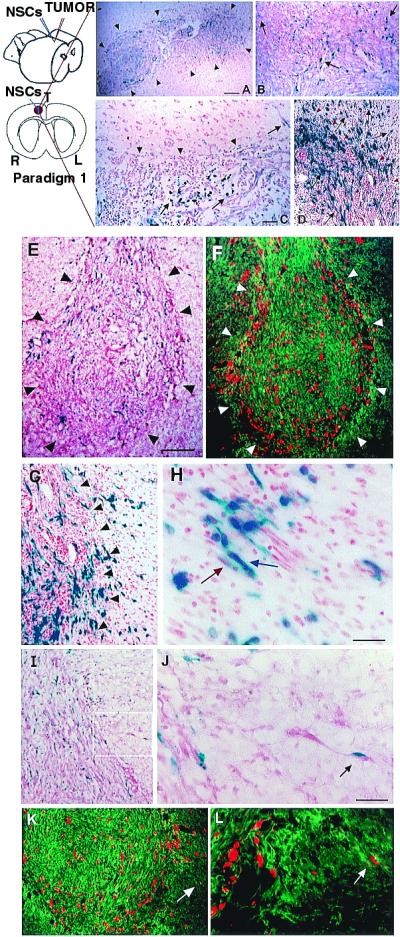
NSCs migrate extensively throughout a brain tumor mass_in vivo_ and “trail” advancing tumor cells. Paradigm 1 is illustrated schematically. Section of brain under low (A) and high (B) power from an adult rat killed 48 h after NSC injection into an established D74 glioma, processed with X-Gal to detect blue-staining β-gal-producing NSCs and counterstained with neutral red to show dark red tumor cells; arrowheads demarcate approximate edges of the tumor mass where it interfaces with normal tissue. Donor X-Gal+ blue NSCs (arrows) can be seen extensively distributed throughout the mass, interspersed among the red tumor cells. (C) Tumor, 10 days after NSC injection, illustrating that, although NSCs (arrows) have infiltrated the mass, they largely stop at the junction between tumor and normal tissue (arrowheads) except where a tumor cell (dark red, elongated) is entering normal tissue; then NSCs appear to “follow” the invading tumor cell into surrounding tissue (upper right arrow). This phenomenon becomes more dramatic when examining NSC behavior in a more virulent and aggressively invasive tumor, the CNS-1 glioblastoma in the adult nude mouse, pictured in D. This section illustrates extensive migration and distribution of blue NSCs (arrows) throughout the infiltrating glioblastoma up to and along the infiltrating tumor edge (red arrowheads) and into surrounding tissue in juxtaposition to many dark red+ tumor cells invading normal tissue. The “tracking” of individual glioblastoma cells is examined in greater detail in E–L, where CNS-1 cells have been labeled ex vivo by transduction with GFP cDNA. (E and F) Sister sections showing a low power view of transgene-expressing NSCs distributed throughout the main tumor mass to the tumor edge (outlined by arrowheads). Sections were either costained with X-Gal (NSCs, blue) and neutral red (tumor cells, dark red and elongated) (E) or processed for double immunofluorescence using an anti-β-gal antibody (NSCs, red) and an FITC-conjugated anti-GFP antibody (glioblastoma cells, green) (F). Low (G) and high (H) power views of tumor edge (arrowheads) with blue NSCs (blue arrow) in immediate proximity to and intermixed with an invading tumor “island” (dark red spindle-shaped cells) (red arrow). (I and J) Low and high power views, respectively (boxed area in I is magnified in_J_), of a blue NSC in direct juxtaposition to a single migrating neutral red+, spindle-shaped tumor cell (arrow), the NSC “riding” the glioma cell in “piggy-back” fashion. (K and L) Low and high power views, respectively, under fluorescence microscopy, of single migrating GFP+ tumor cells (green) in juxtaposition to β-gal+ NSCs (red). Region indicated by white arrow in_K_ and magnified in L illustrates NSCs apposed to tumor cells migrating away from the main tumor bed. (Scale bars: A, 40 μm, 30 μm in B;C, 30 μm, 25 μm in D;E, 90 μm, 100 μm in F;H, 15 μm, 60 μm in G;J, 30 μm, 60 μm in I, 70 μm in_K_, 35 μm in L.)
On day 0, recipients received injections of tumor cells (3–4 × 10⁴ in 1 μl of PBS) into the right frontal lobe. On day 4–6, NSCs or fibroblasts (4–10 × 104 in 1.5 μl of PBS) were injected directly into the tumor bed, using identical coordinates. Recipients were killed on days 6–9, 10–12, 14–16, and 21 after tumor implantation.
NSC implantation at distant intracranial site from tumor bed: In same hemisphere (Fig. 3, Paradigm 2).
Figure 3.

NSCs implanted at various intracranial sites distant from main tumor bed migrate through normal adult tissue toward glioma cells. (A and B) Same hemisphere but_behind_ tumor (Paradigm 2). Shown here is a section through the tumor from an adult nude mouse 6 days after NSC implantation caudal to tumor. In A (as per the schematic, a coned down view of a tumor populated as pictured under low power in Figs.2A and 3 A and B), note X-Gal+ blue NSCs interspersed among dark neutral red+ tumor cells. (B) High power view of NSCs in juxtaposition to islands of tumor cells. (C–H) Contralateral hemisphere (Paradigm 3). (C–E) As indicated on the schematic, these panels are views through the corpus callosum (“c”) where β-gal+ NSCs (red cells, arrows) are seen migrating from their site of implantation on one side of the brain toward tumor on the other. Two representative NSCs indicated by arrows in C are viewed at higher magnification in D and E, respectively, to visualize the classic elongated morphology and leading process of a migrating neural progenitor oriented toward its target. In_F_, β-gal+ NSCs (red) are “homing in” on the GFP+ tumor (green) having migrated from the other hemisphere. In G, and magnified further in_H_, the X-Gal+ blue NSCs (arrows) have now actually entered the neutral red+ tumor (arrowheads) from the opposite hemisphere. (I and J) Intraventricular (Paradigm 4). Shown here is a section through the brain tumor of an adult nude mouse 6 days following NSC injection into the contralateral cerebral ventricle. In I, as per the schematic, blue X-Gal+ NSCs are distributed within the neutral red+ main tumor bed (edge delineated by arrowheads). At higher power in J, the NSCs are in juxtaposition to migrating islands of red glioblastoma cells. Fibroblast control cells never migrated from their injection site in any paradigm. All X-Gal-positivity was corroborated by anti-β-gal immunoreactivity. (Scale bar: A, 20 μm, and applies to_C_; B, 8 μm, 14 μm in D and E, 30 μm in F and G, 15 μm in H, 20 μm in I, and 15 μm in J.)
On day 0, recipients received injections of glioblastoma cells (3 × 10⁴ in 1 μl of PBS) into the right frontal lobe. On day 6, NSCs (4 × 10⁴ in 1.5 μl of PBS) were injected also into the right frontoparietal lobe at the following coordinates: 3 mm lateral and 4 mm caudal to bregma; depth 3 mm from dura—i.e., 1 mm lateral and 4 mm behind the tumor. Animals were killed on days 12 and 21.
In contralateral hemisphere (Fig. 3, Paradigm 3).
On day 0, recipients received injections of glioblastoma cells (3–5 × 10⁴ in 1 μl of PBS) into the right frontal lobe (2.5 mm lateral and 2 mm caudal to bregma; depth 3 mm from dura). On day 6, NSCs (8 × 10⁴ in 2 μl of PBS) were injected into the left frontal lobe at the following coordinates: 2 mm lateral and 2 mm caudal to bregma; depth 3 mm from dura. Animals were killed on days 12 and 21.
Into ventricles (Fig. 3, Paradigm 4).
On day 0, recipients received injections of glioblastoma cells (5–8 × 10⁴ in 1 μl of PBS) into the right frontal lobe (2 mm lateral to bregma on the coronal suture; depth 3 mm from dura). On day 6, NSCs (8 × 10⁴ in 2 μl of PBS) were injected into the contralateral or ipsilateral cerebral ventricle at the following coordinates on the respective side: 1 mm lateral and 3 mm caudal to bregma; depth 2 mm from dura. Animals were killed on days 8, 12, and/or 21.
NSC implantation into a peripheral, intravascular site (Fig.4, Paradigm 5).
Figure 4.

NSCs injected into tail vein “target” intracerebral gliomas. Paradigm 5 is illustrated. (A–C) Progressively higher power views of representative 10-μm sections through the brain 4 days after NSC injection, processed with X-Gal histochemistry (A) and anti-β-gal immunocytochemistry (B and C) to identify donor NSCs and counterstained with neutral red to delineate the tumor border. (The β-gal immunoproduct, in addition to providing independent identity confirmation, typically fills cells and processes much better than X-Gal.) At low power (A), X-Gal+ NSCs (representative X-Gal precipitate enlarged in Inset) are distributed throughout the tumor but not in surrounding normal tissue. Sister sections, reacted with an anti-β-gal antibody and visualized at higher power in B and further magnified in_C_ confirm the presence of donor-derived cells (arrow) within the tumor. (Scale bar: A, 25 μm, 20 μm in_B_, and 12 μm in C.)
On day 0, adult nude mice received injections of CNS-1 glioblastoma cells (1 × 10⁵ in 2 μl of PBS) into the right frontal lobe. On day 7, murine NSCs (2 × 10⁶ in 200 μl of PBS) were injected into the tail vein. Animals were killed on day 12.
Retroviral Transduction of NSCs with Cytosine Deaminase (CD).
A plasmid using the retroviral pBabePuro backbone (16) was constructed to include the E. coli CD cDNA (1.5-kb fragment) transcribed from the long terminal repeat. Vectors were packaged by cotransduction of the CDpuro plasmid with the MV12 envelope coding plasmid cDNA (17) into 293T/17 cells (18). CDpuro retroviral supernatant was used for multiple infections of the murine NSCs. Transduced NSCs (“CD-NSCs”) were placed under puromycin selection for ≈2 wk.
Oncolysis Assays of CD Bioactivity.
For in vitro assays, CNS-1 cells (2 × 10⁵) were plated onto 10-cm dishes (day 1). On day 2, murine or human CD-NSCs (5–10 × 104) were added. On day 3, 5-fluorocytosine (5-FC, 500 μg/ml) was added. Control dishes included (i) cocultures with no 5-FC and (ii) tumor cells alone with 5-FC. On day 6, plates were stained by means of X-Gal histochemistry to visualize NSCs and with neutral red to visualize tumor cells (Fig. 6 A and B). The number of tumor cells was extrapolated from the average of 20 random high power fields per plate. For in vivo assays, animals bearing CNS-1 cells (7 × 10⁴) alone or CNS-1 cells interspersed with CD-NSCs (3.5 × 10⁴) received 10 i.p. injections of 5-FC (900 mg/kg) over 10 days. Control tumor-bearing animals received no 5-FC, 5-FC without NSCs, or NSCs without 5-FC. One day after the last 5-FC dose, the brains were cryosectioned and stained with X-Gal and neutral red, and measurements of the tumor were made from camera lucida drawings of the mass from interval sections through the tumor from which relative surface areas were then calculated by image analysis (Fig. 7).
Figure 6.
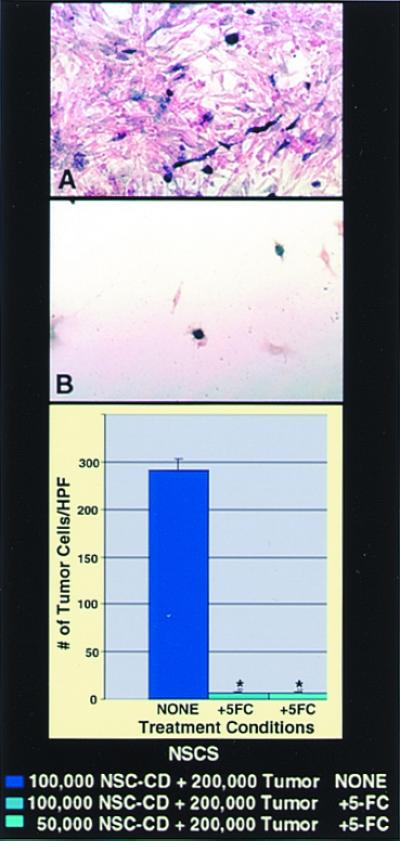
Bioactive transgene (CD) remains functional (as assayed by_in vitro_ oncolysis) when expressed within NSCs. CNS-1 glioblastoma cells (red) were cocultured with CD-transduced murine NSCs (A and B) (blue). Cocultures unexposed to 5-FC grew healthily and confluent (A), whereas plates exposed to 5-FC showed dramatic loss of tumor cells (B), represented quantitatively by the histograms (*,P < 0.001). The oncolytic effect was identical whether 1 × 10⁵ CD-NSCs or half that number were cocultured with a constant number of tumor cells. (In this paradigm, subconfluent NSCs were still mitotic at the time of 5-FC exposure and thus also subject to self-elimination by the generated 5-fluorouracil and its toxic metabolites.)
Figure 7.

Expression of a bioactive transgene (CD) delivered by NSCs is retained in vivo as assayed by reduction in tumor mass. The size of an intracranial glioblastoma populated with CD-NSCs in an adult nude mouse treated with 5-FC was compared with that of tumor treated with 5-FC but lacking CD-NSCs. These data, standardized against and expressed as a percentage of a control tumor populated with CD-NSCs receiving no treatment, are presented in the histograms in_A_. These measurements were derived from measuring the surface area of tumors (like those in Figs. 2–5), representative camera lucidas of which are presented in B–D. Note the large areas of a control non-5-FC-treated tumor containing CD-NSCs (B) and a control 5-FC-treated tumor lacking CD-NSCs (C) as compared with the dramatically smaller tumor areas of the 5-FC-treated animal who also received CD-NSCs (D) (≈80% reduction as per the histogram in_A_; *, P < 0.001), suggesting both activity and specificity of the transgene. The lack of effect of 5-FC on tumor mass when no CD-bearing NSCs were within the tumor (C) was identical to the effect of CD-NSCs in the tumor without the gene being used (B).
BrdUrd Uptake by Engrafted NSCs.
Selected animals received three i.p. injections of BrdUrd (1 ml/100 g body weight of a 20 μM stock solution) over 24 h before sacrifice.
Histopathological and Immunocytochemical Analysis.
On the days specified in the paradigms above, animals were killed, and 10- to 15-μm serial coronal cryosections from 4% paraformaldehyde-fixed brains were processed for light microscopy with X-Gal histochemistry to identify _lacZ_-expressing blue donor cells (8–10, 13) and counterstained with neutral red to detect distinctively dark red, elongated tumor cells (2). Sister sections were prepared for dual-filter immunofluorescence where an anti-β-gal antibody was revealed with a Texas Red-conjugated secondary antibody (1:1,000; Vectastain) (to identify donor cells as red) (8–10, 13), and an anti-GFP antibody (1:500; CLONTECH) was revealed with an FITC-conjugated secondary antibody (1:1,000; Vectastain) (to recognize CNS-1 tumor cells as green). BrdUrd+-intercalated cells were identified by an anti-BrdUrd antibody (5). Sections containing human NSCs were additionally stained with multiple human-specific antibodies, including against to ribonuclear protein (Chemicon, 1:20), against NuMA (Chemicon, 1:40 and Calbiochem, 1:400), and against the human EGF receptor (Upstate Biotechnology, 1:100), revealed by a biotinylated goat anti-mouse IgM (1:250, Vectastain) followed by the standard ABC and diaminobenzidine (DAB) reaction (Vectastain).
Results
This study's focus was documenting the migratory behavior of NSCs [specifically those reported to be effective delivery vehicles for genes (5, 8) and viral vectors (10)] in relation to aggressively invasive experimental intracranial tumors in adult brain and then to arm some of these cells with a bioactive, therapeutic gene requiring relative proximity to tumor cells (allowing oncolysis to be a measure of the efficiency and specificity of gene expression).
Migratory Capacity of NSCs in Culture.
To visualize the migratory properties of NSCs when confronted with a tumor, in vitro studies first assessed the relative migratory capacity of NSCs compared with fibroblasts cocultured with glioma cells. In contrast to fibroblasts, which remained localized to the area of initial seeding (Fig. 1A), NSCs migrated rapidly and interspersed throughout the glioma monolayer, far from their initial site of seeding, robustly expressing lacZ (Fig. 1B). These patterns were observed whether the cells were plated directly on top of (i.e., in direct contact with) the glioma cells (arrows) or merely within the same culture medium and environment without direct contact (arrowheads). The migrating NSCs then became contact-inhibited and quiescent (do not incorporate BrdUrd; ref. 5).
NSCs Migrate Throughout and “Surround” Tumor in Vivo.
To determine the behavior of NSCs introduced to brain tumors_in vivo_, adult rats first received an implant of syngeneic D74 rat glioma cells (19) into the right frontal lobe. Four days later,_lacZ_-expressing murine NSCs were injected directly into the tumor bed (Paradigm 1, Fig. 2). Animals were killed at 2- to 4-day intervals after intratumoral injection and brain sections processed to detect β-gal-producing NSCs. As early as 2 days after injection, X-Gal**+** blue donor NSCs were found distributed extensively throughout the darkly neutral red-stained tumor mass (Fig.2A). Although the transgene-expressing NSCs remained stably intermixed throughout the tumor (Fig. 2B, arrows), up to and along the infiltrating tumor edge, they largely stopped at the border of the tumor where it interfaced with normal tissue (Fig. 2C, arrowheads) as if “surrounding” the advancing neoplasm. Normal adult parenchyma presented a less permissive migratory environment to NSCs, except under one circumstance: where tumor cells began to infiltrate normal brain. In those instances, the NSCs migrated slightly beyond the tumor edge in conjunction with— as if following or “trailing”—individual infiltrating tumor cells (Fig. 2C, arrow). This phenomenon was most dramatic when examined in the context of the more virulent and aggressively infiltrative CNS-1 glioblastoma cell line (11) (Fig.2D), which, in adult nude mice, demonstrates single cell invasive characteristics analogous to those of human glioblastomas. After implantation as per Paradigm 1, extensive migration and distribution of β-gal**+** donor cells was again noted throughout the darkly red-stained infiltrating tumor mass, up to, and along the encroaching tumor edge (red arrowheads), with further migration into the surrounding tissue in concert with and in virtual juxtaposition to aggressively invading tumor cells (Fig. 2D, black arrows).
NSCs “Track” Infiltrating Tumor Cells.
To better distinguish single tumor cells migrating away from the main tumor mass, CNS-1 glioblastoma cells were labeled ex vivo by retroviral transduction of GFP cDNA before implantation (12). After implantation (as per Paradigm 1) of_lacZ_-expressing NSCs into the GFP-expressing CNS-1 tumor bed (Fig. 2 E–L), NSCs could not only be seen to distribute themselves throughout the tumor to its invading edge (Fig. 2 E and F), but could even more clearly be seen to “trail” islands of tumor cells migrating away from the main tumor mass (Fig. 2 G and H) as well as individual aggressive, dark red, or GFP+, elongated infiltrating tumor cells (Fig. 2 I–L). Of note is the frequently observed apposition of transgene-expressing NSCs to invasive tumor cells (Fig. 2 J–L, arrows). The NSCs themselves never became tumorigenic. BrdUrd pulsing of animals before sacrifice confirmed prior observations that donor NSCs were quiescent in normal tissue (5), nonmitotic (i.e., BrdUrd−) in the heart of the tumor, and with an occasional NSC that could still incorporate BrdUrd at the advancing edge, a situation optimal for targeting therapy toward invading tumors. The vast majority of NSCs remained not only quiescent but undifferentiated, expressing only nestin.
NSCs Implanted Intracranially at Distant Sites Migrate Toward Tumor.
To determine whether NSCs have the capacity to migrate specifically toward the tumor, NSCs were injected into uninvolved intracranial sites distant from the main tumor mass in three separate paradigms (Fig. 3). In each case, donor NSCs migrating through normal adult tissue “targeted” the tumor. In Paradigm 2, NSCs were injected behind the glioblastoma. NSCs were always found distributed within the main tumor bed, as well as in apposition to migrating tumor cells in surrounding tissue (Fig. 3 A and B), with very few NSCs in other locations. In Paradigm 3, murine NSCs were injected into the contralateral hemisphere. NSCs (fluorescent red or X-Gal**+** blue) were seen migrating across the corpus callosum and central commissures (Fig. 3 C–E, arrows) toward the tumor (fluorescent green or dark neutral red**+** masses delineated by arrowheads in Fig. 3F), ultimately entering and populating (Fig. 3 G and H, arrows) the tumor on the opposite side of the brain. In Paradigm 4, NSCs were injected into the ipsilateral or contralateral cerebral ventricle. NSCs (blue) again were seen within the main tumor bed (Fig. 3I), as well as in juxtaposition to migrating “islands” of tumor cells (dark red) (Fig. 3J). The only source of blue cells in these paradigms was the “distant” NSC implant. Very few NSC-derived cells were found in normal brain tissue beyond the injection site, except when tracking toward the main tumor mass or near infiltrating tumor cells, suggesting that, whereas NSCs migrated freely within the tumor, the normal adult brain parenchyma presented a less permissive environment for migration. The NSCs themselves never became tumorigenic. The tumors in transplant recipients were never larger than those in non-transplant recipients. NSC-derived cells continued to express their_lacZ_ transgene exuberantly, often in direct contact with tumor cells. These NSC behaviors appeared to be independent of the size or location of the tumor; findings were similar for large tumors, small tumor foci, and even single scattered tumor cells surrounding the main tumor mass. Fibroblasts grafted as controls never showed this dispersion or tropism, consistent with previous reports (15).
NSCs Injected into Systemic Circulation “Target” Intracerebral Gliomas.
Murine NSCs were injected into the tail vein of adult nude mice in which a CNS-1 glioblastoma had been established 1 wk before in the frontal lobe. Four days after i.v. NSC injection, albeit with low efficiency, anti-β-gal**+** NSCs were distributed throughout the intracerebral tumor mass, but were not found in surrounding normal-appearing brain tissue, elsewhere in the brain, or in the brains of control animals (NSC-injected mice without intracerebral gliomas or tumor-bearing mice in the absence of NSC-injection).
Human NSCs and NSCs Expressing a Therapeutic Gene Migrate to Tumors.
Because of the clinical implications of these migratory phenomena, we asked two further questions: (i) did these migratory properties extend to human NSCs? and (ii) could relevant bioactive genes be expressed?
In answer to the first, human NSCs (brown nuclei, arrows in Fig.5 A and B) transplanted into the hemisphere contralateral to a CNS-1 glioma (Paradigm 3) indeed migrated across the corpus callosum and infiltrated and distributed themselves throughout the targeted tumor (arrowheads) as previously observed. That human NSCs could similarly target a true human glioblastoma is suggested in Fig. 5 C_–_E in which Paradigm 3 was repeated employing human NSCs implanted contralateral to an HGL-21-derived tumor established in the nude mouse cerebrum; again, human NSCs migrated from one hemisphere to the other to infiltrate the glioblastoma.
Figure 5.

Human NSCs (hNSCs) possess tumor tracking characteristics. (A and B) Rodent CNS-1 glioblastoma cells and human NSCs were implanted as per Paradigm 3 into opposite hemispheres of an adult mouse. Pictured 7 days later at low power (A) and high power (B) is a section through the neutral red-stained tumor (outlined by arrowheads) intermixed with human NSCs (identified by their brown nuclei following reaction with an anti-human nuclear antibody) (arrows) that migrated from the contralateral side. (C_–_E) Human HGL21 glioblastoma cells and hNSCs were similarly implanted into opposite hemispheres. Pictured at progressively higher power are sections through that neutral red-stained tumor intermixed with human NSCs (X-Gal+ blue) that migrated from the contralateral side. (Scale bars: A, 20 μm, 15 μm in_B_; C, 60 μm, 30 μm in_D_, and 15 μm in E.)
To address the second question, NSCs were stably transduced with a transgene encoding the enzyme CD. CD can convert the nontoxic “prodrug” 5-FC to the oncolytic drug 5-fluorouracil, a chemotherapeutic agent that readily diffuses into tumor cells and has selective toxicity to rapidly dividing cells (18, 19). The CD gene provided an opportunity to examine a prototypical bioactive gene with a relevant, specific, quantifiable read-out of functionality (oncolysis) that might be enhanced by tumor proximity. CD-bearing NSCs retained their extensive migratory, tumor-tracking properties. To determine quantitatively whether a gene such as CD within an NSC retains its bioactivity—as assayed in this case by its anti-tumor effect—CD-bearing NSCs were first cocultured with glioma cells and then, when nearly confluent (Fig.6A), exposed to 5-FC. Death of surrounding tumor cells was induced (Fig. 6B), even when the ratio of NSCs-to-tumor cells was as low as 1:4. NSCs that were mitotic at the time of 5-FC exposure self-eliminated. Control plates of tumor alone were not significantly killed by the same dose of 5-FC. To determine whether this bioactivity was retained in vivo, we used CD-transduced NSCs to express this gene within an intracranial glioma established in an adult nude mouse (3.5 × 10⁴ NSCs to 7 × 10⁴ CNS-1 tumor cells in a 1:2 ratio). After systemic treatment with 5-FC, there was dramatic (≈80%) reduction in the resultant tumor mass at 2 wk postimplantation as compared with that in untreated animals (Fig.7), indicative of CD bioactivity.
Discussion
Transplanted NSCs have recently been recognized for their remarkable ability to migrate throughout the CNS, become normal constituents of the host cytoarchitecture, and disseminate bioactive molecules and retroviral vectors (3–10). Intriguingly, this migratory ability emulates the invasive spread of some brain tumors, e.g., gliomas. Here, we show that an unanticipated benefit of the directed, migratory capacity of transgene-expressing NSCs, including of human origin, may be to target invasive primary brain tumors (also including of human origin) that have proven refractory to current treatments (1,2). Most gene therapy strategies employ viral vectors to deliver genes directly to tumor cells in vivo; however, the distribution of genes to the extensive regions and large numbers of cells in need of attack has been limited. The present study demonstrates the ability of NSCs to migrate expeditiously throughout a tumor mass and, presumably drawn by the degenerative or inflammatory environment created at the infiltrating tumor edge, to “surround” the invading tumor border, all while continuing to express a bioactively relevant transgene. Moreover, the foreign gene-expressing NSCs seem to follow or “track”—virtually ride “piggy-back” upon—those aggressively infiltrating tumor cells escaping into normal tissue. Although the NSCs migrate freely through the tumor, the normal adult brain parenchyma seems to present a less permissive environment for their migration, except when NSCs (even at sites distant from the tumor) travel in a directed fashion through normal adult CNS tissue to target the main tumor mass as well as individual infiltrating, tumor cells. The practical implication is that NSCs might actually “seek out” tumor foci that may have migrated undetected far away from the main tumor mass, not an uncommon occurrence with glioblastoma. Such behaviors are not displayed by cells of nonneural origin (15). Indeed, targeting may be so powerful that even NSCs injected into the systemic circulation may preferentially populate intracerebral gliomas.
Hence, NSCs evince extensive tropism for the tumor itself or for the degenerating CNS it engenders. That the tumor itself elaborates at least some of the tropic cues is suggested by our in vitro studies in which glioma cells in culture, isolated from surrounding brain, prompted NSCs to migrate, by both contact and non-contact-mediated factors. Alternatively, or in addition, tropic cytokines may be released by extensively damaged normal tissue. That minor CNS destruction alone could not prompt the dramatic migration seen in vivo was suggested by NSC transplants into “mock” tumor bearing animals, i.e., animals in which a needle was inserted to emulate the tissue damage of establishing an experimental tumor bed but without the actual implantation of glioblastoma cells; NSCs did not migrate toward the site in this circumstance. Nevertheless, in other previously reported experimental situations in which significant neuronal death was rendered (13), NSC differentiation was altered by apparent trophic influences. Therefore, the signals to which the NSCs are responding are most likely complex, from multiple sources, and representing a “mixture” of attractants, adhesion and substrate molecules, chemokines, etc. Of broader biological significance, these findings suggest that migration can be unexpectedly extensive, even in adult brain and along nonstereotypical routes, if pathology (as modeled here by tumor) is present.
Having documented this powerful tropic interaction between NSCs and intracranial pathology, we believe that exogenous NSCs, genetically engineered ex vivo and strategically implanted, may provide a “platform” for the dissemination of therapeutic genes and/or gene products to previously inaccessible infiltrating tumor cells. As suggested in our CD/5-FC prodrug paradigm, NSCs were able to express a bioactive transgene in vivo to effect a significant biologically relevant read-out (dramatic reduction in tumor burden). Cytotoxic 5-fluorouracil and its toxic metabolites can readily diffuse into surrounding tumor cells giving CD an impressive “bystander” effect; as little as 2% of the tumor mass containing CD-expressing cells may generate significant oncolysis (22). Indeed, NSCs engineered to express CD are attractive as molecular pumps because they can generate agents that kill tumor cells yet undergo self-elimination should the NSCs themselves become mitotic. This prototypical genetic strategy represents one of many potential approaches to treating brain tumors with migratory genetically engineered NSCs. Other candidates include genes encoding: proteins that induce differentiation of neoplastic cells and/or their signal-transduction mediators; cell cycle modulators; apoptosis-promoting agents; anti-angiogenesis factors; immune-enhancing agents (23); fusion agents; and oncolytic factors (24). That these same engraftable migratory NSCs have been demonstrated to serve as intracerebral viral vector producer cells (10) may allow “extended” delivery of lethal viral-mediated genes to larger numbers of tumor cells in broader regions of brain. Instilled into the resection or biopsy cavity, or applied intermittently into or near the tumor mass or suspicious tissue or into cerebral ventricles, engineered NSCs could be used in conjunction with other interventions. An NSC-based strategy—responding to the altered biology of the abnormal adult brain and by virtue of their unique inherent biology—may both optimize present approaches and make feasible new ones for more effectively, selectively, and safely targeting genes and vectors to refractory, migratory, invasive brain tumors.
Acknowledgments
We thank M. Sena-Esteves for help with generating retrovirus vectors. This work is supported by National Institutes of Health Grants HD07466 and CA86768 (to K.S.A.) and CA69246 (to X.O.B.), the Toennies Stiftung (to N.G.R.), the Deutsche Forschungsgemeinschaft (to U.H.), National Institutes of Health Grants NS33852 and NS34247, and the Brain Tumor Society (to E.Y.S.). Portions of this work were presented at the Second Conference on Cellular and Molecular Treatments of Neurological Diseases, Cambridge, MA, October 10, 1998. This work is dedicated to the memory of Dr. James A. Galambos.
Abbreviations
NSC
neural stem cell
CNS
central nervous system
GFP
green fluorescent protein
β-gal
β-galactosidase
X-Gal
5-bromo-4-chloro-3-indolyl β-d-galactoside
CD
cytosine deaminase
5-FC
5-fluorocytosine
CD-NSC
CD-transduced NSC
Footnotes
See commentary on page 12393.
References
- 1.Black P M, Loeffler J, editors. Cancer of the Nervous System. Oxford: Blackwell; 1997. [Google Scholar]
- 2.Kramm C M, Sena-Esteves M, Barnett F H, Rainov N G, Schuback D E, Yu J S, Pechan P A, Paulus W, Chiocca E A, Breakefield X O. Brain Pathol. 1995;5:345–381. doi: 10.1111/j.1750-3639.1995.tb00615.x. [DOI] [PubMed] [Google Scholar]
- 3.Gage F H. Science. 2000;287:1433–1438. doi: 10.1126/science.287.5457.1433. [DOI] [PubMed] [Google Scholar]
- 4.McKay R. Science. 1997;276:66–71. doi: 10.1126/science.276.5309.66. [DOI] [PubMed] [Google Scholar]
- 5.Flax J D, Aurora S, Yang C, Simonin C, Wills A M, Billinghurst M J, Sidman R L, Wolfe J H, Kim S U, Snyder E Y. Nat Biotech. 1998;16:1033–1039. doi: 10.1038/3473. [DOI] [PubMed] [Google Scholar]
- 6.Weiss S, Reynolds B A, Vescovi A L, Morshead C, Van der Kooy D. Trends Neurosci. 1996;19:387–393. doi: 10.1016/s0166-2236(96)10035-7. [DOI] [PubMed] [Google Scholar]
- 7.Alvarez-Buylla A, Temple S. J Neurobiol. 1998;36:105–314. [PubMed] [Google Scholar]
- 8.Snyder E Y, Taylor R M, Wolfe J H. Nature (London) 1995;374:367–370. doi: 10.1038/374367a0. [DOI] [PubMed] [Google Scholar]
- 9.Yandava B D, Billinghurst L L, Snyder E Y. Proc Natl Acad Sci USA. 1999;96:7029–7034. doi: 10.1073/pnas.96.12.7029. [DOI] [PMC free article] [PubMed] [Google Scholar]
- 10.Lynch W P, Sharpe A H, Snyder E Y. J Virol. 1999;73:6841–6851. doi: 10.1128/jvi.73.8.6841-6851.1999. [DOI] [PMC free article] [PubMed] [Google Scholar]
- 11.Kruse C A, Molleston M, Parks E P, Schiltz P M, Kleinschmidt-DeMasters B K, Hickey W F. J Neurooncol. 1994;22:191–200. doi: 10.1007/BF01052919. [DOI] [PubMed] [Google Scholar]
- 12.Aboody-Guterman K S, Pechan P A, Rainov N G, Sena-Esteves M, Snyder E Y, Wild P, Schraner E, Tobler K, Breakefield X O, Fraefel C. NeuroReport. 1997;8:3801–3808. doi: 10.1097/00001756-199712010-00029. [DOI] [PubMed] [Google Scholar]
- 13.Snyder E Y, Yoon C H, Flax J D, Macklis J D. Proc Natl Acad Sci USA. 1997;94:11663–11668. doi: 10.1073/pnas.94.21.11663. [DOI] [PMC free article] [PubMed] [Google Scholar]
- 14.Yuan F, Salehi H A, Boucher Y, Vasthari U S, Tuma R F, Jain R K. Cancer Res. 1994;54:4564–4568. [PubMed] [Google Scholar]
- 15.Tamiya T, Wei M X, Chase M, Ono Y, Lee F, Breakefield X O, Chiocca E A. Gene Ther. 1995;2:531–538. [PubMed] [Google Scholar]
- 16.Morgenstern J P, Land H. Nucleic Acids Res. 1990;18:3587–3596. doi: 10.1093/nar/18.12.3587. [DOI] [PMC free article] [PubMed] [Google Scholar]
- 17.Sena-Esteves M, Saeki Y, Camp S, Chiocca E A, Breakefield X O. J Virol. 1999;73:10426–10439. doi: 10.1128/jvi.73.12.10426-10439.1999. [DOI] [PMC free article] [PubMed] [Google Scholar]
- 18.Pear W S, Nolan G P, Scott M L, Baltimore D. Proc Natl Acad Sci USA. 1993;90:8392–8396. doi: 10.1073/pnas.90.18.8392. [DOI] [PMC free article] [PubMed] [Google Scholar]
- 19.Ko L, Koestner A, Wechsler W. Acta Neuropathol. 1980;51:23–34. doi: 10.1007/BF00688846. [DOI] [PubMed] [Google Scholar]
- 20.Topf N, Worgall S, Hackett N R, Crystal R G. Gene Ther. 1998;5:507–513. doi: 10.1038/sj.gt.3300611. [DOI] [PubMed] [Google Scholar]
- 21.Mullen C, Kilstrup M, Blaese R M. Proc Natl Acad Sci USA. 1992;89:33–37. doi: 10.1073/pnas.89.1.33. [DOI] [PMC free article] [PubMed] [Google Scholar]
- 22.Huber B E, Austin E A, Richards C A, Davis S T, Good S. Proc Natl Acad Sci USA. 1994;91:8302–8306. doi: 10.1073/pnas.91.17.8302. [DOI] [PMC free article] [PubMed] [Google Scholar]
- 23.Benedetti S, Pirola B, Pollo B, Gagrassi L, Briuzzone M G, Rigamonti D, Galli R, Selleri S, DiMeco R, DeFraja C, et al. Nat Med. 2000;6:447–450. doi: 10.1038/74710. [DOI] [PubMed] [Google Scholar]
- 24.Herrlinger U, Woiciechowski C, Aboody K S, Jacobs A H, Rainov N G, Snyder E Y, Breakefield X O. Mol Ther. 2000;1:347–357. doi: 10.1006/mthe.2000.0046. [DOI] [PubMed] [Google Scholar]