Intracellular Long Wavelength Voltage-Sensitive Dyes for Studying the Dynamics of Action Potentials in Axons and Thin Dendrites (original) (raw)
. Author manuscript; available in PMC: 2008 Aug 30.
Abstract
In CNS neurons most of synaptic integration takes place in thin dendritic branches that are difficult to study with conventional physiological recording techniques (electrodes). When cellular compartments are too small, or too many, for electrode recordings, optical methods bring considerable advantages. Here we focused our experimental effort on the development and utilization of new kinds of voltage-sensitive dyes (VSD). The new VSDs have bluish appearance in organic solvents, and hence are dubbed “blue dyes”. They have preferred excitation windows for voltage recording that are shifted to longer wavelengths (∼660 nm). Excitation in deep red light and emission in the near-infrared render “blue VSDs” potentially useful in measurements from fluorescent structures below the tissue surface because light scattering is minimized at longer wavelengths. Seven new molecules were systematically tested using intracellular injection. In comparison to the previously used red dye (JPW-3028) the blue dyes have better sensitivity (ΔF/F) by approximately 40%. Blue dyes take little time to fill the dendritic tree, and in this aspect they are comparable with the fastest red dye JPW-3028. Based on our results, blue VSDs are well suited for experimental exploration of thin neuronal processes in semi intact preparations (brain slice). In some cases only 6 sweeps of temporal averaging were needed to acquire excellent records of individual action potentials in basal and oblique dendritic branches, or in axons and axon collaterals up to 200 μm away from the cell body. Signal-to-noise ratio of these recordings was ∼10. The combination of blue dyes and laser illumination approach imposed little photodynamic damage and allowed the total number of recording sweeps per cell to exceed 100. Using these dyes and a spot laser illumination technique, we demonstrate the first recording of action potentials in the oblique dendrite and distal axonal segment of the same pyramidal cell.
Keywords: voltage-sensitive dye, cortex, pyramidal neuron, action potential backpropagation, dendritic imaging, laser illumination, blue dyes
1. Introduction
During an ordinary behavioral task pyramidal neurons of the mammalian cerebral cortex are engaged in massive processing of electrical signals (Gilbert, 1977; Leventhal and Hirsch, 1978; Reinagel et al., 1999; London et al., 2002; Elston, 2003). Conventional laboratory tools, such as glass electrodes and calcium imaging are not ideally suited to study the integration of electrical signals in thin dendritic branches, where the majority of synaptic inputs actually impinge on pyramidal neurons (Larkman, 1991). The small diameters of basal, oblique and apical tuft dendrites prevent routine recordings beyond 140 μm from the cell body (Nevian et al., 2007). Also, single-site patch-clamp recordings cannot capture the spatial aspect of signal initiation and propagation. Calcium imaging, on the other hand, is a very indirect way of looking into the neuronal electrical activity (Regehr and Tank, 1990; Miyakawa et al., 1992). Calcium signals in many cases do not correlate well with electrical transients (discussed in (Milojkovic et al., 2004)). One alternative for recording electrical signals from structures that are too small or fragile for electrode recording is based on voltage-sensitive dyes (VSD). VSD provide a direct, fast, and linear measure of the change in membrane potential of the stained membranes, with time courses that are rapid compared to the rise time of an action potential (Ross et al., 1977; Loew et al., 1985). The development of water-soluble dyes (Antic et al., 1992; (Loew, 1988, 1994) has made it possible to inject VSDs into individual cells of interest and analyze the dynamics of electrical transients in dendritic branches that have never been probed with electrodes (Antic et al., 1999). Using this method, action potentials and postsynaptic potentials have been characterized in apical tuft branches of the mitral cell (Djurisic et al., 2004), apical and oblique dendrites of the hippocampal CA1 pyramidal neuron (Canepari et al., 2007; Gasparini et al., 2007) and basal dendrites of the neocortical pyramids (Antic, 2003; Kampa and Stuart, 2006). Voltage-sensitive dye imaging is a method of choice in cellular compartments with submicron diameter, such as axon (Palmer and Stuart, 2006) or dendritic spine (Nuriya et al., 2006), reviewed in (Stuart and Palmer, 2006). In spite of these successes, single-cell voltage-imaging technique is burdened with several serious problems, including poor sensitivity, slow diffusion, and high toxicity of currently available VSDs.
Here we present a new set of voltage-sensitive dyes designed for intracellular application. The new dyes (blue VSDs) are characterized with fast diffusion through the dendritic tree, better sensitivity, and less toxicity than previously used “red” intracellular dyes JPW-1114 and JPW-3028 (Antic et al., 1999; Djurisic et al., 2004; Dombeck et al., 2005; Palmer and Stuart, 2006). In addition, blue dyes give best signals when excited with longer wavelengths (658 nm) than red dyes (520 nm), which reduces the scattering of light by the brain tissue and improves the resolution of imaging (Denk et al., 1990; Denk et al., 1994; Shoham et al., 1999). One big challenge for cellular physiology is to carry out simultaneous multi-site recordings of electrical activity in the dendritic tree of pyramidal cortical neuron in vivo. In the last decade, in vivo dendritic calcium imaging was attained using longer wavelength and laser illumination, in particular two-photon excitation (Svoboda et al., 1997; Waters and Helmchen, 2004). Here we demonstrate the use of low-cost red-laser single-photon illumination (658 nm) for dendritic voltage-imaging in brain slice preparation, and collection of photons in the near-infrared part of the spectrum (> 710 nm) using a CCD camera at 2.7 kHz frame rate. The improvements in voltage-sensitive dye techniques described in this work, represent a significant expansion of the experimental tools for probing the dendritic function in semi-intact preparations (brain slice) and bring us one step closer to axonal and dendritic voltage imaging in vivo.
2. Materials and Methods
2.1. Dye synthesis
Voltage-sensitive dyes were synthesized according to the aldol condensation and palladium-catalyzed coupling strategies described in (Hassner et al., 1984; Antic et al., 1992; Wuskell et al., 2006). Specific details for the synthesis of the new PY dyes will be published elsewhere.
2.2. Brain slice and Electrophysiology
Sprague Dawley rats (P21 – 42) were anesthetized with isoflurane, decapitated, and the brains were removed with the head immersed in ice-cold, artificial cerebrospinal fluid (ACSF), according to an animal protocol approved by the Center for Laboratory Animal Care, University of Connecticut. Brain slices (300 μm) were cut from frontal lobes in the coronal plane. ACSF contained (in mM) 125 NaCl, 26 NaHCO3, 10 glucose, 2.3 KCl, 1.26 KH2PO4, 2 CaCl2 and 1 MgSO4, pH 7.4. Whole-cell recordings were made from visually identified layer V pyramidal neurons on the medial part of the slice. Intracellular solution contained (in mM) 135 K-gluconate, 2 MgCl2, 3 Na2-ATP, 10 Na2-phosphocreatine, 0.3 Na2-GTP and 10 Hepes (pH 7.3, adjusted with KOH). Electrical signals were amplified with Multiclamp 700A and digitized with two input boards: (1) Digidata Series 1322A (Axon Instruments) at 5 kHz, and (2) Neuroplex (RedShirtImaging) at 2.7 kHz sampling rate. Only cells with a membrane potential more hyperpolarized than −50 mV, and action potential amplitudes exceeding 80 mV (measured from the base line) were included in this study. All experiments were performed on layer 5 cortical pyramidal cells at 34°C.
2.3. Dye Injections
The dye injection protocol was based on our previous work with red dyes (JPW-1114 and JPW-3028; Antic, 2003). Neurons were filled through whole-cell recording pipettes with voltage-sensitive dyes listed in Table 1. Blue dyes were stored in ethanol stock solution at −20°C. On the day of the recording blue dyes were dissolved in standard K-gluconate based intracellular solution. Loading pipette was filled with two varieties of the same intracellular solution; one with and one without dye. Dye-free solution was occupying the very tip of the pipette, while the back of the pipette lumen was microloaded with dye-rich solution. The purpose of dye-free solution in the tip of the patch pipette was to prevent dye-leak during the maneuver through brain slice tissue. VSD styryl dyes are lipophilic and bind indiscriminately and irreversibly to all membranes around the neuron of interest. Even a small amount of dye that leaks out of the pipette during the formation of the gigaohm seal, can generate strong fluorescent background. Fluorescent light emanating from surrounding tissue has a devastating effect on dendritic optical signals. Elimination of the background fluorescence is critical for dendritic voltage imaging. How much dye-free solution one should put in the tip depends on time period between the submersion of the patch pipette into the recording chamber and formation of the gigaohm seal. The faster one can perform this maneuver the less dye-free solution she needs to achieve optimal staining.
Table 1.
Chemical and physical characteristics of red and blue voltage-sensitive dyes used in present study.
Blue VSD were injected at room temperature for 25-60 minutes. The filling pipette was carefully pulled out (outside-out patch) and brain slices were left to incubate for 20-120 minutes at room temperature. Just before optical recordings the cells were re-patched with dye-free pipette at the physiological temperature (34°C).
2.4. Optical measurements
Voltage-sensitive dye imaging was performed on a Zeiss Axioskope 2FS microscope equipped with NeuroCCD camera (RedShirtImaging). We used Zeiss 40X objective IRAchroplan 0.80 W. The size of the square visual field captured by NeuroCCD camera was 384 × 384 μm. In the place of the arc lamp (normally used for epi-illumination), we inserted a 200 μm fiber optic guide with a collimator. Laser beam was focused on the other side of the fiber optic guide using a microscope objective-like lens. This arrangement produced a motionless spot of laser light (∼25 μm in diameter) at the object plane. An illuminated section of the brain slice, projected onto the NeuroCCD camera, covered approximately 25 pixels when used with 40X objective lens. At this maginification, one pixel sampled a 4.8 × 4.8 square in the object plane. A region of interest (ROI) was brought into the laser spot using X-Y microscope platform. The laser beam was interrupted by an electro-progammable shutter (Uniblitz®). Attention was made to limit the exposure time during the recording and positioning of the neuron. Focusing and positioning was done at lower light level intensities – regulated by neutral density filters. In the course of this experimental study we used three different laser light sources, Cobolt Samba (100 mW), HeNe (20 mW), and laser diode (80 mW), with peak excitations centered at 532, 633, and 658 nm, respectively. Laser beams were directed onto the preparation with the help of Zeiss epi-illumination filter cubes. For 532 nm laser epi-illumination we used a filter cube with a following set of optical filters: exciter 520 ± 45 nm; dichroic 570 nm; emission >610 nm. For 633 nm laser epi-illumination we used exciter 640/30 nm, dichroic 660 nm and emission 665 nm long-pass. Having an excitation filter in the cube did not make any difference in experiments with laser lines 532 nm and 633 nm, so we simply left the excitation filters in place to expedite the switch between laser and arc lamp (data not shown). For 658 nm laser epi-illumination we used 700 nm dichroic, and 720 nm emission filter (no exciter).
Optical signals were recorded with 80 × 80 pixels at a 2.7 kHz frame rate, stored, and then temporally filtered (off-line) with digital Gaussian low-pass filter (1050 Hz cutoff), and Butterworth high-pass (4.5 Hz), unless otherwise specified. To correct for photobleaching artifact the trace without stimulus was recorded at the end of experiment and subtracted from physiological recordings. The term ROI (region of interest) we use to mark selected neuronal compartments, where membrane potential transients were measured either optically (voltage-sensitive dyes) or electrically (whole-cell). To improve signal-to-noise ratio multiple pixels (3 – 6 pixels) were selected inside the region of interest and spatially averaged, unless otherwise specified.
After the experiment, brain slices were mounted on a microscope slide and photographs were taken with Zeiss AxioVision system. All recovered neurons (n=73) had typical pyramidal morphology with thick apical dendrites projecting vertically towards the pia. The apical trunk bifurcation occurred high in layers III and II, giving rise to 2 – 3 apical tuft branches that run almost parallel to pia.
2.5. Data analysis
Optical and electrical measurements were analyzed using the software Neuroplex 8.3.2 (RedShirtImaging) and Clampfit 9.1 (Axon Instruments). Graph plotting was done in Excel. Amplitudes of action potentials in axons and dendrites (optical signals) were measured from the base line and expressed as a fractional change in light intensity (ΔF/F). Intracellular voltage-sensitive dyes cannot be used to determine the absolute amplitude (in mV) of the electrical transients in distal dendritic segments (Antic et al., 1999).
3. Results
3.1. Experiments on spherical lipid bilayers
Previous work with internally applied VSD has identified naphthylstyryl moiety as the moiety of choice for experiments on individual CNS neurons in brain slices (Antic et al., 1999). A primary goal of the present work was to extend the wavelength range of the styryl chromophores, while preserving the electrochromic sensitivity of the dyes to rapid changes in membrane potential. In addition, the lipophilicity of new molecules must not increase and compromise their intracellular application and the rate of diffusion in the dendritic tree. Accordingly, we sought to preserve the general structural organization of the styryl chromophores. The strategy was to shift their spectra to longer wavelengths by extending the conjugation with longer linkers, larger nitrogen heterocycle acceptors, and more highly constrained planar donors (Wuskell et al., 2006). Newly synthesized organic compounds have bluish appearance in organic solvents, and hence are dubbed “blue dyes”. The optimal excitation wavelengths for optical recording of the blue dyes was red-shifted by approximately 150 nm; from ∼520 nm (old red dyes) to ∼660 nm (new blue dyes). In spherical bilayers the blue VSDs generated potentiometric responses, which were often larger in amplitude than those recorded with red VSD (∼15% compare to ∼10% ΔF/F). Although very promising, these results gave no guarantee that blue dyes would be useful for voltage imaging of real neurons in semi-intact preparation, such as brain slice. Intracellular staining of individual neurons in situ is considerably more difficult than extracellular staining of lipid spheres suspended in solution. In addition, it has been noticed previously that performance of the same VSD varies considerably in different biological preparations. For instance the same dye (oxonol) shows good signals in barnacles and leech but minimal signals in chick spinal cord neurons, or rat superior cervical ganglion neurons (Ross and Reichardt, 1979). The only way to evaluate the applicability of new voltage-sensitive dyes for a given projects is to carry out methodical tests in the preparation of choice (Cohen and Lesher, 1986). Here we present results of testing performed with 7 newly synthesized molecules carried out on pyramidal cells in acute cortical brain slice.
3.2 Experiments in acute brain slices: Wavelength-dependent voltage sensitivity
Our first goal was to determine if newly synthesized molecules, when applied internally in mammalian neurons, produce any detectable voltage-dependent optical signals. Towards this goal, pyramidal cells were injected with blue dye JPW-3080. Following the incubation period (see methods), stained neurons were re-patched, and dye molecules were intermittently excited with two wavelengths. One laser excitation line (532 nm) was below the dye's absorption maximum (Fig. 1D, vertical grey line – max), and the other line (658 nm) was above the JPW-3080 absorption maximum. In all cells filled with JPW-3080 (n=4) laser excitation at 532 nm generated negative optical signals (Fig. 1A, middle trace), while excitation at 658 nm produced positive action potential-associated optical signals (bottom trace). The changes in signal size and signal polarity (Fig. 1A) can be understood as arising from a voltage-induced shift in the absorption spectra, represented schematically in Fig. 1DE. For example, at 532 nm excitation (Fig. 1D, vertical dashed line 532) depolarizing membrane potential transients produce a decrease in the intensity of the fluorescent light (negative signal). When the same neuron was illuminated by 658 nm laser line, membrane depolarization caused an increase in the intensity of the fluorescent light (1D, positive signal). Although showing an identical temporal dynamics, the two optical signals obtained from the same cell were otherwise very different, having opposite signs and very different signal amplitudes (Fig. 1A, optical traces 532 and 658 nm). The average amplitude of AP-associated optical signal obtained with 658 nm excitation was 4.13 ± 0.96 % ΔF/F (mean±s.d., n=4 cells, N=24 measurements). The average size of optical signal obtained from the same 4 cells but using a different laser wavelength (532 nm) was only 0.97 ± 0.26 % ΔF/F. Within the same cell and same region of interest, the average amplitude ratio of AP-associated signal at two wavelengths was 4.39 ± 1.07 (n=4 cells, N=24 measurements). This discrepancy in signal size between two excitation wavelengths stems from the Gaussian contours of the dye's absorption (excitation) spectrum (Montana et al., 1989), and the exact position of the laser excitation line (Fig. 1D, dashed vertical line) in relation to absorption spectrum. For example, if excitation occurred in the linear segment of the Gaussian function (658 nm), voltage-evoked spectral shifts produced a relatively large change in absorption coefficient. If excitation occurred in the nonlinear (sigmoid) portion of the Gaussian function (532 nm), a spectral shift would produce small changes in absorption coefficient (small optical signals), because this segment of the function is partially saturated (very close to peak excitation). In general, for optimal ΔF/F it is best to excite the dyes at the wings of their excitation spectra in order to maximize ΔF and minimize F.
Fig. 1. Voltage-induced spectral shift of the blue VSDs.
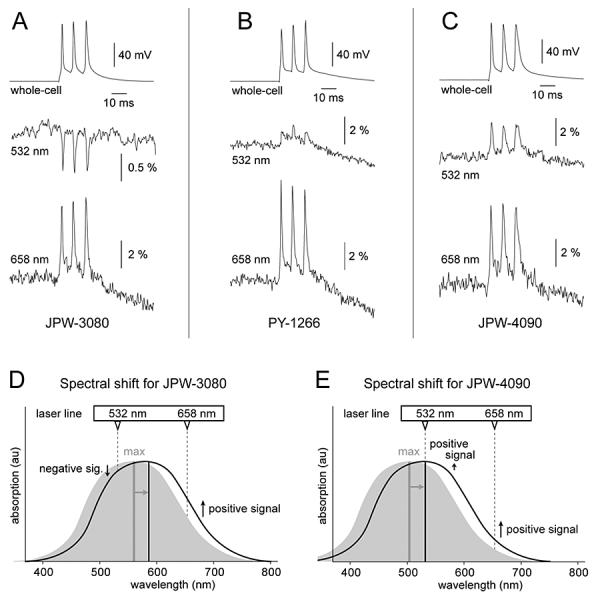
(A) Simultaneous whole-cell and optical (JPW-3080) recordings of three APs evoked by somatic current injection. In this and following panels both optical traces (532 nm and 658 nm) were obtained in the same ROI selected on a basal dendrite 45 – 65 μm from the soma. (B) Same as in A except different VSD (PY-1266). (C) Same as in A except different VSD (JPW-4090). (D) Schematic representation of a spectral shift, which is thought to underlie voltage-sensitivity of fast dyes. Absorption spectrum for JPW-3080 at hyperpolarized (grey contour) and depolarized membrane potential (black contour). Upon depolarization the absorbance maximum (vertical grey line - max) shifts toward longer wavelengths. Gray arrow indicates the direction of the electrochromic shift. Excitation wavelengths shorter than the max (e.g. 532 nm) generate negative optical signals (downward pointing arrow). Excitation wavelengths longer than max (e.g. 658 nm) produce positive optical signals (upward pointing arrow). (E) Same as in D except the absorption maximum of JPW-4090 is below 532 nm. Because both excitation lines (532 and 658 nm) are longer than max, both lines generate positive optical signals. Spectra contours shown in D and E are not real data. They are shown here to illustrate the impact of voltage-induced spectral shift on the size and polarity of voltage-sensitive dye signals.
Out of 7 new blue dyes JPW-3080 was the only one that gave negative and positive signals at two excitation lines (532 nm and 658 nm). This is because the peak absorption of JPW-3080 lies in between these two available laser lines (Fig. 1D, vertical grey) while the others have excitation maxima in membranes that are either below or very near 532nm. Blue dyes JPW-4090 and PY-1266, for example, gave positive signals at both 532 nm and 658 nm excitation (Fig. 1BC). For JPW-4090, this is consistent with the fact that peak absorption wavelength is < 532 nm (Fig. 1E, vertical grey line - max). Interestingly, spectral analysis of PY-1266 performed on multilamellar lipid vesicles (MLV) found peak excitation at 552 nm, respectively (Table 1), i.e. 20 nm higher than the 532nm excitation wavelength used in our imaging experiments. For this reason, blue dye PY-1266 might have been expected to produce a negative signal at 532 nm, but this was not the case (Fig. 1B, middle trace). One possible explanation for this is that the spectrum of the dye on the dendrite membrane may be different than the spectrum in MLV, such that its true absorption maximum on the dendrite is below 532nm. A second possibility is that the voltage-dependent shift of the excitation spectrum needs to be convolved with a voltage dependent change in the emission spectrum; we did not characterize the voltage-dependent emission response, but certainly for other styryl dyes this can contribute as much or more than the change in excitation spectrum (Fluhler et al., 1985; Bullen and Saggau, 1999).
Taken together, these experiments established that blue naphtylstyryl dyes bound to the inner leaf of the neuronal plasmalemma exhibit voltage-sensitivity based on the spectral shift (Fig. 1DE, grey arrow). The exact mechanism of the voltage-induced spectral shift was not systematically investigated in this paper. A definite conclusion has been made that excitation in deep red (658 nm) produces several times larger optical signals than excitation with shorter wavelengths (532 nm).
3.3. Response time
One of the most demanding tests for a calcium-sensitive, sodium-sensitive or voltage-sensitive dye is detection of a single action potential (Markram et al., 1995; Ross et al., 2006). This test is particularly strenuous in the case of voltage-sensitive dyes because here the optical signal is driven directly by the membrane potential change, which has very rapid rise and decay; typically in the range of 1 ms. The short duration of AP dramatically reduces the number of photons collected per time-point. In contrast, calcium-sensitive dye imaging of individual APs deals with much slower (and much larger) optical transients; with durations typically in the range of 100 ms (Markram et al., 1995). Therefore, the response time of the voltage-sensitive dye is critical requirement for use in experimental measurements of individual action potentials. We tested how blue voltage-sensitive dyes change their fluorescent properties in response to membrane potential changes by recording simultaneously electrical (whole-cell) and optical (voltage imaging) signals from neuronal compartments very close to the cell body (less than 50 μm). In this portion of the dendritic tree we get the best signal-to-noise ratio (better than in the cell body), while the short distance from the cell body assures that the electrical signal is not distorted by dendritic cable properties” and/or voltage-gated ion channels. All of the newly synthesized blue dyes (7 out of 7) showed a very fast response to membrane potential change. The trajectories of optical signals (Fig. 2, red) were excellent matches with whole-cell records (black). Both the slow components (Fig. 2, hyperpolarization) and fast transients (action potential, AP) of neuronal electrical activity were captured in the optical signal. We could not determine the exact time delay between optical and electrical signals, because our experimental setup is not designed to perform dual mode measurements with microsecond temporal resolution, but the fact that at 2.7 kHz sampling frequency we could not detect the discrepancy between AP electrical and optical signals, indicates that optical delay must be in the microsecond range. Based on the good temporal correlation between electrical and optical transients (Fig. 2B) we conclude that newly synthesized blue dyes are properly suited for studying the dynamics of neuronal action potentials.
Fig. 2. Fast response time of blue voltage-sensitive dyes.
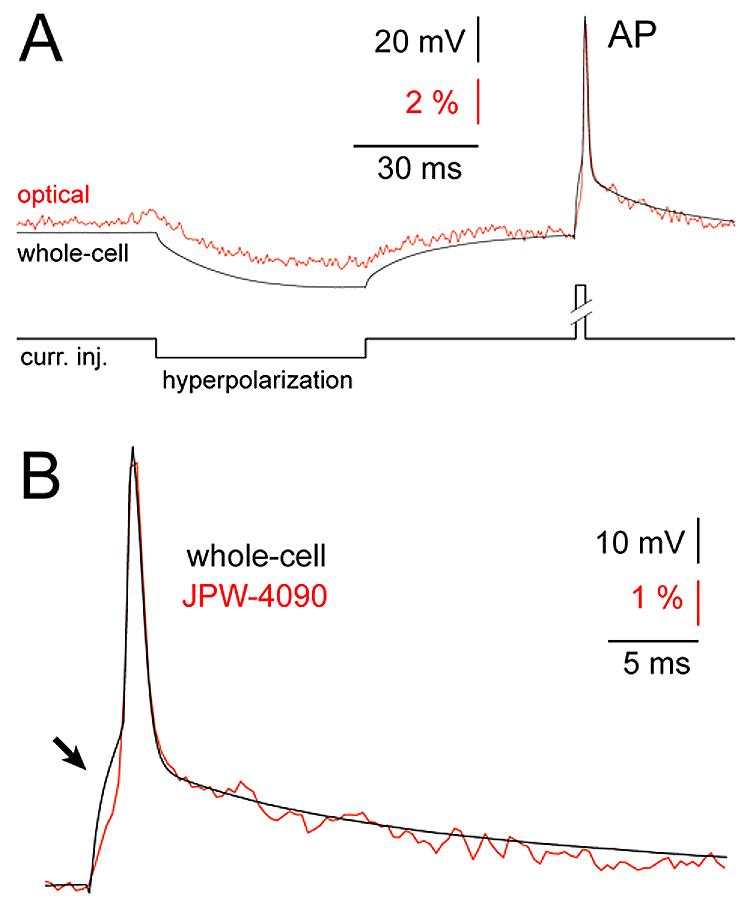
(A) Simultaneous whole-cell (black) and optical (red) recordings of the evoked membrane potential changes using blue dye JPW-4090. Optical signal was sampled from the basal dendrite 45 μm away from the cell body. Average of 6 sweeps. (B) A segment of trace containing AP is blown up to show temporal correlation between whole-cell (black) and optical signal (red). A distortion in electrical recording caused by poorly compensated series resistance (arrow) does not appear in the optical signal.
In addition, optical signals can be used to correct the distortions caused by poorly compensated glass electrode resistance. When series resistance is high, and difficult to compensate by bridge balance, the stimulus-induced voltage drop across the recording electrode contaminates biological signals (Fig. 2B, black trace, arrow). Optical signals, on the other hand, solely depend on electrical field across the biological membrane. Therefore, in the optical channel (Fig. 2B, red trace) the membrane charging curve at the onset of a stimulus pulse is unaffected by electrode series resistance (Cohen et al., 1971; Salzberg et al., 1977). Note that electrical (black) and optical (red) traces have identical trajectories in all segments of the biological signal (AP) except at the stimulus onset (arrow). In this section, the electrical trace is contaminated by a recording artifact.
3.4. Recording action potentials in distal dendritic segments
The major expectation from internally applied voltage sensitive dyes is to detect action potentials in remote dendritic segments (Antic, 2003; Djurisic et al., 2004). Three factors burden voltage-sensitive dye imaging in distal dendrites. First, the recording site is far away from the dye injection site (cell body). The concentration of the lipophilic dye falls off with distance from the injection site, thus remote dendrites are difficult to stain with voltage probes. Second, the recording site is a small cellular compartment, which produces few photons (low light level). As stated in Zochowski et al., 2000, the signal-to-noise ratio is proportional to the square root of the number of photons. Finally, it is difficult to record AP in distal dendritic tips, because the dendritic membrane is weakly excitable and does not support full action potential propagation. In the absence of full active regeneration, passive attenuation mechanisms tend to degrade the amplitude of the voltage transient in distal dendrites. Attenuation of action potential amplitude with distance from the soma is common in dendrites of pyramidal neurons (Larkum et al., 2001; Kampa and Stuart, 2006). To detect backpropagating action potentials in distal dendritic segments, one needs to achieve thorough staining of the dendritic membrane (Zochowski et al., 2000). Therefore, besides voltage-sensitivity, the speed with which voltage-sensitive dye diffuses through the intracellular space is perhaps the major feature to determine its usefulness in experiments. Upon intracellular injection, some blue dyes (4 out of 7) showed excellent spread into dendrites and axons (Fig. 3A). The staining of the plasma membrane was sufficient to allow optical recordings of individual action potentials from thin dendrites (Fig. 3B) and axons (Fig. 3C). We evaluated the intracellular spread of all newly synthesized blue dyes in respect to the most successful red dye JPW-3028 (Antic et al., 2000). Red dye JPW-3028 is water soluble molecule specially designed to travel fast through neuronal intracellular milieu. Blue dyes that appeared to travel with the same speed as the red dye we consider “typical” in present study (Table 2). Dyes that appeared to travel slower than the red dye (JPW-6003 and PY-1286) were characterized “slow” in Table 2. Three out of 7 blue dyes appeared to fill neurons faster than red dye (JPW-3080, PY-1266, and PY-1261). We are aware that attributes such as “typical”, “slow” and “fast” are qualitative (descriptive) and subjective, but it must be stated that this evaluation is based on “side-by-side” experiments/comparisons. In a given week (five experimental days) we would typically use 2-3 different voltage-sensitive dyes. Our laboratory records, on the other hand, contain quantitative information on exactly how much time was spent in each experiment on dye loading and dye incubation thereafter. In Table 2 we include only the subset of cells where good optical signals from basal dendrites (∼ 150 μm from the soma) were obtained with less than 9 averages. Although duration of time (in minutes) is a quantitative measure, the problem with this approach is that both the dye loading and incubation sessions were stopped at experimenter's discretion. In order to provide a more objective measure of time required for dye spread in the dendritic tree, we designed the following experiment. Loading patch pipettes were filled with intracellular solution containing 400 μM dye concentration, and the dye loading pipette was kept on the cell at all times. Because no re-patching was undertaken this series of experiments was dubbed “Simple filling”. In simple filling experiments 5 out of 7 blue dyes produced good optical signals (single AP) in less than 60 minutes after “break in”. According to the time period spent for simple filling, some blue dyes (JPW-3080, PY-1261, PY-1266) were as fast as red dye JPW-3028, while others (JPW-1268, JPW-4090) were on average 15-20 minutes slower (Table 2).
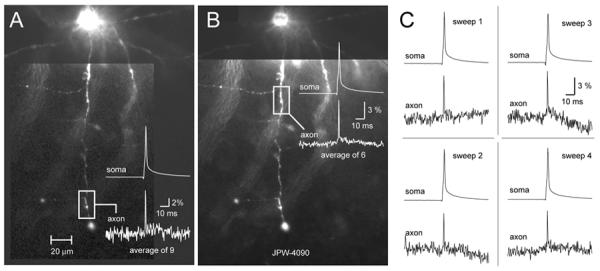
Fig. 3. Optical recordings of action potentials in dendrites and axons of pyramidal cells.
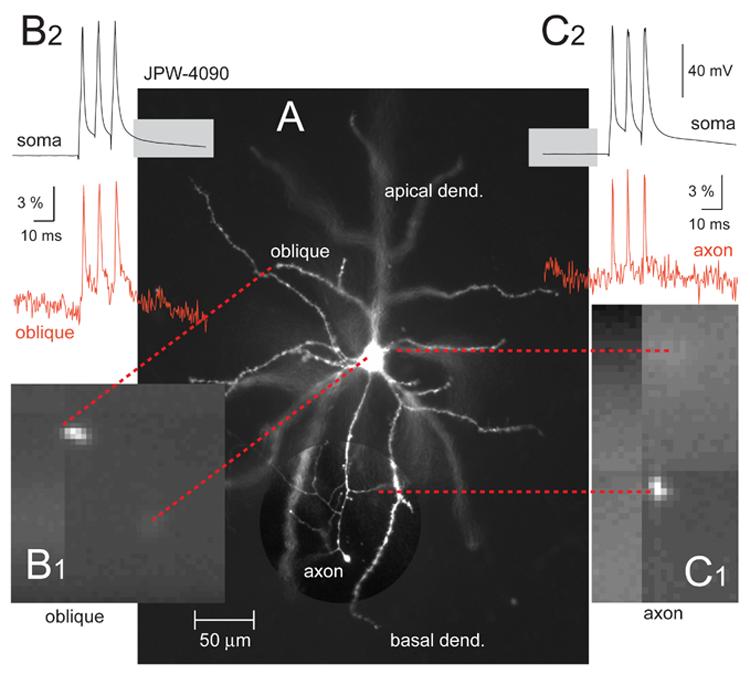
(A) Microphotograph of a layer 5 pyramidal neuron filled with blue VSD JPW-4090. Region containing axon is shown with enhanced contrast. (B1) One movie frame captured by data acquisition camera at 2.7 kHz frame rate. Only the distal tip of the oblique branch is positioned inside the laser illumination spot. Dashed red lines connect corresponding structures. (B2) Simultaneous whole-cell (black) and optical (red) recording of an AP triplet. Optical signal was sampled from the oblique branch at distance of 128 μm from the soma. (C1) Same as in B1 except axon is being imaged. (C2) Optical signals (red) were sampled from short axonal segment (∼20 μm length) right at the first branch point (distance from soma = 114 μm). Optical signal is product of 4 averaging.
Table 2.
Evaluation of red and blue voltage-sensitive dyes intracellularly applied to cortical pyramidal neurons in brain slices.
| Dye | Red | Blue | ||||||
|---|---|---|---|---|---|---|---|---|
| JPW3028 | JPW3080 | JPW6003 | JPW4090 | PY-1261 | PY-1268 | PY-1286 | PY-1266 | |
| n (Cells) | 41 | 11 | 2 | 21 | 2 | 3 | 8 | 8 |
| N (dends.) | 155 | 26 | 3 | 54 | 7 | 6 | 19 | 23 |
| Diffusion rate, subjectively | Typical | Fast | Very slow | Typical | Fast | Slow | Typical | Fast |
| Dye loading time (min) | 29.6 ± 3.7 | 26.8 ± 3.4 | NDA | 34.9 ± 11.1 | NDA | NDA | 52.3 ± 6.7 | 32.5 ± 7.8 |
| Incubation time (min) | 75.7 ± 19.5 | 54.0 ± 35.2 | NDA | 69.5 ± 37.8 | NDA | NDA | 83.3 ± 43.7 | 58.5 ± 13.4 |
| Simple filling time (min) | 33.3 ± 5.8 | 43.1 ± 4.5 | 46.5 ± 12.0 * | 58.3 ± 12.2 | 32.5 ± 3.5 | 55.0 ± 8.2 * | 50.0 ± 10.0 | 45.8 ± 8.2 |
| dF/F at 658 nm | NDA | 5.13 ± 1.20 | 1.23 ± 0.66 | 11.03 ± 2.24 | 7.91 ± 1.57 | 5.89 ± 3.41 | 7.64 ± 2.20 | 8.32 ± 2.13 |
| dF/F at 633 nm | { at 532 nm = 6.14 ± 1.67} | NDA | NDA | 12.70 ± 3.59 | NDA | NDA | 13.67 ± 2.89 | 10.41 ± 2.80 |
| S/N ratio at 658 nm | NDA | 6.20 ± 2.29 | 4.97 | 6.93 ± 1.88 | 5.38 ± 1.86 | 4.44 ± 0.75 | 5.13 ± 2.31 | 5.22 ± 1.32 |
| S/N ratio at 633 nm | { at 532 nm = 5.95 ± 2.16} | NDA | NDA | 5.48 ± 2.01 | NDA | NDA | 4.53 ± 0.95 | 4.77 ± 1.35 |
3.5. Voltage sensitivity (ΔF/F)
All evaluations of signal amplitude (ΔF/F) were performed in basal dendrites 80-150 μm from the soma, using backpropagating action potential as a biological paradigm. Individual APs were triggered by short (1.5 – 2 ms) pulses of direct somatic current injection. Experimental measurements performed on 55 neurons stained with 7 voltage sensitive dyes showed that blue dyes JPW-4090, PY-1261, PY-1286 and PY-1266 had better sensitivity than red dye JPW-3028 (n=41). The fractional change ΔF/F (change in light intensity divided by the resting light intensity) obtained in present study using abovementioned blue dyes and laser illumination (633 nm) was in the range 10-13%. Compare this to 3-4% obtained in early experiments on basal dendrites using red dye and whole-field illumination with Xenon arc lamp (Antic, 2003).
Laser spot illumination (Methods) effectively reduces background fluorescence. Background fluorescence no longer contributes to resting light intensity (F) and this is why laser experiments yield better ΔF/F than whole-field illumination technique. So, the comparison of laser-excited blue dye signal with arc lamp-excited red dye signal is somewhat unfair. In order to obtain a fair comparison we carried out a series of experiments in which red dyes were also spot-excited with laser light. When red dye JPW-3028 was excited with laser spot illumination (532 nm) the average ΔF/F from basal dendrites has risen to 6.14 ± 1.67 %; n=41 (Table 2). This ΔF/F was still smaller than average ΔF/F obtained with 4 blue dyes (JPW-4090, PY-1286, PY-1261 and PY-1266) excited with either 633 nm or 658 nm laser spot illumination (Table 2).
Better sensitivity of blue dyes (ΔF/F) does not necessarily translate into better signal-to-noise ratio. In the example shown in Fig. 4A, AP-associated optical signal captured with blue dye JPW-4090 in the basal dendrite (80 μm from the soma) measured 17 % ΔF/F (base line-to-peak). In the basal dendrite of a different neuron filled with red dye JPW-3028, AP-associated optical signals measured only 5% ΔF/F (Fig. 4B2). Off line scaling of two signals (Fig. 4A3-B3) showed that in spite of the 3-fold larger ΔF/F, blue-dye-signals still exhibited worse signal-to-noise ratio than red-dye-signals. For this reason, the average signal-to-noise ratios of the best blue dyes (6.93 ± 1.88 for JPW-4090 and 5.13 ± 2.31 for PY-1286; n=29) were not statistically better than the average S/N obtained in 41 neurons stained with red dye (Table 2).
Fig. 4. Comparison of signal amplitude and signal-to-noise ratio between blue (JPW-4090) and red (JPW-3028) voltage-sensitive dye.
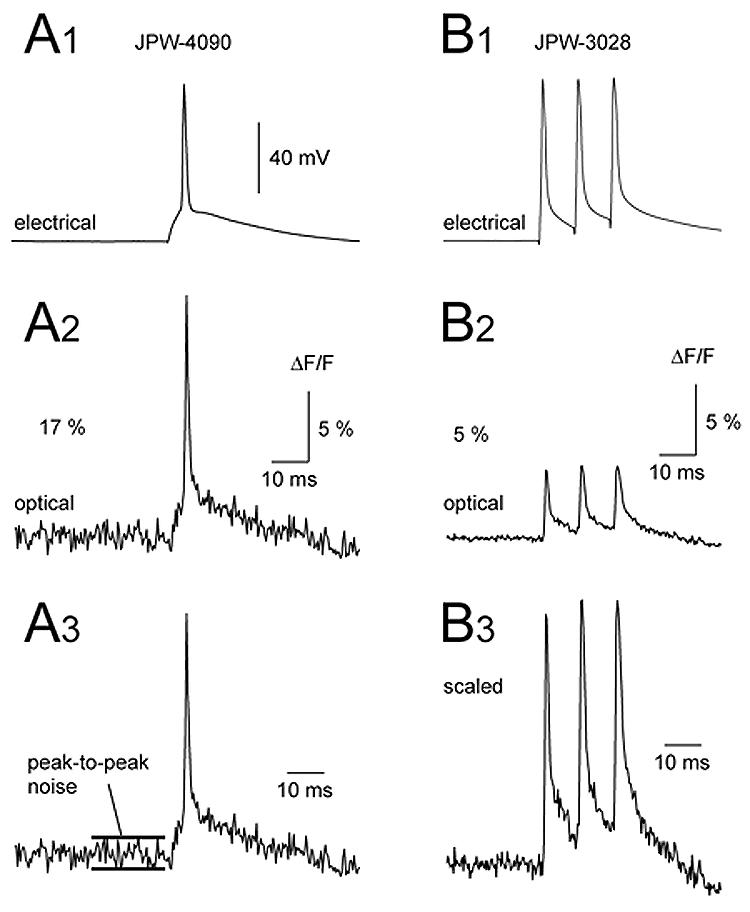
(A1) Whole-cell recording of a single AP. (A2) Simultaneous optical recording from the basal dendritic segment 100 μm away from the soma, using blue dye JPW-4090. (B1-B2) same as in A1-A2 except different neuron, different dye (red dye JPW-3028). Note that amplitude of the optical signal obtained with blue dye (A2) is approximately 3 times stronger than the one obtained with red dye (B2). Both signals are products of spatial averaging (3 pixels) and temporal averaging (4 sweeps). Panels A3 and B3 show two optical signals scaled to the same height. The signal-to-noise ratio in the blue dye recording is actually worse than in the red dye recording.
3.6. Light scattering
Besides an increase in ΔF/F the laser excitation technique also improved the spatial resolution of our optical recordings. The spot laser illumination approach reduced the amount of light scattering in acute brain slice preparation. The previous experimental study (Antic, 2003) and present study were both performed on the same microscope, using identical optics and biological preparation. This allowed us to make direct comparisons. For example, in the experiments with red VSDs and whole-field illumination (Antic, 2003), the fluorescent light (and hence the optical signal) from one basal branch, was often scattered over 2-3 neighboring pixels. In present experiments the optical signal was only present at those pixels receiving direct fluorescent light from the region of interest (Fig. 5Aa, pixel 1). Pixels adjacent to the one receiving direct fluorescent light did not carry a detectable biological signal, due to a sharp fall in resting light intensity (Fig. 5B, pixels 2 and 3).
Fig. 5. Light scattering.
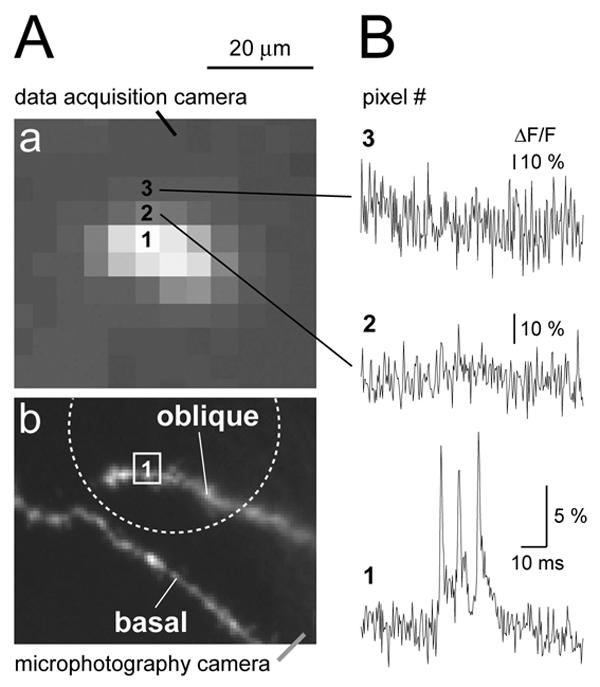
(Aa) Same as in Fig. 3B1. The tip of the oblique branch is blown up to show individual pixels. (Ab) The same structure as in Aa captured with higher resolution camera. Dotted circle indicates the position and size of the laser illumination spot. The basal branch was intentionally left outside of the bright spot. (B) Optical signals from three neighboring pixels marked by numbers in Aa. Biological signal (triplet of APs) is only present in the pixel #1, which receives direct light from oblique dendrite. Note that amplitude scales in pixels #2 and #3 are ∼3 and ∼5 time-blowup of the scale in the bottom trace.
In addition to eliminating the smearing (scattering) of the optical signal, the laser spot illumination technique has proven excellent in eliminating the background fluorescence – fluorescent light emanating from areas out of focus and outside the region of interest (ROI). For instance, fluorescent objects of less than 20 μm away from the ROI were deliberately positioned outside the laser spot and therefore did not contribute any light to our ROI (Fig. 5A, lower). This was done by placing the edge of the illuminated spot (Fig. 5Ab, dashed circle) between the two bright objects (oblique and basal dendrite). This approach is very useful in regions of the dendritic tree with juxtaposed branches. In cortical layer 5 pyramidal cells, such regions are commonly found in the basilar and apical tuft dendritic arbors.
3.7. Spatial and temporal averaging
In previous work (Antic, 2003) we typically averaged optical signals from 6-9 adjacent pixels (spatial averaging) in order to bring signal-to-noise ratio above 5 (red dye JPW-3028). Thanks to the sensitivity and brightness of the blue dyes, a signal-to-noise ratio greater than 5 was frequently obtained from a single pixel output (Fig. 5B, pixel 1) (n = 13).
In terms of temporal averaging, the excellent sensitivity of blue dyes, naturally, reduced the demand for a large number of sweeps. In a recent study employing red voltage-sensitive dye (JPW-3028), in order to achieve reasonable signal-to-noise ratios from axons of cortical pyramidal cells, the authors had to average up to 200 sweeps (Palmer and Stuart, 2006). Extensive averaging is necessary when the voltage-dependent optical signal is very small and buried in the high-frequency noise. In studies of action potential initiation and propagation, extensive averaging carries several potential problems. First, the small jitter in the timing of AP and changes in AP shape from trial to trial produce an averaged result that is somewhat distorted in the time domain. Second, the fact that the signal is buried in noise precludes on line monitoring and detection of AP failures from trial to trial. The inclusion of failed and partially failed APs in the averaged result introduces distortions in amplitude and shape of the signal. Finally, repeated illumination of the same cellular compartment may cause photodynamic damage and severely impair the membrane physiology (Antic et al., 1999).
Blue voltage sensitive dyes greatly diminished our dependence on temporal averaging. In the present study we needed ∼9 averages to record individual action potentials in axonal segments 200 μm away from the cell body, and achieve a signal-to-noise ratio around 10 (Fig. 6A) (n=12). In axonal regions at less than 100 μm away from the cell body excellent signal-to-noise ratios (∼10) were regularly attained in less than 6 sweeps (Fig. 6B). Most importantly, blue voltage-sensitive dyes allowed us to reliably detect AP signal in single trial measurements (Fig. 6C, sweep 1-4). In summary, our new experimental design based on blue VSDs allows on-line monitoring of the success rate of AP invasion in trial-to-trail mode.
Fig. 6. Temporal averaging with blue VSDs.
Excellent sensitivity of blue VSDs, combined with laser spot illumination approach, diminishes the need for extensive temporal averaging. (A) A single action potential was recorded in axonal segment 185 μm away from the cell body using only 9 averages. (B) Closer to the cell body (85 μm) only 6 sweeps were needed to produce signal-to-noise ratio > 10. (C) Four out of 6 individual sweeps used to generate optical signal shown in B. Note that axonal AP can be detected in single sweep measurements (sweeps 1 – 4).
3.8. Toxicity
Toxic effects of red voltage sensitive dyes (JPW-1114 and JPW-3028) are manifested by an increase in AP duration (Antic et al., 1999). Accumulation of reactive oxygen species (free radicals), which interact with and damage neuronal plasmalemma, is the most likely mechanism (Feix and Kalyanaraman, 1991). High intensity illumination during optical recording sessions excites large number of membrane bound dye molecules. Since styryl dyes have tendency to penetrate deep into the lipid bilayers (Fluhler et al., 1985), free radicals are produced literally inside the neuronal membrane. In the previous work it was difficult to obtain more than 25 illumination (recording) sweeps (100 ms each) from one neuron, before AP showed increase in half-width (Antic, 2003). In present study, the number of optical recording sessions (100 ms each) surpassed the old result by a factor of 4. For example, in 8 neurons stained with blue dye JPW-4090 the number of optical recording sweeps exceeded 100 without causing any change in AP half-width (Fig. 7G, Fig. 8C). During 100 minutes-long optical recording sessions (Fig. 8D), we lost more neurons due to bad access resistance or mechanical drift of the patch pipette, than to photodynamic damage induced by blue VSDs. Since dye loading was always done at room temperature (21 °C) and re-patching at 34 °C, we could not compare AP shape and size before and after dye loading. Therefore, in order to check the extent of dye toxicity we designed a group of experiments in which neurons were injected and incubated at 34 °C. During the dye injection (loading phase), in regular time intervals (3-5 min) direct current pulses was used to slowly charge the membrane and trigger an AP (Fig. 7A). Identical current pulse was then applied at the end of dye loading phase, just before the electrode pull-out (Fig. 7B) and after the 50-90 min incubation period (Fig. 7C, re-patch). Optical recordings were performed on basal dendrites and axons in a standard protocol (typically, a total of 5-6 regions, 3 to 25- sweeps averaging per region). To avoid AP jitter in optical recordings we used shorter and stronger current pulses (Fig. 7DEF, insets). However, from time to time we returned to AP-testing current injection protocol (Fig. 7DE), while keeping the count on the number of cumulative high-intensity light exposures (# sweeps). The plot of AP half-width versus the entire course of the experiment (time), including the dye loading phase, and measurement performed in the first minute after the “break in” (point 0 min), shows that blue dye JPW-4090, did not induce any AP broadening up to 177 optical sweeps, or 192 minutes since the beginning of the dye injection (Fig. 7G). All of the blue dyes (Table 1) seem to exert minimal toxic effects on AP duration. As in the case of JPW-4090, recording sessions more often ended due to problems with whole-cell recordings, than with photodynamic damage; yielding on average 114 ± 67 (mean±s.d.; n=12) sweeps. In experiments using red VSD dye JPW-3028 we managed to record 86 ± 28 sweeps before the AP half-width grew by more than 15% from the control value (n=12). The slope of the linear fit for JPW-3028 (Fig. 8A, black line; y=0.0027) was notably larger than the one obtained with JPW-4090 (Fig. 8C; y=0.0003). These data show that under current experimental conditions blue VSDs exerted less photodynamic damage than red VSDs.
Fig. 7. Monitoring AP dynamics during the course of experiment.
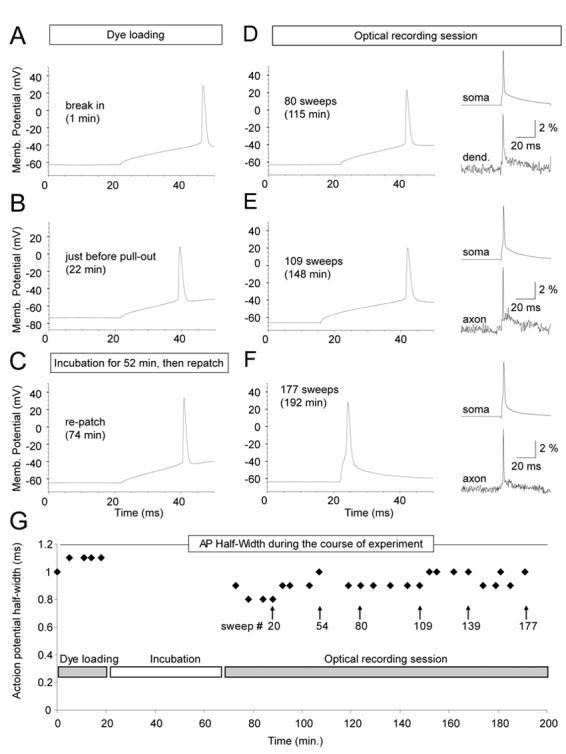
(A – F) Direct current injection (120 pA, 50 ms, standard pulse) was used to trigger somatic AP in different phases of the voltage-imaging experiment. Insets (D-F): simultaneous somatic (whole-cell) and dendrite or axonal (VSD) recording of current-evoked single AP. (G) Plot of AP half-width versus time during the entire course of experiment. APs were probed by standard current pulse during the dye injection phase (Dye loading) and during voltage-imaging (Optical recording session). Patch pipette was not on the cell during Incubation.
Fig. 8. Change of AP half-width during the optical recording session.
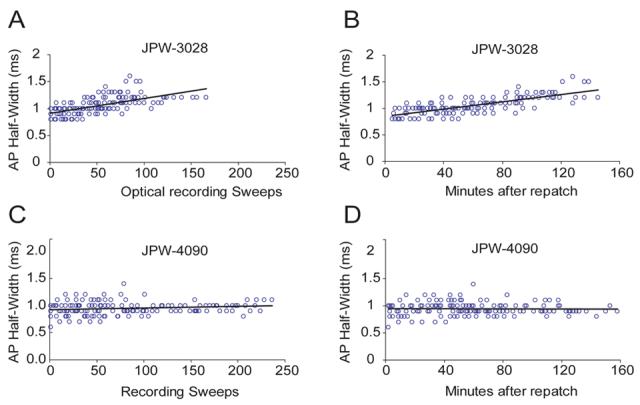
(A) AP half-width is plotted versus the number of cumulative optical recording sweeps. Sweep duration = 100 ms. Intracellularly applied red VS dye JPW-3028 was used for dendritic voltage imaging. Group data from 12 neurons. (B) Same data as in A. Instead of cumulative sweeps, time from re-patch (0 min) was used in X-axis. (C – D) Same as in A and B - but different intracellular dye (JPW-4090). Group data from 12 neurons. Black lines represent linear fits.
4. Discussion
Given the complexity of signal processing in CNS neurons (Larkum et al., 2001; Gulledge et al., 2005; London and Hausser, 2005), one of the goals of modern experimental neurophysiology is to simultaneously sample electrical activity from multiple sites in the axo-dendritic tree. Conventional recording techniques are ill-suited for recordings from thin dendritic branches, especially for simultaneous multi-site dendritic recordings (Nevian et al., 2007). An important alternative to glass electrode technique is voltage-sensitive dye imaging (Meyer et al., 1997; Bullen and Saggau, 1999; Petersen and Sakmann, 2001; Tominaga et al., 2002; Kasuga et al., 2003). Due to high background fluorescence extracellular VSD staining is not an optimal approach for recording from individual dendritic branches of neurons in situ (e.g. invertebrate ganglion or brain slice). In “single-cell” studies, an intracellular injection of dyes (Grinvald et al., 1987; Zecevic and Antic, 1998) regularly yields better results than extracellular staining approaches (Ross and Krauthamer, 1984). However, major problems with intracellular application of voltage-sensitive dyes include small signals (poor sensitivity), slow diffusion through intracellular space, and pronounced toxicity. The three above mentioned factors greatly reduce the success rate of experiments.
4.1. Evaluation of new VSD
We designed and synthesized a new family of voltage-sensitive dyes for intracellular application. We tested new molecules in layer 5 pyramidal cells (n=55). Experiments were performed in acute brain slices. Acute brain slice preparation (300 μm thick) preserves neuronal morphology, synaptic contacts, the surrounding glia, extracellular matrix, and thus provides a more strenuous environment for optical recordings than chronically cultured brain slices (typically 50 μm thick) or cultured neurons (Grinvald et al., 1981). All newly synthesized dyes were injected into the cell body and only recordings in basal dendrites (50 – 150 μm from the soma) were used for evaluation of the dye performance (Table 2). In comparison to previously used intracellular dyes (red dyes JPW-1114 and JPW-3028), the new blue dyes have 3 critical advantages. First, optimal excitation windows of blue dyes are shifted toward longer wavelengths (deep red, Table 1), and, consequently, the emission spectra of blue dyes reside in infrared part of the spectrum. Both, deep-red and infra-red photons penetrate brain tissue better than photons of shorter wavelength (green). The long-wavelength excitation and emission of new voltage-sensitive probes may prove beneficial for in vivo dendritic imaging. It has been established lately that in vivo functional imaging (e.g. calcium imaging) of dendritic branches positioned a few hundred micrometers below the brain surface requires both photons of longer wavelength and high illumination intensity, typically achieved with laser-powered light sources. Both requirements, long-wavelength and laser excitation, have been met in this study (Figs. 1-6). We successfully combined blue voltage-sensitive dyes with single-photon laser lines 633 and 658 nm. Although, the power output of our lasers was far below that used in commercially available imaging systems (e.g. compare 20 mW HeNe laser to 5 W Verdi, Coherent), we obtained excellent signal-to-noise ratio in recordings from basal dendrites (Table 2) and axons of cortical pyramidal neurons (Fig. 3C2).
The second advantage of blue VSDs is in respect to voltage sensitivity (Fig. 4). In comparison to red dyes (also excited with laser spot illumination) blue dyes yielded on average 40% better ΔF/F (Table 2). This feature of blue dyes is important for recordings from terminal dendrites and remote dendritic segments that are notoriously difficult to fill with lipophilic fluorescent dyes, using the soma as an injection site. A common experimental procedure for dealing with small optical signals is temporal averaging (Palmer and Stuart, 2006). In some experimental designs, however, it is difficult to maintain robust physiological signal in repeated recording trials. When biological signal shows great trial-to-trial variations in size, duration or dynamics, it is necessary to capture such signals in single sweep measurements (Fig. 6). In other kind of experiments, it is necessary to obtain recordings before, during and after application of drugs. Extensive averaging increases the duration of already long experiments, and increases the risk of losing the cell. A better sensitivity of voltage-sensitive dyes (Table 2) is expected to improve both the design and the success rate of future experiments.
The third advantage of blue dyes is regarding the toxic effect that internally applied voltage-sensitive dyes exert on neuronal physiology. In comparison to red dyes, the new blue dye JPW-4090 causes less neuronal damage and allow longer recording sessions (Fig. 8). The change in AP half-width, which is the first sign of intracellular voltage-sensitive dye toxicity (Antic et al., 1999), occurred much sooner with red dyes (on average 35 ± 12 recordings sweeps) than with blue dyes (91 ± 49 recording sweeps; Figs. 7 and 8).
It is important to note that structural composition of blue VS dyes, which resulted in spectral shift, better sensitivity, and less toxicity, has not compromised the intracellular diffusion rate of these molecules. The speed with which VSD travels from the injection site (soma) into dendrites and axons is perhaps the most critical characteristic of a successful voltage probe. Early attempts in intracellular staining of individual neurons yielded moderate success (Grinvald et al., 1987), because VSD of that time were simply inadequate for internal application; the dyes were too lipophilic. Early VSD dyes (e.g. Di-4-ANEPPS) were difficult to dissolve in intracellular solution and difficult to eject through a glass pipette. Even if one succeeded to fill the cell body, lipophilic dyes would not travel fast enough from the soma into the axo-dendritic tree. Optical recordings of dendritic action potentials improved by factor of ∼100 with the advent of water-soluble voltage-sensitive dyes (Antic et al., 1992; Antic and Zecevic, 1995). This example documents the practical importance of finding the means to stain dendritic membrane adequately prior to attempting voltage imaging. In our experience, the loading of dendritic membrane with dye molecules is a critical step in this experimental method. For this reason we carefully measured the period of time required to fill the cell body, as well as the period of time required for dye molecules to diffuse from the soma into dendrites and yield action potential associated optical signals (Table 2). The intracellular diffusion rate of a given blue voltage-sensitive dye correlated with the length of the alkyl side-chain attached to the aminonaphthyl functional group. Voltage-sensitive dyes with 4 carbon atoms in the side-chain (JPW-6003 and PY-1266 without cyclodextrin capsule) required much longer loading times than dyes with one carbon atom (JPW-3028, JPW-3080) or two (JPW-4090, PY-1261, PY-1268, PY-1286) carbon atoms in the side chain (Table 1 and 2). VSD with 4 carbon atoms in the side-chain (JPW-6003 and PY-1266) produced poor dendritic staining even after more than 60 min of simple filling (data not shown). As a matter of fact, we could not obtain AP-associated optical signals from dendrites using cyclodextrin-free JPW-1266 or JPW-6003. Note that JPW-6003 signals presented in Table 2 were obtained from the cell body (n=2), while PY-1266 dendritic signals in Table 2 are obtained with gamma-cyclodextrine complex, which greatly improves the water solubility of PY-1266 molecule (Wuskel et al., 2006). Our measurements show that majority of new blue dyes have intracellular diffusion rates identical or very close to the one obtained with the best red dye JPW-3028 (Table 2, Simple filling time).
4.2. Potential applications for blue dyes
As a general principle, blue voltage sensitive dyes can be applied in all physiological measurements that previously employed red dyes (Kogan et al., 1995; Zecevic, 1996; Milojkovic et al., 2005; Palmer and Stuart, 2006). In the present study, we successfully used blue dyes for monitoring the dynamics of action potentials in basal dendrites and axons of pyramidal neurons (Fig. 3). The quality of recording was such that single action potentials were reliably detected in single-sweep measurements – no averaging (Fig. 6C). Single-sweep measurements are extremely useful for studying the temporal characteristics of action potential invasion into the branched neuronal processes, such as second and third order dendrites and axon collaterals (Cox et al., 2000). Signal to noise ratio better than 5, obtained in single sweep measurements (fig. 6C), allows precise evaluation of AP success rate in invading different cellular compartments on trial-to-trail bases. Extensive averaging procedures, by definition, cannot be used for this kind of analysis.
The experimental design implemented in present study made it possible to record individual action potentials from several regions of interest on the same cell. Figure 3 shows the first published recording of AP in the oblique dendrite and distal axonal segment of the same pyramidal cell. Previous studies based on patch clamp recordings already achieved simultaneous probing of pyramidal dendrite and axon in the same cell (Stuart et al., 1997a) thus providing the strongest support for axonal AP initiation hypothesis (Stuart et al., 1997b; Larkum et al., 2001). However, due to the nature of the patch clamp technique, the axonal recording sites were restricted to the proximal 30 μm, and dendritic recording sites were restricted to thick apical trunk. Here, the voltage-sensitive dye technique was able to extend the axonal area of interest to proximal 200 μm. Instead of 200 sweeps used to sample AP in axons (Palmer and Stuart 2005), thanks to improved features of blue voltage sensitive dyes, we needed less than 10 sweeps to achieve good signal-to-noise ratio (Fig. 3C2; Fig. 6). In regards to the dendritic recording site, the optical approach allows the investigator to move from thick apical trunks into thinner dendritic branches (basal or oblique dendrites, Fig. 3) where majority of afferent synaptic inputs impinge. With the advent of near infra-red video imaging and two-photon fluorescence live overlay {Nevian, 2007 #1654}, direct electrical recordings continue to have advantages in sensitivity and accuracy over voltage-sensitive dye recordings. The major advantages of voltage-sensitive dye imaging continue to be (1) simultaneous multi-site recordings, as well as (2) recordings from cellular compartments which are still inaccessible to glass electrode approach (e.g. basal dendrites more than 140 μm away from the soma, or intact axons more than 35 μm away from the soma).
4.3. Experimental cost
Functional probing of small cellular regions comes with substantial financial cost directed towards expensive and elaborate experimental equipment. Due to high cost such equipment is available to a very limited number of researchers (Nevian et al., 2007). All data in the present project was acquired using standard low-cost light microscope and low-cost laser (Methods). In comparison to experimental setups implementing two-photon technology, for example, the present assembly costs ∼20 fold less, and thus could potentially be implemented in a greater number of laboratories interested in dendritic physiology and signal processing.
4.4. Problems and shortcomings of blue dyes
The new dyes have some shortcomings. First, in comparison to red dyes which show exceptional shelf stability for months, blue dyes deteriorate quite rapidly (one week) in water-based (intracellular) solution, even when stored at −20°C; they are quite stable in organic solvent stock solutions, however. Second, some blue dyes (PY-1286 and PY-1261) show extreme photobleaching. Illumination pulses as short as 1 second caused the thinnest dendritic segments to disappear in front of our eyes. This feature of PY-1286 and PY-1261 could potentially be used in diffusion studies which rely on rapid bleaching of fluorescent intracellularly applied probes (Svoboda et al., 1996; Majewska et al., 2000). Third, we have not been able to obtain signal-to-noise ratio that would substantially surpass the one generated with red dye JPW-3028. In our experimental setup the red lasers used to excite blue dyes (Methods) generated smaller power output than the green laser used to excite JPW-3028. Signal-to-noise ratio in VSD measurements is directly proportional to the number of excited photons (Zochowski et al., 2000) and it appears that our excitation efficiency in green spectrum was greater than in deep red, thus resulting in similar S/N ratio in spite of better ΔF/F for blue dyes. This problem could in theory be solved with more powerful red lasers (80 mW used in this study), and with more efficient laser-to-microscope optical coupling.
The most regrettable deficiency of dendritic voltage imaging with internally applied voltage-sensitive dyes is the lack of signal calibration in terms of absolute size. This problem existed in previous work with red dyes (Zecevic and Antic, 1998; Antic, 2003), and it continues to be present in experiments with blue dyes. For example, the amplitude of the dendritic transient (in mV) cannot be determined based on calibration of optical signal performed at the soma. The sensitivity of optical measurements, expressed as Δ_F/F_ (light intensity change/ resting light intensity) varies among different parts of the cell (e.g. soma vs. dendrite). This is the consequence of the internal application of the voltage-sensitive dye. The lipophilic fluorescent dye is bound to both the plasmalemma and intracellular membranes, and both populations of dye molecules (reporting and non-reporting) contribute to the resting fluorescence level F. The distribution of dye-stained intracellular membranous organelles in the soma and across the dendritic tree is quite variable, so dividing the optical signal Δ_F_ by F does not eliminate this uncertainty in the results. In spite of these shortcomings, the synthesis of blue voltage-sensitive dyes for intracellular application combined with laser-spot illumination technique represents a conceptual and practical advance in dendritic voltage imaging.
Acknowledgment
We are grateful to Andrew Millard for help with laser-to-microscope optical coupling. This work was supported by NIH grants MH63035 to S.A. and EB001963 to L.L.
Footnotes
Publisher's Disclaimer: This is a PDF file of an unedited manuscript that has been accepted for publication. As a service to our customers we are providing this early version of the manuscript. The manuscript will undergo copyediting, typesetting, and review of the resulting proof before it is published in its final citable form. Please note that during the production process errors may be discovered which could affect the content, and all legal disclaimers that apply to the journal pertain.
References
- Antic S, Zecevic D. Optical signals from neurons with internally applied voltage-sensitive dyes. Journal of Neuroscience. 1995;15:1392–1405. doi: 10.1523/JNEUROSCI.15-02-01392.1995. [DOI] [PMC free article] [PubMed] [Google Scholar]
- Antic S, Major G, Zecevic D. Fast optical recordings of membrane potential changes from dendrites of pyramidal neurons. Journal of Neurophysiology. 1999;82:1615–1621. doi: 10.1152/jn.1999.82.3.1615. [DOI] [PubMed] [Google Scholar]
- Antic S, Loew LM, Wuskell JP, Zecevic D. Voltage-sensitive Dyes for Intracellular Application. Biol Bull. 1992;183:350–351. doi: 10.1086/BBLv183n2p350. [DOI] [PubMed] [Google Scholar]
- Antic SD. Action potentials in basal and oblique dendrites of rat neocortical pyramidal neurons. Journal of Physiology. 2003;550:35–50. doi: 10.1113/jphysiol.2002.033746. [DOI] [PMC free article] [PubMed] [Google Scholar]
- Bullen A, Saggau P. High-speed, random-access fluorescence microscopy: II. Fast quantitative measurements with voltage-sensitive dyes. Biophysical Journal. 1999;76:2272–2287. doi: 10.1016/S0006-3495(99)77383-2. [DOI] [PMC free article] [PubMed] [Google Scholar]
- Canepari M, Djurisic M, Zecevic D. Dendritic signals from the rat hippocampal CA1 pyramidal neurons during coincident pre- and post-synaptic activity: a combined voltage- and calcium-imaging study. J Physiol. 2007;580:463–484. doi: 10.1113/jphysiol.2006.125005. [DOI] [PMC free article] [PubMed] [Google Scholar]
- Cohen LB, Lesher S. Optical monitoring of membrane potential: methods of multisite optical measurement. Society of General Physiologists Series. 1986;40:71–99. [PubMed] [Google Scholar]
- Cohen LB, Davila HV, Waggoner AS. Changes in axon fluorescence. Biological Bulletin. 1971;141:382–383. [Google Scholar]
- Cox CL, Denk W, Tank DW, Svoboda K. Action potentials reliably invade axonal arbors of rat neocortical neurons. Proc Natl Acad Sci U S A. 2000;97:9724–9728. doi: 10.1073/pnas.170278697. [DOI] [PMC free article] [PubMed] [Google Scholar]
- Denk W, Strickler JH, Webb WW. Two-photon laser scanning fluorescence microscopy. Science. 1990;248:73–76. doi: 10.1126/science.2321027. [DOI] [PubMed] [Google Scholar]
- Denk W, Delaney KR, Gelperin A, Kleinfeld D, Strowbridge BW, Tank DW, Yuste R. Anatomical and functional imaging of neurons using 2-photon laser scanning microscopy. Journal of Neuroscience Methods. 1994;54:151–162. doi: 10.1016/0165-0270(94)90189-9. [DOI] [PubMed] [Google Scholar]
- Djurisic M, Antic S, Chen WR, Zecevic D. Voltage imaging from dendrites of mitral cells: EPSP attenuation and spike trigger zones. J Neurosci. 2004;24:6703–6714. doi: 10.1523/JNEUROSCI.0307-04.2004. [DOI] [PMC free article] [PubMed] [Google Scholar]
- Dombeck DA, Sacconi L, Blanchard-Desce M, Webb WW. Optical recording of fast neuronal membrane potential transients in acute mammalian brain slices by second-harmonic generation microscopy. J Neurophysiol. 2005;94:3628–3636. doi: 10.1152/jn.00416.2005. [DOI] [PubMed] [Google Scholar]
- Elston GN. Cortex, cognition and the cell: New insights into the pyramidal neuron and prefrontal function. Cerebral Cortex. 2003;13:1124–1138. doi: 10.1093/cercor/bhg093. [DOI] [PubMed] [Google Scholar]
- Feix JB, Kalyanaraman B. Production of singlet oxygen-derived hydroxyl radical adducts during merocyanine-540-mediated photosensitization: analysis by ESR-spin trapping and HPLC with electrochemical detection. Archives of Biochemistry & Biophysics. 1991;291:43–51. doi: 10.1016/0003-9861(91)90103-p. [DOI] [PubMed] [Google Scholar]
- Fluhler E, Burnham VG, Loew LM. Spectra, membrane binding, and potentiometric responses of new charge shift probes. Biochemistry. 1985;24:5749–5755. doi: 10.1021/bi00342a010. [DOI] [PubMed] [Google Scholar]
- Gasparini S, Losonczy A, Chen X, Johnston D, Magee JC. Associative pairing enhances action potential back-propagation in radial oblique branches of CA1 pyramidal neurons. J Physiol. 2007;580:724–736. doi: 10.1113/jphysiol.2006.121343. [DOI] [PMC free article] [PubMed] [Google Scholar]
- Gilbert CD. Laminar differences in receptive field properties of cells in cat primary visual cortex. J Physiol. 1977;268:391–421. doi: 10.1113/jphysiol.1977.sp011863. [DOI] [PMC free article] [PubMed] [Google Scholar]
- Grinvald A, Ross WN, Farber I. Simultaneous optical measurements of electrical activity from multiple sites on processes of cultured neurons. Proc Natl Acad Sci U S A. 1981;78:3245–3249. doi: 10.1073/pnas.78.5.3245. [DOI] [PMC free article] [PubMed] [Google Scholar]
- Grinvald A, Salzberg BM, Lev-Ram V, Hildesheim R. Optical recording of synaptic potentials from processes of single neurons using intracellular potentiometric dyes. Biophys J. 1987;51:643–651. doi: 10.1016/S0006-3495(87)83389-1. [DOI] [PMC free article] [PubMed] [Google Scholar]
- Gulledge AT, Kampa BM, Stuart GJ. Synaptic integration in dendritic trees. J Neurobiol. 2005;64:75–90. doi: 10.1002/neu.20144. [DOI] [PubMed] [Google Scholar]
- Hassner A, Birnbaum D, Loew LM. Charge Shift Probes of Memrane Potential. Synthesis. J Org Chem. 1984;49:2546–2551. [Google Scholar]
- Kampa BM, Stuart GJ. Calcium spikes in basal dendrites of layer 5 pyramidal neurons during action potential bursts. J Neurosci. 2006;26:7424–7432. doi: 10.1523/JNEUROSCI.3062-05.2006. [DOI] [PMC free article] [PubMed] [Google Scholar]
- Kasuga A, Enoki R, Hashimoto Y, Akiyama H, Kawamura Y, Inoue M, Kudo Y, Miyakawa H. Optical detection of dendritic spike initiation in hippocampal CA1 pyramidal neurons. Neuroscience. 2003;118:899–907. doi: 10.1016/s0306-4522(03)00061-7. [DOI] [PubMed] [Google Scholar]
- Kogan A, Ross WN, Zecevic D, Lasser-Ross N. Optical recording from cerebellar Purkinje cells using intracellularly injected voltage-sensitive dyes. Brain Research. 1995;700:235–239. doi: 10.1016/0006-8993(95)00956-q. [DOI] [PubMed] [Google Scholar]
- Larkman AU. Dendritic morphology of pyramidal neurones of the visual cortex of the rat: III. Spine distributions. Journal of Comparative Neurology. 1991;306:332–343. doi: 10.1002/cne.903060209. [DOI] [PubMed] [Google Scholar]
- Larkum ME, Zhu JJ, Sakmann B. Dendritic mechanisms underlying the coupling of the dendritic with the axonal action potential initiation zone of adult rat layer 5 pyramidal neurons. Journal of Physiology. 2001;533:447–466. doi: 10.1111/j.1469-7793.2001.0447a.x. [DOI] [PMC free article] [PubMed] [Google Scholar]
- Leventhal AG, Hirsch HV. Receptive-field properties of neurons in different laminae of visual cortex of the cat. J Neurophysiol. 1978;41:948–962. doi: 10.1152/jn.1978.41.4.948. [DOI] [PubMed] [Google Scholar]
- Loew LM. How to choose a potentiometric membrane probe. In: Loew LM, editor. Spectroscopic Membrane Probes. CRC Press; Boca Raton: 1988. pp. 139–152. [Google Scholar]
- Loew LM. Voltage sensitive dyes and imaging neuronal activity. Neuroprotocols. 1994;5:72–79. [Google Scholar]
- Loew LM, Cohen LB, Salzberg BM, Obaid AL, Bezanilla F. Charge-shift probes of membrane potential. Characterization of aminostyrylpyridinium dyes on the squid giant axon. Biophys J. 1985;47:71–77. doi: 10.1016/S0006-3495(85)83878-9. [DOI] [PMC free article] [PubMed] [Google Scholar]
- London M, Hausser M. Dendritic computation. Annu Rev Neurosci. 2005;28:503–532. doi: 10.1146/annurev.neuro.28.061604.135703. [DOI] [PubMed] [Google Scholar]
- London M, Schreibman A, Hausser M, Larkum ME, Segev I. The information efficacy of a synapse. Nature Neuroscience. 2002;5:332–340. doi: 10.1038/nn826. [DOI] [PubMed] [Google Scholar]
- Majewska A, Brown E, Ross J, Yuste R. Mechanisms of calcium decay kinetics in hippocampal spines: role of spine calcium pumps and calcium diffusion through the spine neck in biochemical compartmentalization. J Neurosci. 2000;20:1722–1734. doi: 10.1523/JNEUROSCI.20-05-01722.2000. [DOI] [PMC free article] [PubMed] [Google Scholar]
- Markram H, Helm PJ, Sakmann B. Dendritic calcium transients evoked by single back-propagating action potentials in rat neocortical pyramidal neurons. Journal of Physiology. 1995;485:1–20. doi: 10.1113/jphysiol.1995.sp020708. [DOI] [PMC free article] [PubMed] [Google Scholar]
- Meyer E, Muller CO, Fromherz P. Cable properties of dendrites in hippocampal neurons of the rat mapped by a voltage-sensitive dye. European Journal of Neuroscience. 1997;9:778–785. doi: 10.1111/j.1460-9568.1997.tb01426.x. [DOI] [PubMed] [Google Scholar]
- Milojkovic BA, Radojicic MS, Goldman-Rakic PS, Antic SD. Burst generation in rat pyramidal neurones by regenerative potentials elicited in a restricted part of the basilar dendritic tree. J Physiol. 2004;558:193–211. doi: 10.1113/jphysiol.2004.061416. [DOI] [PMC free article] [PubMed] [Google Scholar]
- Milojkovic BA, Wuskell JP, Loew LM, Antic SD. Initiation of sodium spikelets in basal dendrites of neocortical pyramidal neurons. J Membr Biol. 2005;208:155–169. doi: 10.1007/s00232-005-0827-7. [DOI] [PMC free article] [PubMed] [Google Scholar]
- Miyakawa H, Ross WN, Jaffe D, Callaway JC, Lasser-Ross N, Lisman JE, Johnston D. Synaptically activated increases in Ca2+ concentration in hippocampal CA1 pyramidal cells are primarily due to voltage-gated Ca2+ channels. Neuron. 1992;9:1163–1173. doi: 10.1016/0896-6273(92)90074-n. [DOI] [PubMed] [Google Scholar]
- Montana V, Farkas DL, Loew LM. Dual-wavelength ratiometric fluorescence measurements of membrane potential. Biochemistry. 1989;28:4536–4539. doi: 10.1021/bi00437a003. [DOI] [PubMed] [Google Scholar]
- Nevian T, Larkum ME, Polsky A, Schiller J. Properties of basal dendrites of layer 5 pyramidal neurons: a direct patch-clamp recording study. Nat Neurosci. 2007;10:206–214. doi: 10.1038/nn1826. [DOI] [PubMed] [Google Scholar]
- Nuriya M, Jiang J, Nemet B, Eisenthal KB, Yuste R. Imaging membrane potential in dendritic spines. Proc Natl Acad Sci U S A. 2006;103:786–790. doi: 10.1073/pnas.0510092103. [DOI] [PMC free article] [PubMed] [Google Scholar]
- Palmer LM, Stuart GJ. Site of action potential initiation in layer 5 pyramidal neurons. J Neurosci. 2006;26:1854–1863. doi: 10.1523/JNEUROSCI.4812-05.2006. [DOI] [PMC free article] [PubMed] [Google Scholar]
- Petersen CC, Sakmann B. Functionally independent columns of rat somatosensory barrel cortex revealed with voltage-sensitive dye imaging. J Neurosci. 2001;21:8435–8446. doi: 10.1523/JNEUROSCI.21-21-08435.2001. [DOI] [PMC free article] [PubMed] [Google Scholar]
- Regehr WG, Tank DW. Postsynaptic NMDA receptor-mediated calcium accumulation in hippocampal CA1 pyramidal cell dendrites. Nature. 1990;345:807–810. doi: 10.1038/345807a0. [DOI] [PubMed] [Google Scholar]
- Reinagel P, Godwin D, Sherman SM, Koch C. Encoding of visual information by LGN bursts. J Neurophysiol. 1999;81:2558–2569. doi: 10.1152/jn.1999.81.5.2558. [DOI] [PubMed] [Google Scholar]
- Ross WN, Reichardt LF. Species-Specific Effects on the Optical Signals of Voltage-Sensitive Dyes. Journal of Membrane Biology. 1979;48:343–356. doi: 10.1007/BF01869445. [DOI] [PubMed] [Google Scholar]
- Ross WN, Krauthamer V. Optical measurements of potential changes in axons and processes of neurons of a barnacle ganglion. Journal of Neuroscience. 1984;4:659–672. doi: 10.1523/JNEUROSCI.04-03-00659.1984. [DOI] [PMC free article] [PubMed] [Google Scholar]
- Ross WN, Lasser-Ross N, Gutnick MJ, Fleidervish IA. Sodium channel-mediated [Na+]i changes in axons, proximal dendrites, and somata of rat layer 5 pyramidal cells. Soc Neurosci Abstr. 2006 [Google Scholar]
- Ross WN, Salzberg BM, Cohen LB, Grinvald A, Davila HV, Waggoner AS, Wang CH. Changes in absorption, fluorescence, dichroism, and Birefringence in stained giant axons: : optical measurement of membrane potential. J Membr Biol. 1977;33:141–183. doi: 10.1007/BF01869514. [DOI] [PubMed] [Google Scholar]
- Salzberg BM, Grinvald A, Cohen LB, Davila HV, Ross WN. Optical recording of neuronal activity in an invertebrate central nervous system: simultaneous monitoring of several neurons. Journal of Neurophysiology. 1977;40:1281–1291. doi: 10.1152/jn.1977.40.6.1281. [DOI] [PubMed] [Google Scholar]
- Shoham D, Glaser DE, Arieli A, Kenet T, Wijnbergen C, Toledo Y, Hildesheim R, Grinvald A. Imaging cortical dynamics at high spatial and temporal resolution with novel blue voltage-sensitive dyes. Neuron. 1999;24:791–802. doi: 10.1016/s0896-6273(00)81027-2. [DOI] [PubMed] [Google Scholar]
- Stuart G, Schiller J, Sakmann B. Action potential initiation and propagation in rat neocortical pyramidal neurons. Journal of Physiology. 1997a;505:617–632. doi: 10.1111/j.1469-7793.1997.617ba.x. [DOI] [PMC free article] [PubMed] [Google Scholar]
- Stuart G, Spruston N, Sakmann B, Hausser M. Action potential initiation and backpropagation in neurons of the mammalian CNS. Trends in Neurosciences. 1997b;20:125–131. doi: 10.1016/s0166-2236(96)10075-8. [DOI] [PubMed] [Google Scholar]
- Stuart GJ, Palmer LM. Imaging membrane potential in dendrites and axons of single neurons. Pflugers Arch. 2006;453:403–410. doi: 10.1007/s00424-006-0149-3. [DOI] [PubMed] [Google Scholar]
- Svoboda K, Tank DW, Denk W. Direct measurement of coupling between dendritic spines and shafts. Science. 1996;272:716–719. doi: 10.1126/science.272.5262.716. [DOI] [PubMed] [Google Scholar]
- Svoboda K, Denk W, Kleinfeld D, Tank DW. In vivo dendritic calcium dynamics in neocortical pyramidal neurons. Nature. 1997;385:161–165. doi: 10.1038/385161a0. [DOI] [PubMed] [Google Scholar]
- Tominaga T, Tominaga Y, Ichikawa M. Optical imaging of long-lasting depolarization on burst stimulation in area CA1 of rat hippocampal slices. J Neurophysiol. 2002;88:1523–1532. doi: 10.1152/jn.2002.88.3.1523. [DOI] [PubMed] [Google Scholar]
- Waters J, Helmchen F. Boosting of action potential backpropagation by neocortical network activity in vivo. J Neurosci. 2004;24:11127–11136. doi: 10.1523/JNEUROSCI.2933-04.2004. [DOI] [PMC free article] [PubMed] [Google Scholar]
- Wuskell JP, Boudreau D, Wei MD, Jin L, Engl R, Chebolu R, Bullen A, Hoffacker KD, Kerimo J, Cohen LB, Zochowski MR, Loew LM. Synthesis, spectra, delivery and potentiometric responses of new styryl dyes with extended spectral ranges. J Neurosci Methods. 2006;151:200–215. doi: 10.1016/j.jneumeth.2005.07.013. [DOI] [PubMed] [Google Scholar]
- Zecevic D. Multiple spike-initiation zones in single neurons revealed by voltage-sensitive dyes. Nature. 1996;381:322–325. doi: 10.1038/381322a0. [DOI] [PubMed] [Google Scholar]
- Zecevic D, Antic S. Fast optical measurement of membrane potential changes at multiple sites on an individual nerve cell. Histochemical Journal. 1998;30:197–216. doi: 10.1023/a:1003299420524. [DOI] [PubMed] [Google Scholar]
- Zochowski M, Wachowiak M, Falk CX, Cohen LB, Lam YW, Antic S, Zecevic D. Imaging membrane potential with voltage-sensitive dyes. Biological Bulletin. 2000;198:1–21. doi: 10.2307/1542798. [DOI] [PubMed] [Google Scholar]