Cell Surface Orifices of Caveolae and Localization of Caveolin to the Necks of Caveolae in Adipocytes (original) (raw)
Abstract
Caveolae are noncoated invaginations of the plasma membrane that form in the presence of the protein caveolin. Caveolae are found in most cells, but are especially abundant in adipocytes. By high-resolution electron microscopy of plasma membrane sheets the detailed structure of individual caveolae of primary rat adipocytes was examined. Caveolin-1 and -2 binding was restricted to the membrane proximal region, such as the ducts or necks attaching the caveolar bulb to the membrane. This was confirmed by transfection with myc-tagged caveolin-1 and -2. Essentially the same results were obtained with human fibroblasts. Hence caveolin does not form the caveolar bulb in these cells, but rather the neck and may thus act to retain the caveolar constituents, indicating how caveolin participates in the formation of caveolae. Caveolae, randomly distributed over the plasma membrane, were very heterogeneous, varying in size between 25 and 150 nm. There was about one million caveolae in an adipocyte, which increased the surface area of the plasma membrane by 50%. Half of the caveolae, those larger than 50 nm, had access to the outside of the cell via ducts and 20-nm orifices at the cell surface. The rest of the caveolae, those smaller than 50 nm, were not open to the cell exterior. Cholesterol depletion destroyed both caveolae and the cell surface orifices.
INTRODUCTION
Caveolae were originally discovered by electron microscopy as noncoated invaginations of the plasma membrane of endothelial cells (Palade, 1953; Yamada, 1955). Similarly to so-called rafts, they are enriched in the membrane lipids cholesterol (Rothberg et al., 1992; Schnitzer et al., 1994; Gustavsson et al., 1999; Pike et al., 2002) and sphingomyelin (Liu et al., 1997; Pike et al., 2002) and perhaps also glycosphingolipids (Schnitzer et al., 1995), phosphoinositides (Hope and Pike, 1996), and glycosyl phosphatidylinositol lipids (Parpal et al., 1995). Noninvaginated plasma membrane rafts of these lipids may be precursors of caveolae, which become invaginated in the presence of the protein caveolin. Involvement of caveolae in a variety of cellular activities has been demonstrated, such as transcytosis, potocytosis (Anderson et al., 1992), and uptake of cholesterol (Simons and Ikonen, 2000) and virus (Pelkmans et al., 2001). Much attention has been on caveolae and rafts as foci and organizing centers for signal transduction (Shaul and Anderson, 1998; Smart et al., 1999; Simons and Toomre, 2000; Marx, 2001). In particular, a regulatory role for caveolae in cell growth and differentiation has attracted interest (Smart et al., 1999). Perturbation of caveolae/rafts may cause a wide range of disorders (Stahlhut et al., 2000)—such as cancer (Smart et al., 1999), muscular dystrophy (McNally et al., 1998), and Alzheimer's disease (Ikezu et al., 1998; Simons et al., 1998). Adipose cells are particularly rich in caveolae. In adipocytes the insulin receptor is localized and signaling in caveolae (Gustavsson et al., 1999). Moreover, insulin-stimulated glucose uptake takes place in caveolae (Gustavsson et al., 1996; Karlsson et al., 2002).
Caveolae are usually seen as 50–100-nm omega- or flask-shaped invaginations of the plasma membrane by electron microscopy of cell thin-sections (Palade, 1953; Yamada, 1955; Rothberg et al., 1992). Examination of critical point dried plasma membrane sheets covered with a thin-layer of chromium (Peters et al., 1985), carbon-platinum deep-etch replicas of plasma membrane sheets (Rothberg et al., 1992), and freeze-fractured plasma membranes (Westermann et al., 1999) have demonstrated a roundish structure of caveolae with a narrowing at their attachment to the membrane. Analogously to clathrin, caveolin is believed to encase and cover the surface of the caveolae by means of its ability to polymerize (Rothberg et al., 1992; Monier et al., 1995). A striated coat seen on replicas after deep-etching has been interpreted as a clathrin-like caveolin cage encasing the caveolae (Rothberg et al., 1992; Anderson, 1993). The existence of deep and shallow caveolae, apparently with specificity for caveolin-1 isoforms α and β, was described in human fibroblasts (Fujimoto et al., 2000). However, only little detailed analyses of morphology of individual caveolae, or of caveolin localization in the caveola, or of caveolae distribution over the plasma membrane, have been reported. Thin-section electron microscopy on adipocytes has shown that caveolae are abundant and appear to be similarly shaped as in other cell types (Sheldon et al., 1962; Williamson, 1964; Cushman, 1970; Jarett and Smith, 1974; Carpentier et al., 1977a; Chlapowski et al., 1983; Smith and Jarett, 1983). Images of perpendicular sections were complemented by sections oblique to the membrane (Chlapowski et al., 1983) or sodium silicotungstate negatively stained membrane sheets (Vinten et al., 2001). We have earlier prepared plasma membrane from 3T3-L1 adipocytes for electron microscopic examination by covering the inner surface of the plasma membrane with a thin layer of tungsten (Gustavsson et al., 1999; Parpal et al., 2001; Karlsson et al., 2002). We have now applied this technique on intact adipocytes and plasma membranes of freshly isolated rat adipocytes. We give a high-resolution picture of the detailed structure of individual caveolae, demonstrating the localization of caveolin in the necks and not in the bulbs of caveolae. We also show the cell surface orifices of large caveolae and that a population of small caveolae have no outlet on the cell surface.
MATERIALS AND METHODS
Reagents
Rabbit anti–caveolin-1 polyclonal (C13630) and monoclonal (C43420) antibodies, and anti–caveolin-2 monoclonal (C57820) antibodies were from Transduction Laboratories (Lexington, KY). Rabbit polyclonal antimyc (SC789) antibodies were from Santa Cruz Biotechnology (Santa Cruz, CA). Colloidal gold conjugated anti-IgG was from Aurion (Wageningen, The Netherlands). Other chemicals were from Sigma-Aldrich (St. Louis, MO) or as indicated in the text.
Isolation and Incubation of Adipocytes
Adipocytes were isolated by collagenase digestion from Harlan Sprague Dawley rats (130–160 g, B&K Universal, Sollentuna, Sweden; Strålfors and Honnor, 1989). Cells were incubated in Krebs-Ringer solution (0.12 M NaCl, 4.7 mM KCl, 2.5 mM CaCl2, 1.2 mM MgSO4, 1.2 mM KH2PO4) containing 20 mM HEPES, pH 7.40, 1% (wt/vol) fatty acid-free bovine serum albumin, 100 nM phenylisopropyladenosine, 0.5 U ·ml–1 adenosine deaminase with 2 mM glucose, at 37°C on a shaking water bath.
Transfection of Adipocytes With Myc-Tagged Caveolin-1 and 2
Isolated adipocytes were transfected as described (Quon et al., 1993; Nyström et al., 1999) with modifications. Briefly, 200 μl cells (40 μl cell volume per ml) was mixed with 200 μl of buffer (137 mM NaCl, 2.7 mM KCl, 10 mM Na2HPO4, and 1.8 mM KH2PO4, pH 7.5) containing 5 μg of empty vector pcis2, pcis2 caveolin-1, or pcis2 caveolin-2 (supplied by Dr M. Quon, NIH, Bethesda, MD) in an electroporation cuvette. Cells were electroporated with six pulses at 600 V and 25 μF using Gene pulser II (Bio-Rad, Hercules, CA). Cells from 15 cuvettes were pooled and kept at 37°C in 10% CO2. After 1 h an equal volume of DMEM, pH 7.5, containing 25 mM glucose, 50 UI/ml penicillin, 50 μg/ml streptomycin, 200 nM PIA, 7% (wt/vol) bovine serum albumin, and 25 mM HEPES, was added. After 18 h of incubation cells were collected, and plasma membranes were prepared for electron microscopy.
Culture and Transfection of Human Fibroblasts
Human foreskin fibroblasts AG-01518 were grown on gold-grids in DMEM supplemented with 50 UI/ml penicillin, 50 μg/ml streptomycin, and 10% (vol/vol) newborn calf serum in 10% CO2. For transfection, fibroblasts were transferred to medium without antibiotics and the following day were transfected with 1 μg pcis2 caveolin-1 and Lipofectamine 2000 (Invitrogen) in 600 μl for 5 h, according to the provided protocol (Invitrogen, Carlsbad, CA). The cells were then incubated for a further 24 h in medium without antibiotics.
Electron Microscopy of Plasma Membranes
After rinsing adipocytes in ice-cold phosphate buffer (10 mM Na2HPO4, 1.8 mM KH2PO4, 137 mM NaCl), they were attached to gold grids (Voldstedlund et al., 1993): Poly-l-lysine-formvar–coated grids were rehydrated in ice-cold phosphate buffer containing the cells. Grids with captured adipocytes were flushed with ice-cold 150 mM KCl, 1.9 mM Tris-HCl buffer, pH 7.4.
Human foreskin fibroblasts were washed as above and then briefly (90 s) treated with hypotonic buffer (50 mM HEPES, pH 7.5) followed by 30 s in poly-l-lysine (1 mg/ml in 150 mM HEPES, pH 7.5), before probe-sonication for 5 s (Robinson et al., 1992).
Plasma membranes remaining on the grids were washed three times in 150 mM HEPES, pH 7.5, and fixed in 0.1 M sodium cacodylate, containing 0.1 M sucrose, 3% paraformaldehyde, and 0.05% glutaraldehyde, for 30 min at room temperature.
Membranes were blocked for 60 min at 37°C with 1% bovine serum albumin (BSA-c, Aurion), 0.1% gelatin, and 1% normal goat serum (Aurion), followed by anticaveolin antibodies for 2 h at 37°C. Grids were rinsed in phosphate buffer, with 0.15% BSA-c, pH 7.5, before incubation with secondary antibodies. Goat anti-rabbit or anti-mouse IgG, conjugated with 6 or 15 nm colloidal gold, was added to plasma membranes and incubated overnight at 4°C.
After immunolabeling, plasma membranes were rinsed and fixed in 2% glutaraldehyde for 10 min followed by 1% OsO4 for 30 min in 0.1 M sodium cacodylate, with 0.1 M sucrose, pH 7.5, at room temperature. Grids were rinsed with water, frozen, lyophilized, and coated with 2 nm tungsten by magnetron sputtering directly in the freeze-dryer (Lindroth et al., 1991). Transmission electron microscopy (TEM) was with Jeol EX1200 TEM-SCAN (Tokyo, Japan). Scanning electron microscopy (SEM) was with LEO 1550 Gemini. No labeling was observed neither in the absence of the primary antibody nor cross-reactivity between secondary and primary antibodies.
Electron Microscopy of Intact Cells
Adipocytes were rinsed in ice-cold phosphate buffer and fixed with 2.5% glutaraldehyde and 2% paraformaldehyde in 0.1 M sodium cacodylate for 1 h at room temperature. Cells were attached to grids as above. Cells were then further fixed with 1% OsO4 in 0.1 M sodium cacodylate, containing 0.1 M sucrose, pH 7.5, for 2 h at room temperature. Grids were rinsed with water, frozen, lyophilized, and coated with 1 nm tungsten by magnetron sputtering directly in the freeze-dryer (Lindroth et al., 1991). SEM was with LEO 1550 Gemini (Zeiss, Oberkochen, Germany).
Immunofluorescence Deconvolution Microscopy
Adipocytes were rinsed in phosphate buffer and prefixed in 0.1 M sodium cacodylate containing 3% paraformaldehyde and 0.05% glutaraldehyde for 30 min at room temperature. After treatment with 0.1% NaBH4 for 15 min unspecific binding was blocked with 1% BSA-c, 0.1% saponin, 0.1% gelatin, 1% normal goat serum (Aurion) for 1 h at 37°C. Cells were then incubated with primary antibodies (rabbit anticaveolin, 40 μg/ml) in 0.1% saponin for 1.5 h at 37°C. Fluorescent secondary antibody (Alexa fluor 488) was detected by fluorescence microscopy (Axiovert 200M; Zeiss). Image stacks with number of planes as indicated were collected using Axiovision 3.1 (Zeiss). Images were deconvoluted using Maximum Likelihood Estimation algorithm by Huygens v2.3.1a-64 software (Scientific Volume Imaging, Hilversrum, The Netherlands). 3D rendering was by Imaris 3.1.3 software (Bitplane AG, Zu-rich, Switzerland). Labeling was not observed in the absence of the primary antibody or in the cross-reactivity between secondary and primary antibodies.
RESULTS
Caveolae Openings on the Cell Surface
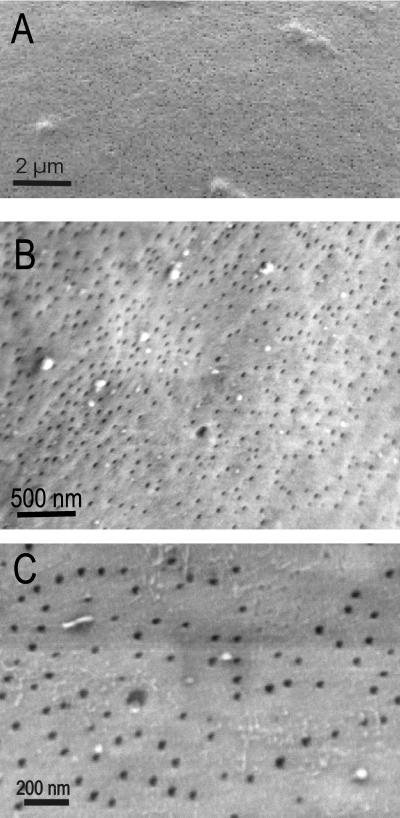
Examination by SEM of the outer surface of freshly isolated adipocytes revealed that the cell surface was dotted with numerous pores of similar size (Figure 1).
Figure 1.
SEM of adipocyte surface. Freshly isolated adipocytes were fixed, attached to grids, cryosputtered and examined by SEM.
The diameter of the orifices was ∼20 nm (Figure 1C). Closer view into the actual openings was not possible because the large adipocytes were not completely static; thus micromovements caused blurring of images at higher magnification. The orifices were nonrandomly distributed over the cell surface with patches of fewer orifices per surface area (Figure 1C). In the typical, denser regions there were 24 ± 1.2 orifices/μm2 (mean ± SEM, n = 5 cells) and on average over the whole adipocyte surface there were 20.7 ± 2.4 openings/μm2 (mean ± SEM, n = 75 areas; counting 15 areas on 5 separate cells covering 60 μm2 per cell), which corresponds to ∼6 ×10⁵ orifices in a cell sized 100 μm in diameter.
Caveolin Localization in the Individual Caveolae
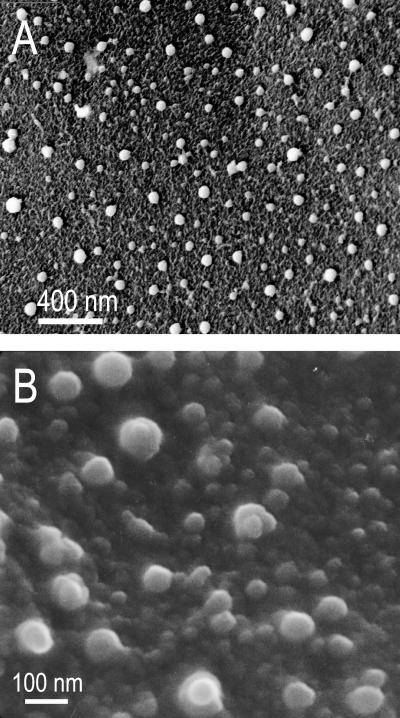
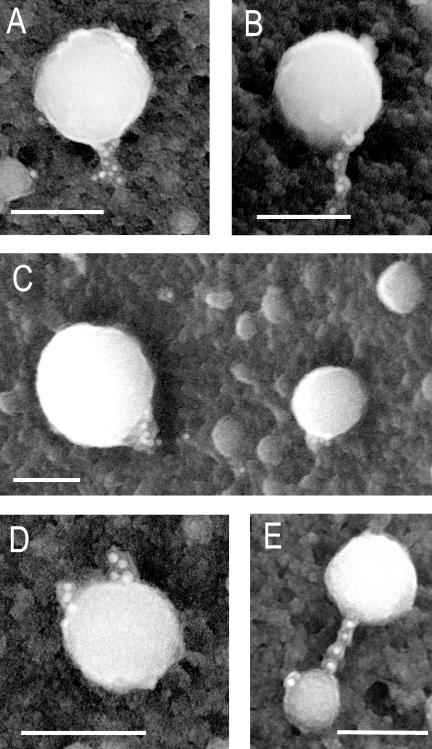
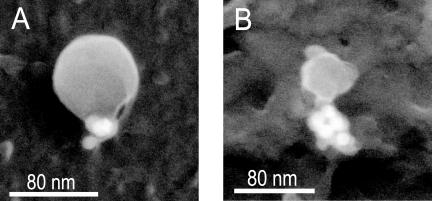
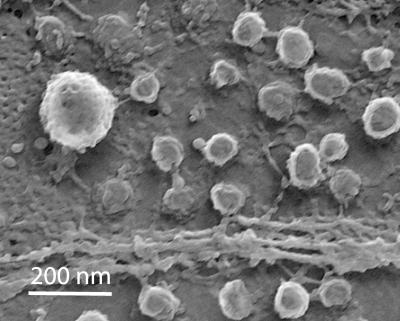
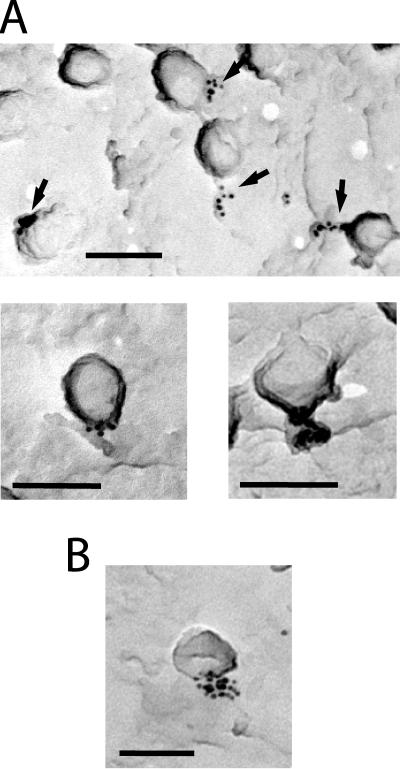
As shown in Figure 2 we found caveolae of greatly varying sizes to protrude from the inner surface of the plasma membrane. The smallest caveolae, consistently labeled for caveolin and thus identified as caveolae, were ∼25 nm in diameter, whereas the largest were ∼150 nm. Close-ups of individual caveolae showed a balloon-like shape with narrow necks or stems connecting them to the plasma membrane proper (Figure 3). Caveolin-1 and -2 labeling was restricted to these necks (Figure 3), using both polyclonal and monoclonal antibodies. To further test this finding we transfected adipocytes with caveolin-1 or -2 that were C-terminally myc-tagged. Using antimyc antibodies, also these caveolins were detected only in the necks and not in the bulbs of the caveolae (Figure 4). However, we did not detect any necks for caveolae smaller than ∼50 nm diameter, but caveolin labeling nonetheless appeared restricted to one part of the caveola (see Figure 7C). We found some caveolae that were attached by two necks (Figure 3D). A further peculiarity sometimes encountered was the apparent joining of two caveolae by a neck (Figure 3E), a phenomenon previously indicated in micrographs of endothelial cells (Uehara and Miyoshi, 1999).
Figure 2.
Electron micrographs of the inside of adipocyte plasma membranes. Plasma membrane sheets of freshly isolated adipocytes were prepared attached to grids, cryosputtered and examined by TEM (A) or SEM (B). Images have been contrast inverted.
Figure 3.
TEM close-ups of individual caveolae labeled against caveolin. Plasma membrane sheets from freshly isolated adipocytes were attached to grids and incubated with antibodies against caveolin for immunogold labeling. Membranes were then cryosputtered and examined by TEM. Images have been contrast inverted. Scale bar, 100 nm.
Figure 4.
TEM of caveolae immunogold labeled for myc-tagged caveolin. Freshly isolated adipocytes were transfected with C-terminally myc-tagged caveolin-1 (A) or -2 (B). Plasma membrane sheets attached to grids were prepared and immunogold-labeled against the myc-tag, cryosputtered, and examined by TEM. Images have been contrast inverted.
Figure 7.
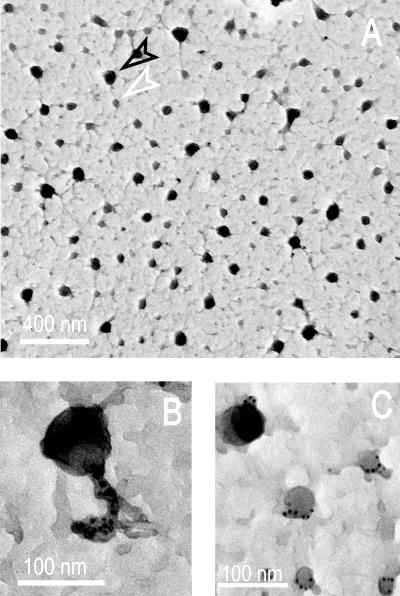
TEM of plasma membranes from ruthenium red–stained adipocytes. Freshly isolated adipocytes were incubated with 1 mg/ml ruthenium red during the glutaraldehyde/paraformaldehyde prefixation. Plasma membrane sheets attached to grids were immunogold labeled against caveolin, treated as described in MATERIALS AND METHODS and examined by TEM. (A) Overview of the inner surface of the plasma membrane. Black arrowhead, ruthenium red–stained caveolae; white arrowhead, nonstained caveolae. (B) Close up of stained caveola. (C) Close up of stained and small nonstained caveolae.
The most common caveolae “cluster” consisted of one caveola with protrusions, like a budding caveola (Figure 2B). Occasionally small clusters with 5–6 caveolae were seen, but not the large clusters of the grape-cluster type described earlier for other cells.
Spiral or bipolar striations have been observed on the surface of caveolae (Peters et al., 1985; Rothberg et al., 1992) and have been suggested to consist of oligomeric caveolin filaments in human skin fibroblasts (Rothberg et al., 1992; Fernandez et al., 2002). We therefore examined human fibroblasts by the same procedure that we used for adipocytes. Caveolae were frequent in the plasma membrane of the fibroblasts, but we did not detect distinct striations or decorations of the caveolar surfaces (Figure 5), to the extent previously described (Peters et al., 1985; Rothberg et al., 1992). Clathrin-coated pits, which were quite frequent in the fibroblasts, displayed the expected honeycomb surface pattern (Figure 5), and filaments in the plane of the membrane were common (Figure 5). Similarly to the findings with adipocytes, we found caveolin to be strongly concentrated at the membrane proximal part of the caveolae in the fibroblasts (Figure 6A). To further test this finding, we transfected the fibroblasts with myc-caveolin-1 and analyzed for immunogold labeling of the myc-tag. Also myc-caveolin-1 labeling was with few exceptions found at the membrane proximal region of the caveolae (Figure 6B).
Figure 5.
TEM of plasma membrane from human fibroblasts. Plasma membrane sheets of the fibroblasts were prepared attached to grids, cryosputtered, and examined by TEM. Image has been contrast inverted.
Figure 6.
TEM close-ups of caveolae labeled against caveolin in human fibroblasts. (A) Plasma membrane sheets of the fibroblasts were prepared attached to grids and incubated with antibodies against caveolin for immunogold labeling (6 nm gold). Membranes were then cryosputtered and examined by TEM. (B) Fibroblasts were transfected with C-terminally myc-tagged caveolin-1. Plasma membrane sheets attached to grids were prepared and immunogold-labeled against the myc-tag (6 nm gold), cryosputtered, and examined by TEM. Scale bar, 100 nM.
Ruthenium red stains the adipocyte plasma membrane without passing through it. Treatment of the intact adipocyte with ruthenium red stained virtually all caveolae with a diameter larger than ∼50 nm, but rarely smaller caveolae (Figure 7A), although these contained caveolin (Figure 7C). The bulbs as well as necks of the larger caveolae were stained with ruthenium red (Figure 7B). The necks are thus hollow and continuous with the plasma membrane and bulbs of caveolae.
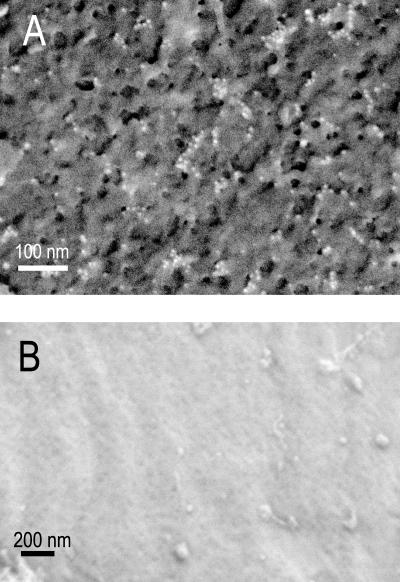
It has earlier been shown in other cell types that cholesterol depletion of cell membranes leads to the loss of caveolae structures (Chang et al., 1992; Schnitzer et al., 1994; Gustavsson et al., 1999). When we thus treated the adipocytes with β-cyclodextrin to deplete the plasma membrane of ∼50% of its cholesterol, caveolae disappeared from the inner face of the plasma membrane (Figure 8A). The caveolin protein stayed clustered in the cholesterol and caveolae-depleted plasma membrane (Figure 8A). The orifices on the cell surface were also no longer visible after the cholesterol depletion (Figure 8B), suggesting that the orifices represent the caveolar openings to the outside of the cell.
Figure 8.
EM of adipocyte surface and inside of plasma membrane after cholesterol depletion. Freshly isolated adipocytes were depleted of ∼50% of the plasma membrane cholesterol by incubation with β-cyclodextrin at 10 mM for 50 min. (A) Plasma membrane sheets were prepared attached to grids. After immunogold labeling against caveolin membranes were examined by TEM. Image has been contrast inverted. (B) Intact cells were fixed, attached to grids, cryosputtered, and examined by SEM.
Caveolae With and Without Access to the Outside of the Cell
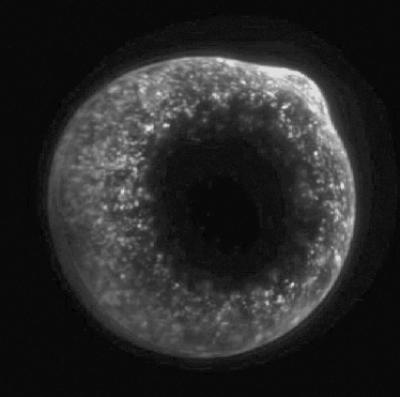
The density of caveolae varied greatly over the adipocyte plasma membrane, but most of the plasma membrane was rich in caveolae as seen from a large number of EM pictures (e.g., Figure 2B with a caveolae-dense region bordering to a low-density patch to the right; cf. Peters et al., 1985). Patches of lower caveolin labeling density were scattered over the cell membrane as seen from a more global perspective of caveolin-labeling and immunofluorescence light microscopy (Figure 9).
Figure 9.
Caveolin distribution over the adipocyte. Freshly isolated adipocytes were fixed and immunofluorescence labeled with antibodies against caveolin in the presence of saponin to permeabilize the cells. Cells were then examined by immunofluorescence microscopy in stacks of 150-nm focal plane shifts, 200 images were deconvoluted, and a 3D image was rendered. Shown is a transverse section of the cell, seen from above, the nucleus making a protrusion at the top right of the image.
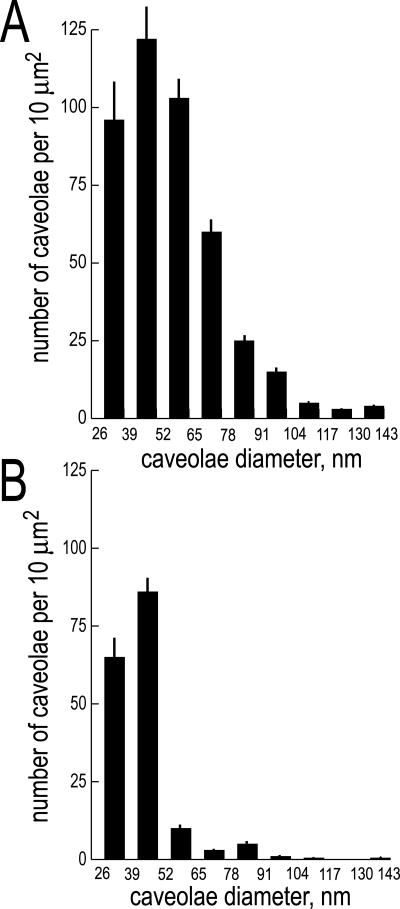
The definitions of caveolae-dense and low-density regions are obviously arbitrary and any randomly chosen area can contain contributions from both. To estimate the caveolae density and size distribution, we have therefore counted and measured the caveolae in what we see as clearly caveolae-dense (Figure 10A) or low-density regions (Figure 10B), respectively, thus avoiding the problem with transitional areas. The total number of caveolae (25–150 nm diameter) was ∼43 caveolae/μm2 in the caveolae-dense regions of the cell and ∼16 caveolae/μm2 in caveolae low-density patches. In a 100-μm adipocyte this corresponds to a total of ∼106 caveolae/cell. In the caveolae-dense regions the number of caveolae with a diameter >50 nm, i.e., those that are connected with the cell surface, was 22 per μm2 (Figure 10A). A similar number was obtained by counting the density of ruthenium red–stained caveolae. These figures, in turn, compare very well with the density of openings on the surface of the cell (above).
Figure 10.
Distribution in the plasma membrane of caveolae of different diameters. Plasma membrane sheets were prepared and immunogold-labeled against caveolin for examination by TEM. The size and number of caveolae were determined manually from prints. (A) Typical caveolae-dense regions; 1552 caveolae in five cells from three different preparations, covering a total membrane area of 36 μm2 were measured. (B) Caveolae low-density patches, 630 caveolae in five cells from three different preparations, covering a total membrane area of 36 μm2 were measured. Mean ± SEM.
About 50% of the caveolae were <50 nm, caveolae that appeared not to be open to the outside of the cell. The low-density patches of caveolae were especially lacking in caveolae with a diameter >50 nm. However, although the number of caveolae larger than 50 nm accounted for 50% of caveolae, the surface area of these large caveolae accounted for 80% of the total caveolae membrane area. The total sum of caveolae (25–150 nm diameter) membrane increased the plasma membrane area by 50%.
DISCUSSION
The most striking morphological feature of the adipocyte plasma membrane is the abundance of caveolae orifices on the outer surface and the corresponding caveolae bulbs covering much of the inner surface. Although known to exist, the caveolae orifices on the outside of the cell have to our knowledge never been demonstrated before. Because both the bulbs and necks of the caveolae were accessible to extracellular ruthenium red, it appears that the neck is the duct that connects the caveola bulb with the orifice on the outside of the cell. These conclusions are supported by the similar distribution and density of caveolae of >50 nm in diameter, of ruthenium red–stained caveolae, and of the orifices on the cell surface. The parallel effects of cholesterol depletion on cell surface orifices and on caveolae structures suggest that the cell surface orifices indeed represent the caveolar outlets.
A striated spiral coat of caveolae, suggested to be formed by caveolin, has been reported for carbon-platinum replicas of cultured human fibroblasts after deep-etching (Rothberg et al., 1992). Similar striped, but bipolar, surface structures were described on caveolae of capillary endothelial cells after critical point drying and coating with chromium (Peters et al., 1985). We did not see a striated coat in the adipocytes, neither by TEM nor SEM. In this study membranes were lyophilized and coated with a very thin (1–2 nm) layer of tungsten (Lindroth et al., 1991), which produces an extremely homogeneous layer of metal and which is not prone to decorating artifacts (Lindroth and Sundgren, 1989). We have, furthermore, used cryosputtering to reduce artifacts due to rehydration or contamination (Lindroth et al., 1991). We therefore believe that adipocyte caveolae do not exhibit striated coats. Moreover, anticaveolin-1 or -2 labeling of caveolae with identifiable necks was distinctly restricted to the necks that attach the caveolae to the membrane, with very limited labeling of the caveolar bulbs. This is unexpected because the general belief is that caveolin encases the caveola bulb by virtue of its ability to form homo-oligomeric complexes between caveolin-1 and hetero-oligomeric complexes between caveolin-1 and -2 (Rothberg et al., 1992; Monier et al., 1995; Marx, 2001; Parton, 2001; Fernandez et al., 2002). Different antibodies toward caveolin-1 and -2 gave the same result. Moreover, myc-tagged caveolin-1 or -2 was expressed only in the necks of the caveolae, as determined with antibodies against the myc-tags. Because both the N- and C-termini of caveolin are cytoplasmic, it is unlikely that a myc-tag at the C-terminal would become inaccessible in the bulb of the caveola. It is possible that caveolin present in the bulb is washed off the caveolae during preparation of the membranes for immunolabeling; however, in such case caveolin binding to the bulbs of caveolae would be qualitatively different from that of caveolin binding in the necks. Taken together, our findings demonstrate that in adipocytes caveolin proteins are present in the necks of caveolae and do not form a stable cage around the caveola bulb. It is interesting that isolated caveolae examined by freeze-fracture electron microscopy exhibited no striation, and caveolin was only found at a single spot on each caveola, close to what appeared to have been the caveolae openings (Westermann et al., 1999). Our findings that caveolae in human fibroblasts did not present clear striations when examined by TEM and, importantly, that caveolin labeling was restricted to the membrane proximal part of the caveolae suggest that this may not be unique to adipocytes. However, different levels of expression of caveolin-1 and -2 and caveolae in different cell types may explain some of the reported differences regarding caveolae structure and function.
Caveolin is known to be critical for formation of caveolae, as shown by induction of caveolin expression in cells not normally expressing the protein (Fra et al., 1995) and by the absence of caveolae in cells from caveolin-1 null mice (Drab et al., 2001; Razani et al., 2001). Our findings indicate that caveolin presence in the bulb is not necessary to maintain the bulb. It therefore appears that caveolin functions not to directly keep the shape of the caveolae, but to sequester the caveolar membrane and its lipids from the rest of the membrane, not unlike tight junctions, and thus indirectly form caveolae. This suggests that caveolae form from rafts by membrane expansion inside a caveolin “membrane lock” through accretion of its lipid components. The localization of caveolin in the necks has implications for an understanding of the reported interaction, including coprecipitation, of caveolin with a large number of different proteins. This could mean that caveolin protein interaction, similarly as discussed for the lipids, is important for recruiting proteins to caveolae and that much of the in situ interaction is transient. This does not contradict previous observations because immunoprecipitation can only demonstrate a propensity for interaction, not that an interaction takes place in the intact cell. It will be interesting to examine the localization in adipocytes of dynamin in relation to caveolin, because dynamin was found in caveolae necks of lung endothelium (Oh et al., 1998).
By TEM and immunogold labeling against caveolin, we identified caveolae that varied in size from 25 to 150 nm. It is interesting that only half of these, those larger than ∼50 nm, were open to the outside of the cell, as determined by accessibility for ruthenium red. The number of large (>50 nm) stained bulbs matches the number of openings on the outside of the cell. They were concentrated in the large caveolae-dense regions, and very few of them were found in the caveolae low-density patches, a pattern mirrored by orifices on the surface. The small <50 nm membrane attached caveolae vesicles were labeled by anticaveolin antibodies and destroyed by cholesterol depletion, which strongly indicates an intimate relation with the large caveolae. They may be vesicles about to fuse with or to bud off from the membrane. Potocytosis has been suggested to involve transiently formed and sealed off compartments that are independent from the extracellular space, but still contiguous with the plasma membrane (Anderson et al., 1992). Our finding that the sealed-off caveolae are invariably very small may indicate a more specialized function. It will obviously be important to find methods to isolate these separately from the larger caveolae in order to characterize them biochemically.
Larger structures containing caveolae have been described in 3T3-L1 adipocytes (Gustavsson et al., 1999; Baumann et al., 2000) and was recently shown to contain all elements of the plasma membrane (Parton et al., 2002). It is noteworthy that these structures were not found in the primary fat cells used in this study and emphasizes the importance of using electron microscopy when studying caveolae as well as using physiologically relevant cells.
The number of caveolae determined here is on par with previous estimates of 45 intramembraneous invaginations per μm2 (Carpentier et al., 1977b) or 30 plasma membrane–associated microvesicles per μm2 (Chlapowski et al., 1983). They are higher than the estimated number of caveolae in 3T3-L1 adipocytes: 10 per μm2 (Fan et al., 1983). This is of interest because for instance the insulin receptor, which is located in caveolae (Gustavsson et al., 1999), numbers ∼2 × 10⁵ receptors/adipocyte (Gammeltoft, 1988) and hence will be found in a subset of the 106 caveolae even if evenly distributed.
The large number of caveolae increases the plasma membrane surface area considerably and, consequently, a substantial fraction of the plasma membrane constitutes caveolae membrane. From the caveolae diameters and number of caveolae we calculate that one third of the plasma membrane surface area is made up of caveolae membrane, which is similar to previous estimates from electron microscopy of adipocyte thin sections (Chlapowski et al., 1983). The large adipocyte (50–150-μm diameter) has a very unfavorable surface area to cell volume ratio combined with a massive flux of fatty acids over the plasma membrane. During maximal lipolysis (0.7 μmol fatty acid per min per ml packed cells; Belfrage et al., 1984) 104-105 molecules of fatty acids/s/μm2 pass over the plasma membrane. Free fatty acids in the plasma membrane cause prompt lysis of the cells (Strålfors, 1990). Caveolin-1 and -2, which have been described to bind fatty acids (Trigatti et al., 1999), may facilitate the flow of fatty acids over the plasma membrane via the caveolae membrane expansion. Indeed, caveolin-1–deficient mice have a corrupt adipose tissue and elevated serum concentration of free fatty acids, especially in the postprandial state (Razani et al., 2002). This can be attributed to the fatty acid binding and transport function of caveolin-1/caveolae and to increased fatty acid release resulting from insulin resistance, as we have previously shown in adipocytes lacking caveolae due to cholesterol depletion (Parpal et al., 2001). Moreover, the fatty acids have to pass to and from the adipocyte and the blood stream via endothelial cells, which are second only to adipocytes in terms of number of caveolae and amount of caveolin. Considering that for most of the plasma membrane surface the corresponding cytosol of an adipocyte is no more than 200–400 nm thick, elaborate caveolar clusters may not be needed or cannot be allowed for lack of space. Caveolae clusters are, however, common in, e.g., 3T3-L1 adipocytes (Novikoff et al., 1980; Gustavsson et al., 1999) and is a prominent phenomenon in endothelial cells (Uehara and Miyoshi, 1999). They are also described in severely starved and fat depleted rat adipocytes (Sheldon et al., 1962; Williamson, 1964), perhaps a response adaptation to a massive and prolonged efflux of fatty acids.
In conclusion, using SEM we have shown cell surface orifices that represent caveolae openings. We have demonstrated that in adipocytes there are two populations of caveolae, one larger than 50 nm open to the cell surface and one smaller than 50 nm with no cell surface openings. Caveolin localization was restricted to the caveolae necks, connecting the caveola to the plasma membrane. In the small caveolae caveolin also appeared polarized, although no necks were found. Moreover, also in human fibroblasts caveolin labeling was restricted to the membrane proximal parts of caveolae.
Supplementary Material
MBC Video
Acknowledgments
This work was supported by the Lions Foundation, Swedish Society for Medical Research, Östergötland County Council, Swedish Diabetes Association, Swedish Foundation for Strategic Research (National Network for Cardiovascular Research and Glycoconjugates in Biological Systems), and the Swedish Research Council.
Abbreviations used: SEM, scanning electron microscopy; TEM, transmission electron microscopy.
V⃞
Online version of this article contains video material. Online version is available at www.molbiolcell.org.
References
- Anderson, R.G.W. (1993). Caveolae: where incoming and outgoing messengers meet. Proc. Natl. Acad. Sci. USA 90, 10909–10913. [DOI] [PMC free article] [PubMed] [Google Scholar]
- Anderson, R.G.W., Kamen, B.A., Rothberg, K.G., and Lacey, S.W. (1992). Potocytosis: sequestration and transport of small molecules by caveolae. Science 255, 410–411. [DOI] [PubMed] [Google Scholar]
- Baumann, C.A., Ribon, V., Kanzaki, M., Thurmond, D.C., Mora, S., Shigematsu, S., Bickel, P.E., Pessin, J.E., and Saltiel, A.R. (2000). CAP defines a second signalling pathway required for insulin-stimulated glucose transport. Nature 407, 202–207. [DOI] [PubMed] [Google Scholar]
- Belfrage, P., Fredriksson, G., Strålfors, P., and Tornqvist, H. (1984). Adipose tissue lipases. In: Lipases, eds. B. Borgström and H.L. Brockman, Amsterdam: Elsevier Science Publishers BV, 365–416.
- Carpentier, J.-L., Perrelet, A., and Orci, L. (1977a). Morphological changes of the adipose cell plasma membrane during lipolysis. J. Cell Biol. 72, 104–117. [DOI] [PMC free article] [PubMed] [Google Scholar]
- Carpentier, J.-L., Perrelet, A., and Orci, L. (1977b). Perturbation of the adipose cell plasma membrane in obese (ob/ob) mice. Lab. Invest. 37, 260–264. [PubMed] [Google Scholar]
- Chang, W.-J., Rothberg, K.G., Kamen, B.A., and Anderson, R.G. (1992). Lowering the cholesterol content of MA104 cells inhibits receptor-mediated transport of folate. J. Cell Biol. 118, 63–69. [DOI] [PMC free article] [PubMed] [Google Scholar]
- Chlapowski, F.J., Bertrand, B.K., Pessin, J., Oka, Y., and Czech, M.P. (1983). The relationship of microvesicles to the plasmalemma of rat adipocytes. Eur. J. Cell Biol. 32, 24–30. [PubMed] [Google Scholar]
- Cushman, S.W. (1970). Structure-function relationships in the adipose cell. J. Cell Biol. 46, 326–341. [DOI] [PMC free article] [PubMed] [Google Scholar]
- Drab, M. et al. (2001). Loss of caveolae, vascular dysfunction, and pulmonary defects in caveolin-1 gene-disrupted mice. Science 293, 2449–2452. [DOI] [PubMed] [Google Scholar]
- Fan, J.Y., Carpentier, J.-L., Obberghen, E. v., Grunfeld, C., Gorden, P., and Orci, L. (1983). Morphological changes of the 3T3–L1 fibroblast plasma membrane upon differentiation to the adipocyte form. J. Cell Sci. 61, 219–230. [DOI] [PubMed] [Google Scholar]
- Fernandez, I., Ying, Y., Albanesi, J., and Anderson, R.G.W. (2002). Mechanism of caveolin filament assembly. Proc. Natl. Acad. Sci. USA 99, 11193–11198. [DOI] [PMC free article] [PubMed] [Google Scholar]
- Fra, A.M., Williamson, E., Simons, K., and Parton, R.G. (1995). De novo formation of caveolae in lymphocytes by expression of VIP21-caveolin. Proc. Natl. Acad. Sci. USA 92, 8655–8659. [DOI] [PMC free article] [PubMed] [Google Scholar]
- Fujimoto, T., Kogo, H., Nomura, R., and Tomoko, U. (2000). Isoforms of caveolin-1 and caveolar structure. J. Cell Sci. 113, 3509–3517. [DOI] [PubMed] [Google Scholar]
- Gammeltoft, S. (1988). Binding properties of insulin receptors in different tissues. In: Insulin Receptors: Methods for the Study of Structure and Function, eds. C.R. Kahn and L.C. Harrison, New York: Alan R. Liss, Inc., 15–27.
- Gustavsson, J. et al. (1999). Localisation of the insulin receptor in caveolae of adipocyte plasma membrane. FASEB J. 13, 1961–1971. [PubMed] [Google Scholar]
- Gustavsson, J., Parpal, S., and Strålfors, P. (1996). Insulin-stimulated glucose uptake involves the transition of glucose transporters to a caveolae-rich fraction within the plasma membrane: implications for type II diabetes. Mol. Med. 2, 367–372. [PMC free article] [PubMed] [Google Scholar]
- Hope, H.R., and Pike, L.J. (1996). Phosphoinositides and phosphoinositide-utilizing enzymes in detergent-insoluble lipid domains. Mol. Biol. Cell 7, 843–851. [DOI] [PMC free article] [PubMed] [Google Scholar]
- Ikezu, T., Trapp, B.D., Song, K.S., Schlegel, A., Lisanti, M.P., and Okamoto, T. (1998). Caveolae, plasma membrane microdomains for alpha-secretase-mediated processing of the amyloid precursor protein. J. Biol. Chem. 273, 10485–10495. [DOI] [PubMed] [Google Scholar]
- Jarett, L., and Smith, R.M. (1974). Electron microscopic determination of insulin receptors on adipocyte plasma membrane utilizing a ferritin-insulin conjugate. J. Biol. Chem. 249, 7024–7031. [PubMed] [Google Scholar]
- Karlsson, M., Thorn, H., Parpal, S., Strålfors, P., and Gustavsson, J. (2002). Insulin induces translocation of glucose transporter GLUT4 to plasma membrane caveolae in adipocytes. FASEB J. 16, 249–251. [DOI] [PubMed] [Google Scholar]
- Lindroth, M., Fredriksson, B.-A., and Bell, P.B. (1991). Cryosputtering—a combined freeze-drying and sputtering method for high-resolution electron microscopy. J. Microsc. 161, 229–239. [DOI] [PubMed] [Google Scholar]
- Lindroth, M., and Sundgren, J.-E. (1989). Ion-beam sputtering and magnetron-sputtering thin films on cytoskeletons—a high resolution TEM-study. Scanning 11, 243–253. [Google Scholar]
- Liu, J., Oh, P., Horner, T., Rogers, R.A., and Schnitzer, J.E. (1997). Organized endothelial cell surface signal transduction in caveolae distinct from glycosylphosphatidylinositol-anchored protein microdomains. J. Biol. Chem. 272, 7211–7222. [DOI] [PubMed] [Google Scholar]
- Marx, J. (2001). Caveolae: a once-elusive structure gets some respect. Science 294, 1862–1865. [DOI] [PubMed] [Google Scholar]
- McNally, E.M. et al. (1998). Caveolin-3 in muscular dystrophy. Hum. Mol. Genet. 7, 871–877. [DOI] [PubMed] [Google Scholar]
- Monier, S., Parton, R.G., Vogel, F., Belke, J., Henske, A., and Kurzchalia, T.V. (1995). VIP21-Caveolin, a membrane protein constituent of the caveolar coat, oligomerizes in vivo and in vitro. Mol. Biol. Cell 6, 911–927. [DOI] [PMC free article] [PubMed] [Google Scholar]
- Novikoff, A.B., Novikoff, P.M., Rosen, O.M., and Rubin, C.S. (1980). Organelle relationship in cultured 3T3–L1 preadipocytes. J. Cell Biol. 87, 180–196. [DOI] [PMC free article] [PubMed] [Google Scholar]
- Nyström, F.H., Chen, H., Cong, L.-N., Li, Y., and Quon, M.J. (1999). Caveolin-1 interacts with the insulin receptor and can differentially modulate insulin signaling in transfected Cos-7 cells and rat adipose cells. Mol. Endocrinol. 13, 2013–2024. [DOI] [PubMed] [Google Scholar]
- Oh, P., McIntosh, D.P., and Schnitzer, J.E. (1998). Dynamin at the neck of caveolae mediates their budding to form transport vesicles by GTP-driven fission from the plasma membrane of endothelium. J. Cell Biol. 141, 101–114. [DOI] [PMC free article] [PubMed] [Google Scholar]
- Palade, G.E. (1953). Fine structure of blood capillaries. J. Appl. Physics 24, 1424. [Google Scholar]
- Parpal, S., Gustavsson, J., and Strålfors, P. (1995). Isolation of phosphooligosaccharide/phosphoinositol glycan from caveolae and cytosol of insulin-stimulated cells. J. Cell Biol. 131, 125–135. [DOI] [PMC free article] [PubMed] [Google Scholar]
- Parpal, S., Karlsson, M., Thorn, H., and Strålfors, P. (2001). Cholesterol depletion disrupts caveolae and insulin receptor signaling for metabolic control via IRS-1, but not for MAP-kinase control. J. Biol. Chem. 276, 9670–9678. [DOI] [PubMed] [Google Scholar]
- Parton, R.G. (2001). Life without caveolae. Science 293, 2404–2405. [DOI] [PubMed] [Google Scholar]
- Parton, R.G., Molero, J.C., Floetenmeyer, M., Green, K.M., and James, D.E. (2002). Characterization of a distinct plasma membrane macrodomain in differentiated adipocytes. J. Biol. Chem. 277, 46769–46778. [DOI] [PubMed] [Google Scholar]
- Pelkmans, L., Kartenbeck, J., and Helenius, A. (2001). Caveolar endocytosis of simian virus 40 reveals a new two-step vesicular-pathway to the ER. Nat. Cell Biol. 3, 473–483. [DOI] [PubMed] [Google Scholar]
- Peters, K.-R., Carley, W.W., and Palade, G.E. (1985). Endothelial plasmalemmal vesicles have a characteristic striped bipolar surface structure. J. Cell Biol. 101, 2233–2238. [DOI] [PMC free article] [PubMed] [Google Scholar]
- Pike, L.J., Han, X., Chung, K.-N., and Gross, R.W. (2002). Lipid rafts are enriched in arachidonic acid and plasmenylethanolamine and their composition is independent of caveolin-1 expression: a quantitative electrospray ionization/mass spectrometric analysis. Biochemistry 41, 2075–2088. [DOI] [PubMed] [Google Scholar]
- Quon, M., Zarnowski, M., Guerre-Millo, M., de la Liz Sierra, M., Taylor, S., and Cushman, S. (1993). Transfection of DNA into isolated rat adipose cells by electroporation. Biochem. Biophys. Res. Commun. 194, 338–346. [DOI] [PubMed] [Google Scholar]
- Razani, B. et al. (2002). Caveolin-1 deficient mice are lean, resistant to diet-induced obesity, and show hyper-triglyceridemia with adipocyte abnormalities. J. Biol. Chem. 277, 8635–8647. [DOI] [PubMed] [Google Scholar]
- Razani, B. et al. (2001). Caveolin-1 null mice are viable but show evidence of hyperproliferative and vascular abnormalities. J. Biol. Chem. 276, 38121–38138. [DOI] [PubMed] [Google Scholar]
- Robinson, L.J., Pang, S., Harris, D.S., Heuser, J., and James, D.E. (1992). Translocation of the glucose transporter (GLUT4) to the cell surface in permeabilized 3T3–L1 adipocytes: effects of ATP, insulin, and GTPγS and localization of GLUT4 to clathrin lattices. J. Cell Biol. 117, 1181–1196. [DOI] [PMC free article] [PubMed] [Google Scholar]
- Rothberg, K.G., Heuser, J.E., Donzell, W.C., Ying, Y.-S., Glenney, J.R., and Anderson, R.G.W. (1992). Caveolin, a protein component of caveolae membrane coats. Cell 68, 673–682. [DOI] [PubMed] [Google Scholar]
- Schnitzer, J.E., McIntosh, D.P., Dvorak, A.M., Liu, J., and Oh, P. (1995). Separation of caveolae from associated microdomains of GPI-anchored proteins. Science 269, 1435–1439. [DOI] [PubMed] [Google Scholar]
- Schnitzer, J.E., Oh, P., Pinney, E., and Allard, J. (1994). Filipin-sensitive caveolae-mediated transport in endothelium: reduced transcytosis, scavenger endocytosis, and capillary permeability of select macromolecules. J. Cell Biol. 127, 1217–1232. [DOI] [PMC free article] [PubMed] [Google Scholar]
- Shaul, P.W., and Anderson, R.G.W. (1998). Role of plasmalemmal caveolae in signal transduction. Am. J. Physiol. 275, L843–L851. [DOI] [PubMed] [Google Scholar]
- Sheldon, H., Hollenberg, C.H., and Winegrad, A.I. (1962). Observations on the morphology of adipose tissue. I. The fine structure of cells from fasted and diabetic rats. Diabetes 11, 378–387. [PubMed] [Google Scholar]
- Simons, K., and Ikonen, E. (2000). How cells handle cholesterol. Science 290, 1721–1726. [DOI] [PubMed] [Google Scholar]
- Simons, K., and Toomre, D. (2000). Lipid rafts and signal transduction. Nature Rev. Mol. Cell. Biol. 1, 31–40. [DOI] [PubMed] [Google Scholar]
- Simons, M., Keller, P., Strooper, B.D., Beyreuther, K., Dotti, C.G., and Simons, K. (1998). Cholesterol depletion inhibits the generation of beta-amyloid in hippocampal neurons. Proc. Natl. Acad. Sci. USA 95, 6460–6464. [DOI] [PMC free article] [PubMed] [Google Scholar]
- Smart, E.J., Graf, G.A., McNiven, M.A., Sessa, W.C., Engelman, J.A., Scherer, P.E., Okamoto, T., and Lisanti, M.P. (1999). Caveolins, liquid-ordered domains and signal transduction. Mol. Cell. Biol. 19, 7289–7304. [DOI] [PMC free article] [PubMed] [Google Scholar]
- Smith, R.M., and Jarett, L. (1983). Quantitative ultrastructural analysis of receptor-mediated insulin uptake into adipocytes. J. Cell. Physiol. 115, 199–207. [DOI] [PubMed] [Google Scholar]
- Stahlhut, M., Sandvig, K., and Deurs, B. v. (2000). Caveolae: uniform structures with multiple functions in signaling, cell growth, and cancer. Exp. Cell Res. 261, 111–118. [DOI] [PubMed] [Google Scholar]
- Strålfors, P. (1990). Autolysis of isolated adipocytes by endogenously produced fatty acids. FEBS Lett. 263, 153–154. [DOI] [PubMed] [Google Scholar]
- Strålfors, P., and Honnor, R.C. (1989). Insulin-induced dephosphorylation of hormone-sensitive lipase. Correlation with lipolysis and cAMP-dependent protein kinase activity. Eur. J. Biochem. 182, 379–385. [DOI] [PubMed] [Google Scholar]
- Trigatti, B.L., Anderson, R.G., and Gerber, G.E. (1999). Identification of caveolin-1 as a fatty acid binding protein. Biochem. Biophys. Res. Commun. 255, 34–39. [DOI] [PubMed] [Google Scholar]
- Uehara, K., and Miyoshi, M. (1999). Tubular invaginations with caveolae and coated pits in the sinus endothelial cells of the rat spleen. Histochem. Cell Biol. 112, 351–358. [DOI] [PubMed] [Google Scholar]
- Vinten, J., Voldstedlund, M., Clausen, H., Christiansen, K., Carlsen, J., and Tranum-Jensen, J. (2001). A 60-kDa protein abundant in adipocyte caveolae. Cell Tissue Res. 305, 99–106. [DOI] [PubMed] [Google Scholar]
- Voldstedlund, M., Tranum-Jensen, J., and Vinten, J. (1993). Quantification of Na+/K+-ATPase and glucose transporter isoforms in rat adipocyte plasma membrane by immunogold labeling. J. Membr. Biol. 136, 63–73. [DOI] [PubMed] [Google Scholar]
- Westermann, M., Leutbecher, H., and Meyer, H.W. (1999). Membrane structure of caveolae and isolated caveolin-rich vesicles. J. Histochem. Cytochem. 111, 71–81. [DOI] [PubMed] [Google Scholar]
- Williamson, J.R. (1964). Adipose tissue. Morphological changes associated with lipid mobilisation. J. Cell Biol. 20, 57–74. [DOI] [PMC free article] [PubMed] [Google Scholar]
- Yamada, E. (1955). The fine structure of the gall bladder epithelium of the mouse. J. Biophys. Biochem. Cytol. 1, 445–458. [DOI] [PMC free article] [PubMed] [Google Scholar]
Associated Data
This section collects any data citations, data availability statements, or supplementary materials included in this article.
Supplementary Materials
MBC Video
