Synergistic effects of MAP2 and MAP1B knockout in neuronal migration, dendritic outgrowth, and microtubule organization (original) (raw)
Abstract
MAP1B and MAP2 are major members of neuronal microtubule-associated proteins (MAPs). To gain insights into the function of MAP2 in vivo, we generated MAP2-deficient (map_2−/−) mice. They developed without any apparent abnormalities, which indicates that MAP2 is dispensable in mouse survival. Because previous reports suggest a functional redundancy among MAPs, we next generated mice lacking both MAP2 and MAP1B to test their possible synergistic functions in vivo. Map2 − /−_map1b −/− mice died in their perinatal period. They showed not only fiber tract malformations but also disrupted cortical patterning caused by retarded neuronal migration. In spite of this, their cortical layer maintained an “inside-out” pattern. Detailed observation of primary cultures of hippocampal neurons from map2 −/−_map1b −/− mice revealed inhibited microtubule bundling and neurite elongation. In these neurons, synergistic effects caused by the loss of MAP2 and MAP1B were more apparent in dendrites than in axons. The spacing of microtubules was reduced significantly in map2 −/−_map1b −/− mice in vitro and in vivo. These results suggest that MAP2 and MAP1B have overlapping functions in neuronal migration and neurite outgrowth by organizing microtubules in developing neurons both for axonal and dendritic morphogenesis but more dominantly for dendritic morphogenesis.
Keywords: MAP1B; MAP2; neuronal migration; dendrite; microtubule
Introduction
Microtubule-associated proteins (MAPs)* a group of filamentous proteins copurified with tubulin through repetitive cycles of depolymerization and reassembly, have been demonstrated to promote assembly of tubulin, bind and stabilize microtubules (MTs), and form cross-bridge structures between MTs. They are considered to play an important role in neuronal morphogenesis (for review see Hirokawa, 1991, 1994). Diversities of MAPs are expressed in both the central and peripheral nervous systems (CNS and PNS, respectively). MAP1B (also known as MAP1.2, MAP1x, or MAP5) and MAP2 are among the most abundant neuronal MAPs. Both proteins are expressed in a developmentally regulated manner. MAP1B is expressed prominently during early stages of neuronal development (for review see Tucker, 1990); in contrast, MAP2 is present at both early and late stages. MAP2 has three isoforms, MAP2A, B, and C. MAP2C is localized in cell bodies, dendrites, and axons of juvenile neurons, whereas MAP2A and B are localized mainly in dendrites of mature neurons (for review see Sanchez et al., 2000).
Several efforts have been made to elucidate the functions of MAPs in vivo by analyzing a series of knockout mice. Analysis of tau knockout mice revealed a decrease in the number of MTs in small caliber axons; however, they have extended axons indistinguishable from those of wild-type controls (Harada et al., 1994). MAP1B-deficient mice have shown an abnormal brain architecture including delayed myelination, reduced axon caliber, tract malformation, and layer disorganization (Edelmann et al., 1996; Takei et al., 1997, 2000; Gonzalez-Billault et al., 2000; Meixner et al., 2000). On the other hand, phenotypes analysis of MAP2-deficient mice has never been reported.
In this study, we present data of MAP2-deficient (_map_2−/−) mice that showed a normal cytoarchitecture of their nervous system. We considered that MAP1B may share functions with MAP2 and could compensate for the loss of MAP2 based on the following reasons. (a) They are colocalized in both axons and dendrites, particularly in developing neurons, whereas in later stages MAP2 is localized mainly in dendrites (Hirokawa, 1991, 1994). They form cross-bridge structures between MTs (Sato-Yoshitake et al., 1989; Hirokawa, 1991; 1994). In the case of Tau and MAP2, they were suggested to determine the MT spacing in axons and dendrites, respectively (Chen et al., 1992). (b) Studies using an in vitro culture system suggest that MAP2 and MAP1B have similar functions in neuronal morphogenesis. Attenuation of expression of either MAP1B expression in PC12 cells (Brugg et al., 1993) or casein kinase II, which catalyzes a site-specific phosphorylation of MAP1B (Ulloa et al., 1993) in neuroblastoma cells by antisense oligodeoxynucleotides has indicated the inhibition of neuritogenesis. Suppression of MAP2 expression in cultured cerebellar macroneurons (Caceres et al., 1992) or in rat cortical neurons (Sharma et al., 1994) has also indicated the inhibition of neurite outgrowth concomitant with disorganized MTs. (c) MAP2 and MAP1B are similar in their effects on MT dynamics and organization in vitro. Both of them can promote tubulin assembly and bind and stabilize MTs (Hirokawa, 1994; Tögel et al., 1998). (d) In the case of axonal elongation, Tau and MAP1B have overlapping functions in MT organization, particularly in their neuronal growth cones (Takei et al., 2000; Garcia and Cleveland, 2001).
With these as a background, we generated mice with disrupted map2 and map1b genes to study the possible synergistic functions of MAP2 and MAP1B in vivo. The loss of MAP2 and MAP1B in mice leads to perinatal lethality. Our findings are summarized as follows. (a) There were striking abnormalities in their cortical and subcortical cytoarchitectures. Neuronal birth-dating analyses revealed a significant retardation in neuronal migration. The packing order of cortical neurons in map2 −/−map1b −/− mice was in an “inside-out” pattern, which is different from that of reeler mice. (b) There was suppression of axonal and dendritic elongation and microtubule bundling in cultured neurons from the mutant mice. Synergistic effects caused by the loss of MAP2 and MAP1B were more apparent in dendrites than in axons. (c) Distances between MTs were reduced markedly in both axons and dendrites. This study demonstrated clearly that MAP2 and MAP1B cooperatively play significant functions for both axonal and dendritic morphogenesis, whereas their roles in dendritic morphogenesis are more dominant.
Results
MAP2 is not essential for mouse survival
A gene-targeting vector with a neo cassette inserted into the exon coding the first MT-binding repeat of MAP2 was constructed. The location of neo insertion is indicated by an arrow in Fig. 1 A. The disrupted exon corresponds to exon 15 of the human map2 gene (Kalcheva et al., 1995). The vector was electroporated into embryonic stem cells, and homologous recombinant clones were isolated. Germline chimeras were established and mice, heterozygous (_map_2+/−) and homozygous (_map_2−/−) for the mutated map2 gene, were produced by a conventional gene-targeting method (Harada et al., 1994). They were viable, fertile, and grew without any lethalities. They appeared healthy in their normal cage environment. To examine the effects of the mutation introduced into the map2 gene, we analyzed the expression of MAP2 in the brains of the _map_2−/− mice by Western blotting. The complete loss of MAP2 immunoreactivities in the _map_2−/− mutant mice was shown clearly by analysis using seven monoclonal antibodies (Fig. 1, A and B, the location of specific epitopes in MAP2 is shown in Fig. 1 A). No smaller protein corresponding to the NH2 terminus of the MAP2 was detected, which suggests that if a truncated protein without MT-binding domain was produced it would be unstable.
Figure 1.
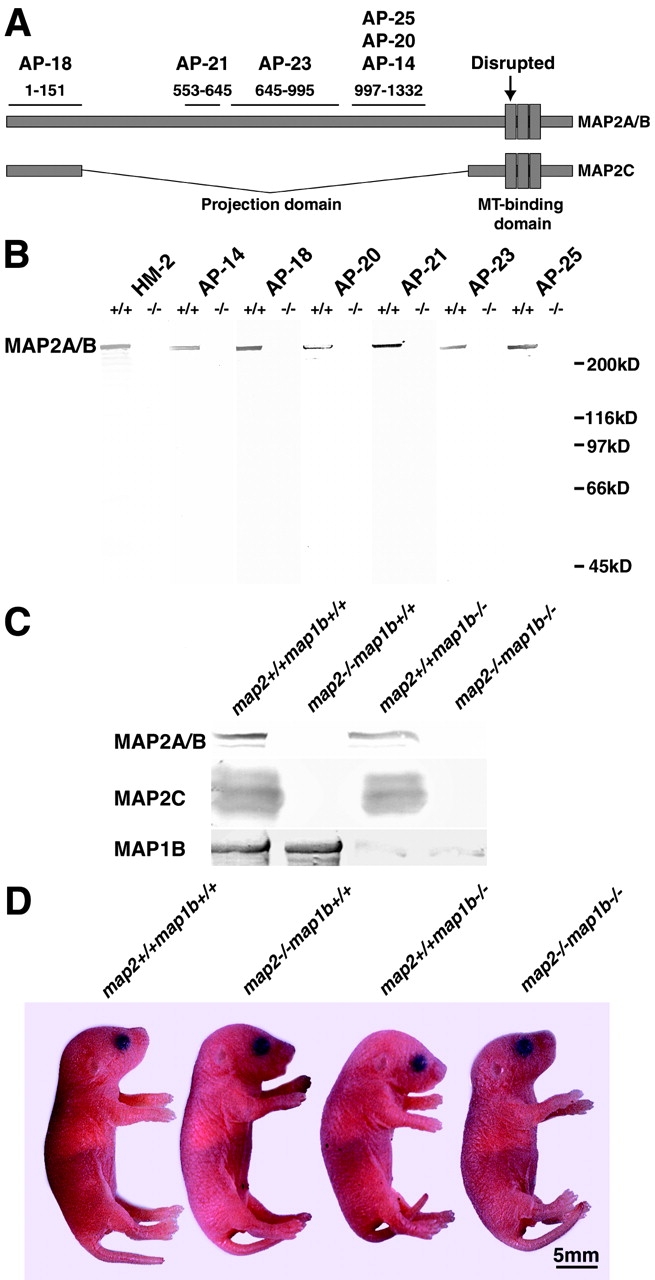
Targeted disruption of the map2 gene. (A) Diagrammatic representation of MAP2 structure. Epitopes of six anti-MAP2 mAbs (Kalcheva et al., 1994) are shown. The neo cassette (Harada et al., 1994) is inserted at the point indicated by an arrow. (B) Western blotting of crude extracts of the whole brain with a series of anti-MAP2 mAbs (HM2, AP-14, AP-18, AP-21, AP-22, AP-24, and AP-25). Mice at 8 w old were analyzed. Note the absence of MAP2 immunoreactivity in all map2 −/− lanes. (C) Immunoblot analysis of crude extracts from P0 mouse brain with the anti-MAP2 mAb HM2 and the anti-MAP1B antiserum 3d2. (D) Appearance of map2 +/+ map1b +/+, map2 −/−map1b +/+, map2 +/+ map1b −/−, and map2 −/−map1b −/− mice at P0.
Next, we performed Western blotting of crude extracts from mouse brains at postnatal day (P)0 to examine the juvenile isoform, MAP2C. MAP2C immunoreactivity was also absent in the juvenile _map_2−/− mutant (Fig. 1 C).
Thus, all three isoforms of MAP2 (MAP2A, B, and C) were absent in the crude extracts from _map_2−/− mouse brains at P0 (Fig. 1 C), and the mutation introduced into the murine map2 gene abolishes all expression of MAP2. From these results, it appears that MAP2 is not essential for basic neuronal development.
Perinatal lethality in map2 − **/**−map1b − **/**− mice
We hypothesized that some other neuronal MAPs could compensate for the lack of MAP2 and that the candidate is MAP1B based on reasons summarized in the introduction. To test this hypothesis, double homozygous mice with disrupted map2 and map1b genes (map2 −/−map1b −/−) were generated by intercrossing map2 +/−map1b +/− double heterozygous mice, which were obtained by crossing a map2 −/− mouse line with a map1b −/− mouse line (Takei et al., 1997). Map2 +/−map1b +/− mice developed normally and are indistinguishable from map2 +/+ map1b +/+mice. Map2 −/− map1b −/− mice could not survive beyond P0, whereas both map2 −/−, map1b +/+, and map2 +/+ map1b −/− mice were viable at this stage (Takei et al., 1997, 2000). There was no significant difference in the body size between map2 −/− map1b −/− mice and mice of other genotypes (Fig. 1 D). MAP2 could not be detected in brain lysates derived from map_2−/−_map1b −/− mice, whereas anti-MAP1B antibodies very faintly stained a band of protein in brain lysates from _map_2+/+ map1b −/− and map_2−/−_map1b −/− mice (Fig. 1 C). This faint immunoreactivity is suggested to be derived from a minor transcript, encoding an NH2 terminally truncated MAP1B (Takei et al., 1997), which might render the phenotypes of the map1b −/− mice more moderate than those of a newly reported map1b mutant (MAP1BΔ93), which have a complete deletion of the map1b gene (Meixner et al., 2000).
Unique neuropathological findings in map2 − **/**−map1b − **/**− mice
The dominant expressions of MAP2 and MAP1B in the brain were suggestive of possible neuronal dysfunction in map2 −/−map1b −/− mice. Histopathological analysis of the brain sections revealed abnormalities in the layer formation and the positioning of neurons in the brains of map2 −/− map1b −/− mice (Fig. 2). Normal stratification of neocortical neurons was not observed in their cerebral cortex where the molecular layer was thinner than that of map2 +/+ map1b +/+ mice, the supra-/infragranular parts were unclear, and the subplate was diffuse (Fig. 2 D). The hippocampus was affected also, showing a dispersed arrangement of cell layers (Fig. 2 H). Many other parts of the brain, including the olfactory bulb and cerebellum, exhibited disrupted laminar structures (unpublished data). The inferior olivary complex showed an abnormal folding similar to that of reeler mice (Fig. 2 L) (Goffinet, 1984). Inordinate separation of the basilar pons cells was also observed (Fig. 2 P, arrows). On the other hand, map2 −/−map1b +/+ mice (Fig. 2, B, F, J, and N) showed no apparent abnormalities in the layer formation compared with map2 +/+ map1b +/+ mice (Fig. 2, A, E, I, and M). The brains of map2 +/+ map1b −/− mice did show defects in laminar formation (Fig. 2, C, G, K, and O), which were similar to but not as drastic as those observed in map2 −/− map1b −/− brains (PFig. 2, D, H, L, and P).
Figure 2.
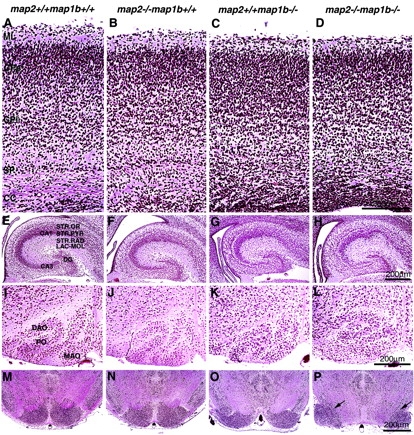
Histopathology of the brain. Bodian-stained paraffin-embedded coronal sections of brains of map2 +/+ map1b +/+, map2 −/−map1b +/+, map2 +/+ map1b −/−, and map2 −/−map1b −/− mice at P0. (A–D) Cerebral cortex. The cortical layering is disrupted in map2 −/−map1b −/− mice. CC, corpus callosum; CPi, infragranular part; CPs, supragranular parts; ML, molecular layer; SP, subplate. (E–H) Hippocampus. Note the dispersed arrangement of pyramidal cells in map2 −/−map1b −/− mice. CA1, CA1 field; CA3, CA3 field; DG, dentate gyrus; LAC-MOL, lacunosum and molecule; STR.OR, stratum oriens; STR.PYR, stratum pyramidale; STR.RAD, strata radiatum. (I–L) The inferior olivary complex. Abnormal fold-ing was observed in map2 +/+ map1b −/− (K) and map2 −/−map1b −/− mice (L). DAO, dorsal accessory olive; MAO, medial accessory olive; PO, principal olive. (M–P) Pons. The nuclei of pons were separated completely at midline in map2 −/−map1b −/− mice (P, arrows).
Fiber tract malformation was another striking abnormality in the brains of map2 +/+ map1b −/− and map2 −/−map1b −/− mice (Fig. 3). In the brains of map2 −/−map1b −/− mice, the corpus callosum, one of the major telencephalic fiber tracts, was not connected between hemispheres and formed aberrantly oriented fibers (Fig. 3 H, arrowheads) called Probst's bundles (Fig. 3 D, Pb) in all of the map2 −/−map1b −/− mice examined (we examined five animals for each genotype). The corpus callosum was formed normally in all map2 +/+ map1b +/+ (Fig. 3, A and E) and map2 −/−map1b +/+ mice (Fig. 3, B and F). In map2 +/+ map1b −/− mice, the size of the corpus callosum decreased (Fig. 3, C and G). The size of the septum pellucidum in map2 −/−map1b −/− mouse brains (Fig. 3 D, asterisk) increased significantly compared with that in map2 +/+ map1b +/+, map2 −/−map1b +/+, and map2 +/+ map1b −/− mouse brains (Fig. 3, A–C). The lateral ventricles had an abnormal shape in the map2 −/−map1b −/− mouse forebrain (Fig. 3 D, arrowheads), possibly under the pressure of Probst's bundles. Other fiber tracts such as the anterior commissure (Fig. 3 D, arrows) and pyramidal tract (unpublished data) were also hypoplastic in map2 −/−map1b −/− mice. These defects in fiber tracts were also observed in the brains of map2 +/+ map1b −/− mice (Fig. 3, C and G), although the severity of the defects was significantly greater in the brains of map2 −/−map1b −/− mice (Fig. 3, D and H) than those of map2 +/+ map1b −/− mice. The brains of map2 −/−map1b +/+ mice showed normal tracts (Fig. 3, B and F). Next, we measured the size of the anterior commissure to compare the axon tract development of each genotype quantitatively (Fig. 3 I). The size of the anterior commissure in the brains of map2 −/−map1b +/+ mice did not differ from that of map2 +/+ map1b +/+ mice (P > 0.05, post hoc test), whereas this decreased in the brains of map2 +/+ map1b −/− (P < 0.05) and map2 −/−map1b −/− mice (P < 0.01) compared with that of map2 +/+ map1b +/+ mice. The anterior commissure in the brains of map2 −/−map1b −/− mice is significantly smaller than that of map2 +/+ map1b −/− mice (P < 0.05).
Figure 3.
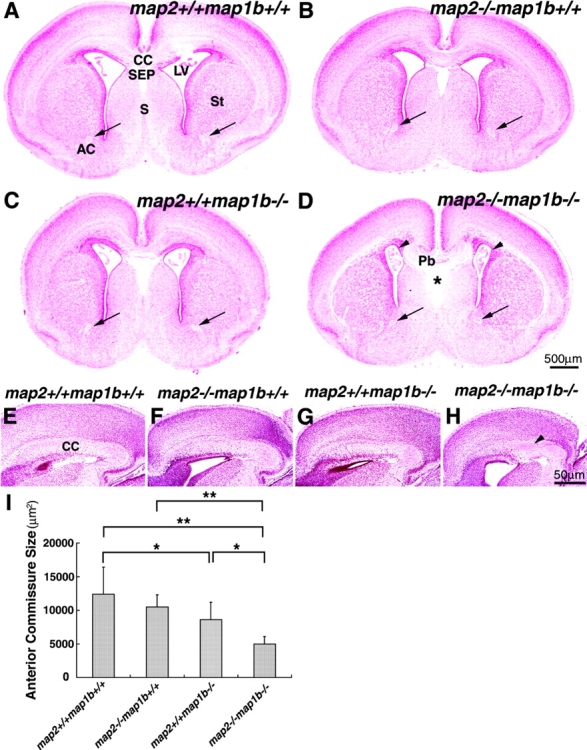
Abnormalities in fiber tract formation in map2 − **/**− map1b − **/**− mice. (A–H) Bodian-stained sections of brains of map2 +/+ map1b +/+, map2 −/−map1b +/+, map2 +/+ map1b −/−, and map2 −/−map1b −/− mice at P0. (A–D) Coronal sections of cerebrum. Note the disconnection of the corpus callosum with the formation of Probst's bundle in map2 −/−map1b −/− mice (D). The anterior commissure is indicated by arrows. Asterisk indicates the enlarged septum pellucidum, and arrowheads indicate abnormally shaped lateral ventricles in map2 −/−map1b −/− mice (D). AC, anterior commissure; CC, corpus callosum; LV, lateral ventricle; Pb, Probst's bundles; S, septum; SEP, septum pellucidum; St, striatum. (E–H) Sagittal views of the corpus callosum. The map2 −/−map1b −/− mice present aberrantly oriented fiber of the corpus callosum (H, arrowhead). (I) Comparison of anterior commissure size. Coronal sectional areas of anterior commissure at P0 were compared. Each bar represents the mean ± SD of five mice for each genotype. *P < 0.05; **P < 0.01 (post hoc test).
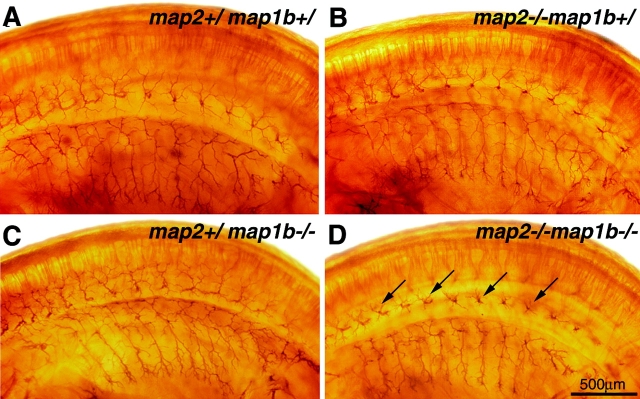
These findings raised the following two questions. First, were the abnormalities in axon tract formation primarily due to the defect in neurite outgrowth or secondary to the abnormal positioning of neurons? Second, was the axon tract malformation restricted to CNS or common in both CNS and PNS? To answer these issues, we examined the neurites of embryonic PNS by immunostaining whole embryos at embryonic day (E)12 using the monoclonal neurofilament antibody 2H3 (Fig. 4). The outgrowth of spinal nerves was markedly retarded in map2 −/−map1b −/− embryos without aberrant positioning of the neuronal cell bodies (Fig. 4 D, arrows). Nerve fibers were also fasciculated normally in these embryos. Thus, it was concluded that retarded neurite outgrowth is not due to the perturbed neuronal migration. That is, both neuronal migration and neurite outgrowth are primarily affected by the lack of MAP2 and MAP1B and that both CNS and PNS display defects in neurite outgrowth.
Figure 4.
Whole-mount immunostaining of E12 embryos using antineurofilament antibodies (2H3). Impaired outgrowth of spinal nerves in map2 −/−map1b −/− embryos (D, arrows).
Defects in neuronal migration
To get insights into the pathogenesis of cortical dysgenesis in map2 −/−map1b −/− mice, we first examined the subplate neurons at E17 by immunohistochemistry using the monoclonal antibody, CS56, a marker of subplate neurons (Bicknese et al., 1994) (Fig. 5, A–D). The preplate of map2 −/−map1b −/− mice had divided into the subplate and marginal zones, although the subplate cells showed abnormally diffuse cellular architecture (Fig. 5 D, arrows). Next, we performed neuronal birth-dating experiments to get insights into the pathogenesis of cortical dysgenesis (Fig. 5, E–L). We injected BrdU into pregnant female mice at E12 and E14 and examined brains of their pups at E18. When BrdU was injected at E12, no significant difference was found in the distribution pattern of labeled cells among map2 +/+ map1b +/+, map2 −/−map1b +/+, map2 +/+ map1b −/−, and map2 −/−map1b −/− mice (Fig. 5, E–H and M) where the majority of positive cells were localized in the deep layer of the cerebral cortex (Fig. 5, E–H and M, CPi and SP). On the other hand, when BrdU was injected at E14, the distribution pattern of labeled cells in map2 −/−map1b −/− mice was different from that in map2 +/+ map1b +/+, map2 −/− map1b +/+, and map2 +/+ map1b −/− mice (Fig. 5, I–L and N). In map2 −/−map1b −/− mice, the number of labeled neurons located in the superficial layers (Fig. 5, L and N, CPs) decreased significantly compared with those in mice of other genotypes (Figs. 5, I–K and N, CPs). These data indicate that the delay of neuronal migration in the cortex of map2 −/− map1b −/− mice is limited to cells generated at a specific period and that the cortex of map2 −/−map1b −/− mice has a normal inside-out packing order of neurons. That is, neurons generated earlier reside in deeper layers, whereas neurons born later occupy more superficial layers.
Figure 5.
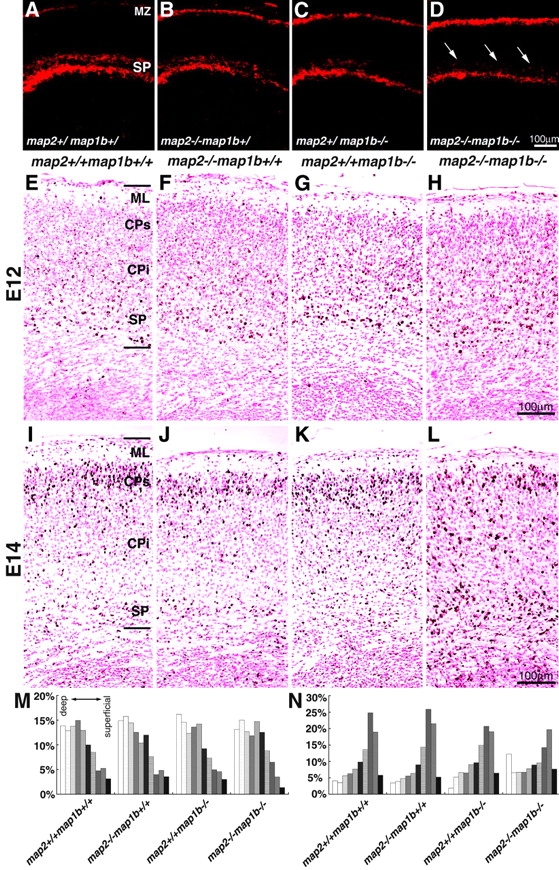
Retarded neuronal migration in map2 −**/−map1b−/**− mice. (A–D) Characterization of the subplate layer at E17. Coronal sections were immunostained with an anti-CSPG antibody (CS56), which is a marker for subplate neurons. Note the dispersed arrangement of the subplate neurons of the map2 −/−map1b −/− mouse cortex (D, arrows). (E–N) Neuronal birth-dating analysis. Pregnant map2 +/−map1b +/− mice were injected with BrdU at E12 and E14. Pups were fixed at E18. Coronal sections of the forebrains. The sections were immunostained with anti-BrdU antibodies and counterstained with nuclear fast red. (E–H) Labeling with BrdU at E12. The distribution pattern of labeled neurons showed no significant difference between mice of different genotypes. (I–L) Labeling at E14. Labeled neurons were observed predominantly in the superficial layers in map2 +/+ map1b +/+ mice (I), whereas many of the labeled neurons remained in the deeper half of the cortex in map2 −/−map1b −/− mice (L). (M and N) Histograms of the E12 (E–H; M) and E14 (I–L; N) birth-dating experiment. Bar shows the distribution of BrdU-labeled neurons in each bin. Lines indicate deep and superficial cortical boundaries. ML, molecular layer; MZ, marginal zone; CPi, infragranular part of cortex; CPs, supragranular part of cortex; SP, subplate layer.
One possible mechanism that explains the retardation in neuronal migration is that the radial glial fibers, which guide postmitotic neurons during their migration, are altered or absent in map2 −/−map1b −/− mice. To examine the radial glial fiber system, E17 cortices were stained with the monoclonal antibody RC2, a marker for radial glial cells (Misson et al., 1988). At E17, the density of radial glial fibers, which ran a course perpendicular to the pial surface, decreased slightly in map2 +/+ map1b −/− and map2 −/−map1b −/− mice, whereas there was no difference in the density of radial glial fibers between map2 −/−map1b +/+ and map2 +/+ map1b +/+ mice (unpublished data). This finding indicates that the structural defect of radial glial fibers in map2 −/−map1b −/− mice could affect their neuronal migration. However, MAP2 and MAP1B were expressed predominantly in neurons but were absent in radial glial fibers as revealed by double immunostaining of the murine cortex with RC2 and anti-MAP2 or anti-MAP1B antibodies at E14 (unpublished data). Taken collectively, it seems that altered radial glial structures are not primary defects. Cortical neurons are affected primarily by the deficiency in MAP2 and MAP1B, and disrupted neuron–glia interaction may be responsible for the glial defect.
Since it is known that the lack of reelin results in an abnormal cortical pattern in reeler mice, we compared the expression of Reelin between map2 +/+ map1b +/+ and map2 −/− map1b −/− mice by immunohistochemistry to obtain insights into the possible relationship of the mutant mice with the Reelin pathway. However, map2 −/−map1b −/− mice expressed Reelin in their cortical Cajal-Rezius cells, and there was no difference in the staining pattern between the mice of different genotypes (unpublished data).
Impairment of axonal and dendritic elongation of hippocampal neurons with disrupted MT organization
To compare the neurite development of control and mutant mice, cultured hippocampal neurons were analyzed. This culture system enabled us to investigate the polar development of individual neurons maintained separately from glias (Goslin and Banker, 1998). At first, we examined the expression of MAP2 and MAP1B in cultured hippocampal neurons. In map2 +/−map1b +/+ mouse neurons cultured for 2 d, MAP2 and MAP1B were expressed abundantly in axons and minor processes including their growth cones (unpublished data) as reported previously (Boyne et al., 1995; Cunningham et al., 1997). The majority of map2 +/−map1b +/+ neurons cultured for 3 d developed a single axon and several minor processes (Fig. 6 A). They were classified as neurons at stage 3 of development (Goslin and Banker, 1998). Neurons from map2 −/− map1b +/+, map2 +/−map1b −/−, and map2 −/−map1b −/− mice were also polarized. Map2 +/−map1b +/+ and map2 −/− map1b +/+ mouse neurons did not differ in their lengths of axon and dendritic minor processes (P > 0.05, post hoc test) (Fig. 6, A and B, and Table I). However, the neurite lengths of map2 +/−map1b −/− and map2 −/−map1b −/− mouse neurons (Fig. 6, C and D) decreased significantly compared with those of map2 +/−map1b +/+ mouse neurons (P < 0.01) (Table I). We compared the neurite lengths between map2_ +/−map1b −/− and map2 −/−map1b −/− mouse neurons. The lengths of minor processes of map2 −/− map1b −/− mouse neurons were significantly shorter than those of map2 +/−map1b −/− ones (P < 0.05), whereas the length of axons did not differ between the two mouse genotypes (_P_ > 0.05) (Fig. 6, C and D, and Table I). Taken together, map2 and map1b mutations have cell autonomous effects on neurite outgrowth, which is more synergistic in dendritic minor processes than in axonal ones. After 18 d of culture, the difference in the dendritic length between map2 −/−_map1b −/− and the control or single knockout mouse neurons becomes more apparent as shown in Fig. 6, E–H. In these figures, dendrites are visualized by immunostaining using an anti-GluR1 antibody.
Figure 6.
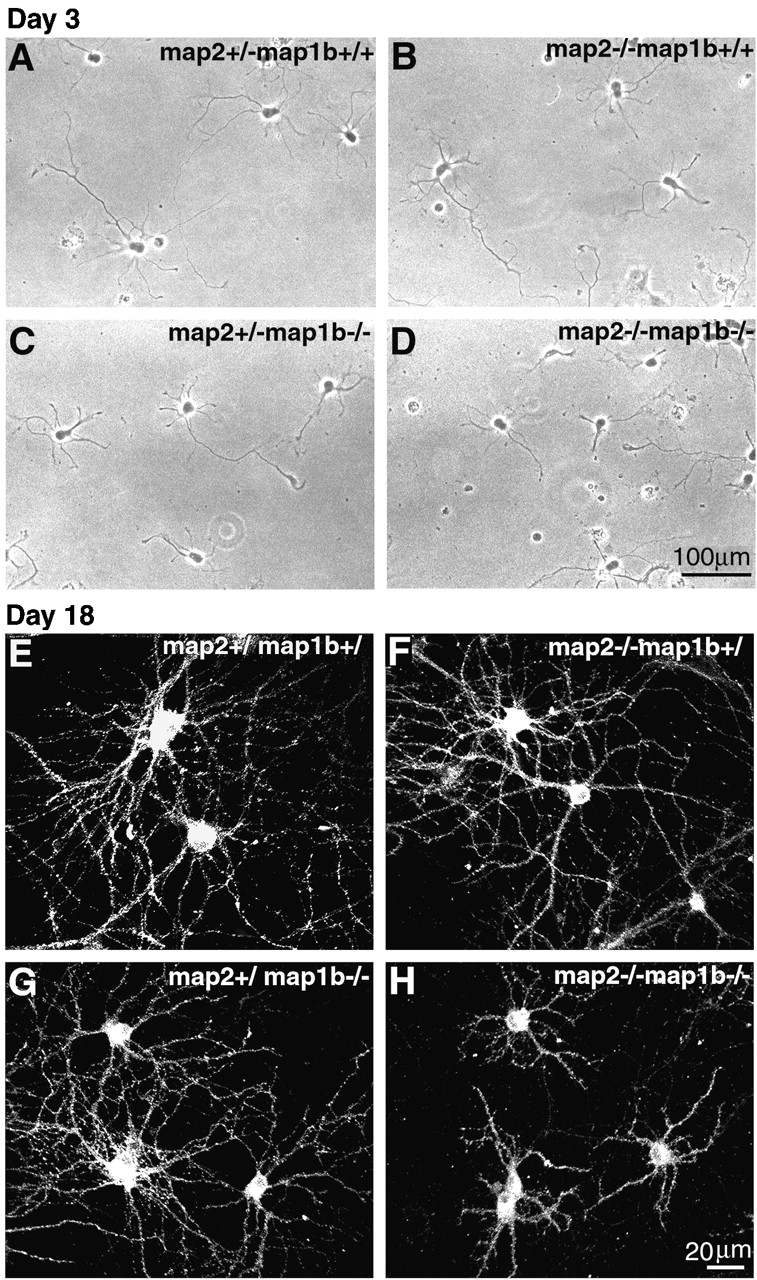
Phenotypes of cultured hippocampal pyramidal neurons. (A–D) Representative hippocampal neurons after 3 d of culture. Phase–contrast micrographs of neurons obtained from map2 +/−map1b +/+ (A, control), map2 −/−map1b +/+ (B), map2 +/−map1b −/− (C), and map2 −/−map1b −/− (D) mice. (E–H) Dendrites are visualized by immunostaining of neurons cultured for 18 d using an anti-GluR1 antibody. The lengths of dendrites of map2 −/−map1b −/− neurons (H) were significantly shorter than those of neurons of other genotypes (E–G).
Table I. Quantitative comparison of neurite development in cultured hippocampal neurons.
| Neurite length after 3 d in culture | ||||
|---|---|---|---|---|
| Genotype map2map1b | Axon | Minor process | ||
| Mean ± SD | n | Mean ± SD | n | |
| μm | μm | |||
| +/− +/+ | 186.4 ± 54.4a | 90 | 43.5 ± 18.4a | 424 |
| −/− +/+ | 153.2 ± 49.8a | 90 | 41.0 ± 17.5a | 391 |
| +/− −/− | 107.6 ± 41.3 | 90 | 32.6 ± 12.7a | 389 |
| −/− −/− | 101.0 ± 41.8 | 90 | 27.7 ± 11.3 | 380 |
Rescue of MAP1B deficiency by MAP2C
We performed a rescue experiment to confirm if MAP2 and MAP1B have overlapping functions in neurite development. An adenoviral vector encoding EGFP-tagged MAP2C was used for the expression of MAP2C in cultured hippocampal neurons, and the lengths of axons were quantitated. In the coverslips exposed to the viral vector, >95% of neurons were GFP-positive (Fig. 7, E–H). The axonal lengths of map2 +/−map1b −/− and map2 −/−map1b −/− mouse neurons expressing exogenous MAP2C were increased compared with those of noninfected neurons (P < 0.05, post hoc test) (Fig. 7, C, D, G, H, and I). On the other hand, there was no statistical difference in the axonal length between noninfected and infected neurons in the experiment using map2 −/− map1b +/− mouse neurons (Fig. 7 I). This indicates that the effect of exogenous MAP2C expression on the MAP2 deficiency is negligible in this rescue experiment because the axonal defect caused by MAP2 deficiency was rather subtle and that the enhanced axonal growth observed in map2 +/− map1b −/− and map2 −/−map1b −/− mouse neurons was mainly a result from a rescue of MAP1B deficiency. Taken collectively, the function of MAP1B could be partially complemented by MAP2C, suggesting that MAP2 and MAP1B have an overlapping function.
Figure 7.
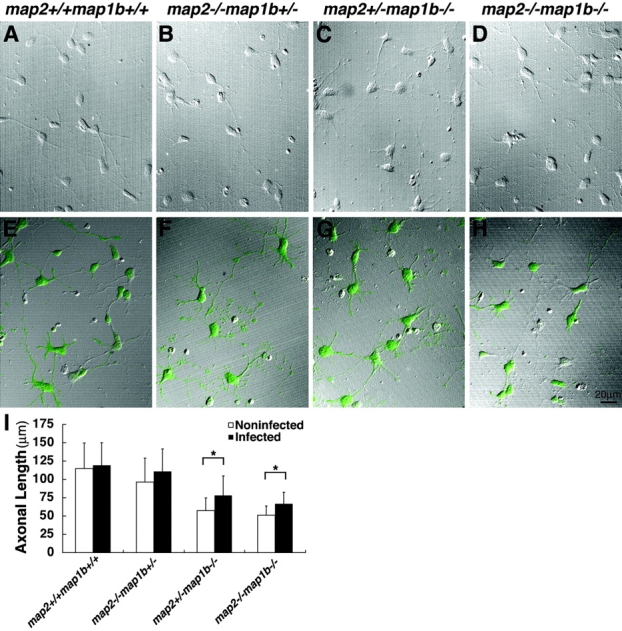
Rescue experiments. (A–D) Noninfected control cultured hippocampal neurons of each genotype. (E–H) Neurons cultured for 3 d after infection with adenoviral vectors encoding EGFP-tagged MAP2C. Green color indicates neurons expressing MAP2C. (I) Quantification of the axonal length. In map2 +/−map1b −/− and map2 −/−map1b −/− mouse neurons after infected with adenoviral vectors, the lengths of axons of infected neurons were significantly longer than those of noninfected controls. Each bar represents the mean ± SD of at least 60 neurons for each genotype. *P < 0.05 (post hoc test).
Disorganized MTs in growth cones
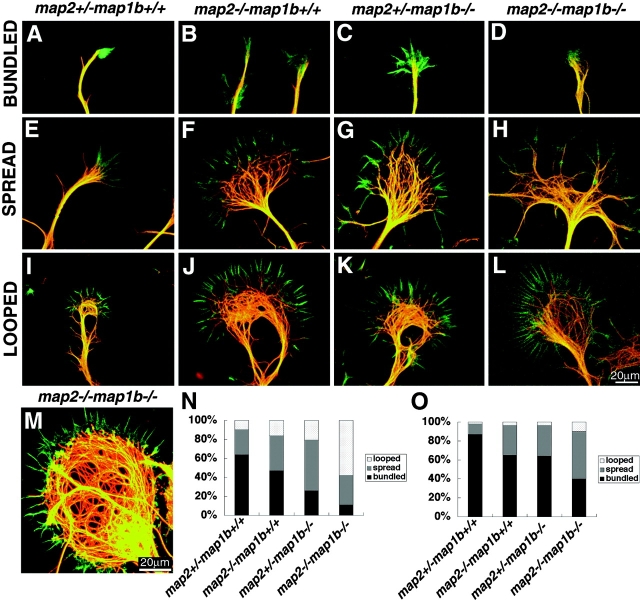
Next, we examined the cytoskeletal organization of cultured neurons to get insights into the cellular pathophysiology underlying the defects in neurite elongation. We focused on the growth cones because they are a key element for a neuron to extend its axons and dendrites. We double labeled cells cultured for 2 or 8 d with an antityrosinated α-tubulin antibody and FITC-phalloidin (Fig. 8) and observed their growth cones. In the majority of growth cones of map2 +/− map1b +/+ mouse neurons, MTs were bundled together into tight arrays around the central region, which was surrounded by a radially oriented array of F-actin (Figs. 8, A, N, and O). In contrast, MTs of the neurons from map2 −/− map1b −/− mice were dispersed frequently with or without loops (Fig. 8, H and L) throughout the growth cone with a less tendency to form bundles (Fig. 8, N and O). These growth cones with dispersed MTs exhibited an unusually large size where the mass of MTs often formed a disorganized network (Fig. 8 M).
Figure 8.
Morphology of growth cones in cultured hippocampal pyramidal neurons. (A–M) Cells were double labeled with phalloidin (green) and a monoclonal antibody against tyrosine tubulin TUB-1A2 (red). Examples of bundled (A–D), spread (E-H), and looped (I-L) MTs in the growth cones after 2 d of culture of neurons from each genotype are shown. (M) Example of the abnormal cytoskeletal mass of growth cones from 8-d-old cultured neurons of map2 −/−map1b −/− mice. (N and O) Histograms of the percentages of three types of MT organization of the growth cones in axons (N) and minor processes (O).
Altered MT spacing in vitro and in vivo
We performed electron microscopic analysis to examine the possible MT change in the neuritic shafts of cultured neurons because immunofluorescence microscopy does not have sufficient resolution for discriminating a single MT in them. In neuritic shafts of map2 +/−map1b +/− mouse neurons, MT polymers ran parallel to each other, and the spacing between MTs was maintained appropriately by cross-bridges of MAPs (Fig. 9 A). However, the MT spacing was disrupted in neurons from map2 −/−map1b −/− mice where MTs often become closer to, and contacted each other at their sides (Fig. 9 B, arrows).
Figure 9.
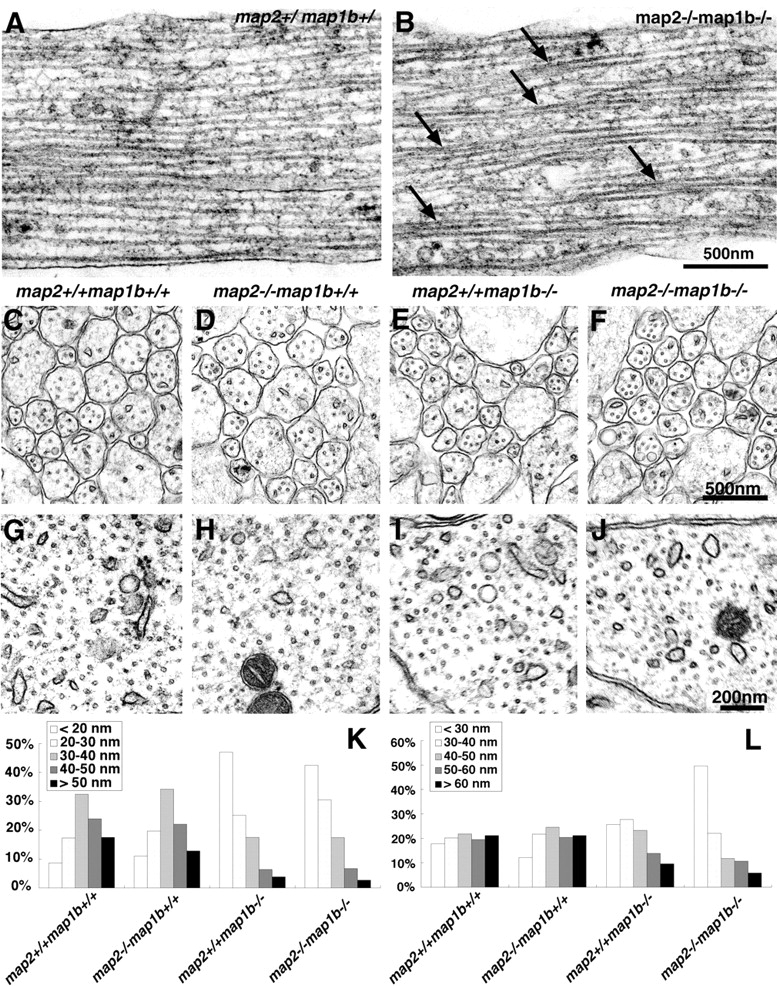
Decreased spacing between MTs in map2 − **/**− map1b − **/**− mice. (A and B) Electron micrographs of neuritic shafts of cultured hippocampal neurons from control (map2 +/−map1b +/−) and map2 −/−map1b −/− mice. MT spacing decreased with many contacting MTs in map2 −/−map1b −/− mouse neurons (B, arrows). (C–J) Cross section of the callosal axons (C–F) and CA1 region of the hippocampal pyramidal cell dendrites (G–J) at P0. (K and L) Compilation of wall-to-wall distances between the nearest adjacent MTs in corpus callosum axons (K) and CA1 region of the hippocampal pyramidal cell dendrites (L). n = 496 (map2 +/+ map1b +/+), n = 570 (map2 −/−map1b +/+), n = 548 (map2 +/+ map1b −/−), and n = 623 (map2 −/−map1b −/−) for K; n = 492 (map2 +/+ map1b +/+), n = 387 (map2 −/− map1b +/+), n = 426 (map2 +/+ map1b −/−), and n = 272 (map2 −/−map1b −/−) for L.
The altered MT organization observed in cultured cells led us to investigate the possible change in the organization of MTs in vivo in neurons from map2 −/−map1b −/− mice. The axons of corpus callosum (Fig. 9, C–F) and dendrites of hippocampal pyramidal neurons in the CA1 field (Fig. 9, G–J) were examined by electron microscopy. We measured the average wall-to-wall distances between the nearest MTs. In the corpus callosum, the average distances were 38.3 ± 12.2 nm (mean ± standard deviation, n = 496) for map2 +/+ map1b +/+ mice, 36.5 ± 12.5 nm (n = 570) for map2 −/− map1b +/+ mice, 24.2 ± 11.9 nm (n = 5, map2 −/−map1b −/− 48) for map2 +/+ map1b −/− mice, and 24.7 ± 11.3 nm (n = 623) for map2 −/−map1b −/− mice. A significant difference in the distance was observed between map2 −/−map1b −/− and map2 +/+ map1b +/+ mice (P < 0.01, post hoc test); however, there was no difference between map2_ +/+ map1b +/+ and map2 −/−map1b +/+ mice and between map2 +/+ map1b −/− and map2 −/−map1b −/− mice (P > 0.05). The histogram of the spacing between axonal MTs showed a leftward shift for neurons from map2 +/+ map1b −/− and map2 −/−_map1b −/− mice (Fig. 9 K). On the other hand, the distances between MTs in the pyramidal cell dendrites showed a significant leftward shift only for neurons from map2 −/−map1b −/− mice but not for those from map2 +/+ map1b −/− mice (Fig. 9 L). From these data, we deduced that the loss of MAP2 and MAP1B reduced MT spacing in axons and dendrites but more synergistically in dendrites.
Normal vesicle transport
Because neuronal MTs serve as tracks for the membrane organelle transport process, it is possible that the altered MT spacing in neuritic shafts impairs fast axonal transport, resulting in defects in neuritic outgrowth. To test this possibility, we examined vesicle transport in living hippocampal neurons. Vesicles were visualized by infection with recombinant adenoviruses expressing the GAP-43–green fluorescent protein (GFP) fusion protein (Nakata et al., 1998). GAP-43 is a protein that is transported to axons and localized at nerve terminals (Skene, 1989). In both control (map2 +/ map1b +/) and map2 −/−map1b −/− mouse neurons, the GAP-43–GFP fusion protein was targeted and localized to the neurites and growth cones (Fig. 10, A and B, arrows). In the axons, tubular or spherical vesicles were observed to move along the axons in both control and map2 −/−map1b −/− mouse neurons (Fig. 10, C and D, arrowheads). No apparent difference was observed in the movement of vesicles between the genotypes. We measured the speed of the vesicles for quantitative comparison. There was no significant difference in the mean vesicle speed between the genotypes (P > 0.05, Student's t test). The average speed of vesicles in the control is 0.63 ± 0.06 Ìm (mean ± standard deviation), whereas the average speed in map2 −/−map1b −/− mouse neurons is 0.59 ± 0.07 Ìm (from three independent experiments, 69–194 vesicles per experiment were analyzed). This data suggests that the vesicle transport is maintained in spite of the altered MT spacing in neuritic shafts.
Figure 10.
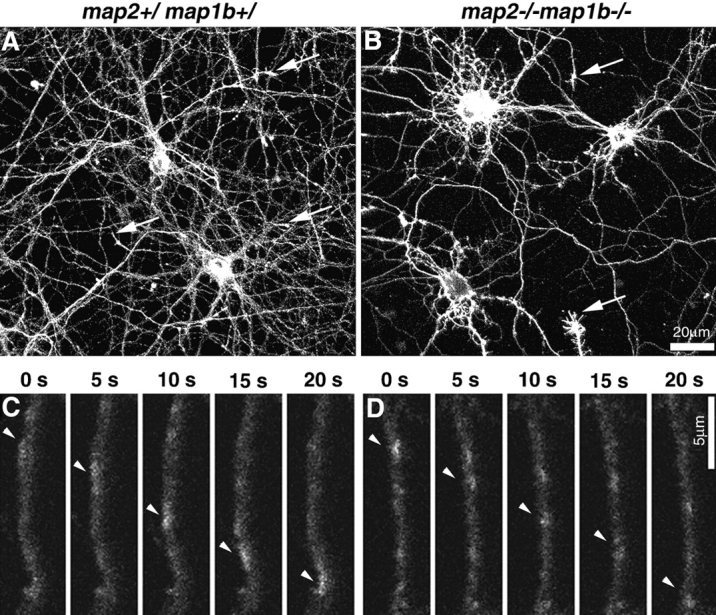
Transport of vesicles containing GAP-43–GFP fusion protein in 18-d-old cultured hippocampal neurons. Neurons were infected with adenovirus vectors carrying GAP-43–GFP chimeric DNA and observed by confocal laser scan microscopy. (A and B) Expression of GAP-43–GFP fusion protein in 18-d-old cultured hippocampal neurons. Growth cones of axons (arrows) of both control and map2 −/−map1b −/− mouse neurons were stained brightly with GAP-43–GFP. (C and D) GAP-43–GFP–containing vesicles are transported along the axon. The interval between frames is 5 s. Arrowheads indicate the vesicle movement.
Discussion
MAP2 and MAP1B act cooperatively in neuronal development
The absence of both MAP2 and MAP1B leads to perinatal lethality, which is far more severe than the phenotypes observed in mice lacking Tau and MAP1B (Takei et al., 2000). map2 −/−map1b −/− mice exhibited a distinctive phenotype with multiple malformations including layer disorganization and tract dysgenesis in both CNS and PNS. These data, combined with the rescue experiment using hippocampal cultures indicates that MAP2 and MAP1B have overlapping functions in neuronal development. These results are also consistent with the fact that MAP2 and MAP1B are among the most abundant MAPs and are coexpressed in the developing nervous system (Tucker, 1990; Hirokawa, 1991, 1994). Our detailed analysis of cultured neurons derived from the mutant mice suggests that MAP2 and MAP1B act more synergistically in dendritic outgrowth. In the case of tau and map1b double knockout mice, synergistic effects were observed in axonal development but not in dendritic development, which is a clear contrast to the case of map2 −/− map1b −/− mice (Takei et al., 2000). Based on these data, it is considered that the pair of MAP2 and MAP1B acts synergistically in dendritic outgrowth and that of tau and MAP1B in axonal outgrowth. These differences could be explained by the finding that Tau and MAP2 are expressed in different compartments of neurons as mentioned in the Introduction.
Role of MAP2 and MAP1B in neuronal migration
Lines of genetic evidence suggest that MTs play central roles in neuronal migration, a critical event in the development of the nervous system. X-linked disease lissencephaly and Miller Dieker lissencephaly caused by doublecortin (des Portes et al., 1998; Gleeson et al., 1998) and Lis1 (Reiner et al., 1993) gene mutations, respectively, are a result of abnormal neuronal migration. Doublecortin has been identified as a novel MAP (Francis et al., 1999; Gleeson et al., 1999), and LIS1 functions as an unconventional MAP (Sapir et al., 1997; Hirotsune et al., 1998). Furthermore, two classic MAPs, Tau and MAP1B, are also involved in neuronal migration (Takei et al., 2000). These data indicate that a disturbance in MT dynamics and/or organization caused by the loss of MAPs results in an abnormal motility of migrating neurons. In the present study, we characterized the phenotypes of MAP2- and MAP1B-deficient mice and conclude that these proteins are synergistically involved in neuronal cell migration.
Based on our neuronal birth-dating analysis, map2 −/− map1b −/− mouse cortical neurons exhibited migration defects without an inverted (outside-in) laminar formation pattern that was reported in reeler and related mutant mice (Rakic, 1988; Sheldon et al., 1997; Trommsdorff et al., 1999). This difference in migratory defects suggests a pathophysiological mechanism in map2 −/−map1b −/− mice that is distinct from that of in reeler mice. One possible explanation is that the loss of regulation by Cdk5/P35 is responsible for the perturbed neuronal migration because the Cdk5/P35 complex may regulate the affinity of MAP2 and MAP1B to MTs by phosphorylation (Paglini et al., 1998; Sanchez et al., 2000), and knockout mice lacking either _cdk_5 or p_35 have represented mice with disrupted cortical layering (Ohshima et al., 1996; Chae et al., 1997). However, this explanation is not adequate because the cortical layering in these mice has an outside-in order, which differs from that observed in map2 −/−_map1b −/− mice. We consider that there are multiple molecular mechanisms in the histogenesis of cortical layers and that MAP2 and MAP1B are involved in a pathway different from the Reelin or Cdk5/P35 pathway.
Organization of growth cone microtubules
The growth cone is a key structure for generating new neurites in which the MT organization is changed sequentially (Tanaka and Sabry, 1995). In brief, the growth cones can be divided into the following three stages: (a) MTs are dispersed and splayed throughout the growth cone; (b) MTs are looped, contorted, and compressed; and (c) MTs are bundled into tight arrays (Tanaka and Kirschner, 1991). In the growth cones from map2 −/−map1b −/− mouse neurons, the frequency of stages 1 and 2 is increased significantly. This suggests that stage 3 was impaired selectively in these neurons due to the loss of MAP2 and MAP1B activities cross-linking MTs. We consider that MTs in map2 −/− map1b −/− mouse growth cones take longer time to form tight arrays, resulting in the increased dispersed and looped MT formations, which could lead to reduced growth cone motility (Tsui et al., 1984; Halloran and Kalil, 1994).
On the other hand, neuronal cell migration is also guided by growth cones situated at the tip of leading processes as in neuritic elongation (Rakic et al., 1996). A similar pathology of MT disorganization could also exist in the growth cones of migrating neurons.
MT spacing in neuritic shafts
MAPs are known to form cross-bridge structures between MTs (Hirokawa, 1994). A previous study using Sf9 cells indicated that the difference in NH2-terminal projection domains between Tau and MAP2 could determine the length of cross-bridge structures between MTs; therefore, the different organizations of MT domains characterize axons and dendrites (Chen et al., 1992). However, there has been no in vivo evidence supporting the significance of MAPs in determining MT spacing. In this study, we present for the first time genetic data showing that the lack of MAPs results in altered MT spacing. Moreover, we investigated a possible change in fast transport due to the altered MT organization by visualizing transported vesicles in living cells. However, the vesicle transport was intact in map2 −/−map1b −/− mouse neurons. Taken together, we consider that the most influential factor that causes these morphological defects is the disorganization of growth cone MTs, which could lead to reduced growth cone motility, leading in turn to the abnormal shape of neurons.
Future directions
A large number of gene-targeting studies have revealed that neurons use their molecular machinery in a redundant manner. In the present study, we found novel aspects of MAP2 and MAP1B function by comparative analysis between double knockout mice and their corresponding single knockout mice. Such an approach will be useful in elucidating cooperative interactions of proteins in vivo.
Materials and methods
Maintenance of mice
Mice were maintained on a 12-h light/12-h dark schedule in a specific pathogen-free environment. Females and males were crossed in a timed mating schedule (from 11:00 to 14:00). Conception was ascertained by the presence of a vaginal plug. Plug check was conducted at 14:00. The day of conception was considered as E0. E19 was referred to as P0 regardless of the occurrence or nonoccurrence of birth. Mice were maintained by repeated backcrossing to C57BL/6J mice and analyzed in a C57BL/6J (84.4–98.1%)/129/Sv (15.6–1.9%) background. The genotype was determined by PCR analysis and confirmed by Southern blotting (Takei et al., 1997).
SDS-PAGE and immunoblot
Crude extracts from whole brains were prepared as described previously (Takei et al., 1997). After gel electrophoresis, proteins were transferred onto an Immobilon TM membrane (Millipore), and they were probed with 3d2 antibody for anti-MAP1B (Noble et al., 1989) and with HM-2 (Sigma-Aldrich) and AP-14, -18, -20, -21, -23, and -25 (Kalcheva et al., 1994) antibodies for anti-MAP2. Peroxidase-conjugated anti–mouse IgG antibody (Cappel Labs) was used as a secondary antibody. Chromogenic reaction was carried out using 4-chlorol-1-naphthol.
Histopathology
The brains of mice at P0 were dissected out and fixed with FEA overnight. The tissues were dehydrated in ethanol, embedded in Paraplast (Oxford Labware), sectioned serially at 12 Ìm thickness using Microm (HM355; Rotary Micotome) and stained by the Bodian method, a silver staining procedure for visualizing nerve fibers (Takei et al., 2000).
Whole-mount immunohistochemistry
Embryos were fixed with 4% paraformaldehyde in 0.1 M phosphate buffer (pH 7.3). Activities of endogenous peroxidases were quenched by 2% hydrogen peroxide in Dent's fixative (1 part DMSO, 4 parts 100% methanol). The neurofilament antibody 2H3 (Developmental Studies Hybridoma Bank) was used as the first antibody. As the secondary antibody, HRP-conjugated goat anti–rabbit IgG (Jackson ImmunoResearch Laboratories) was used. The secondary antibody was detected with 0.5% diaminobenzidine plus 0.02% hydrogen peroxide. In this experiment (Fig. 4), we regard map2 +/ map1b +/ as the control, map2 −/−map1b +/ as map2 single mutant, and map2 +/ map1b −/− as map1b single mutant mice to achieve efficient sample collection and compare the same developmental stage of embryos among littermates.
Neuronal birth-dating analysis
Experiments were performed as described previously (Takahashi et al., 1992). Pregnant mice at E12 and E14 were intraperitoneally given a single injection of BrdU (5-bromo-2′-deoxyuridine) (5 mg/ml in saline solution which contained 0.007 N sodium hydroxide; Sigma-Aldrich) at a dose of 50 Ìg/g body weight. At E18, the brains of embryos were examined. The sections were counterstained with Nuclear Fast red (Vector Laboratories).
For quantitative measurements of BrdU-labeled nuclei, comparable sections were chosen at the level of anterior commissure, which was divided into 10 horizontal bins from the superficial to the deep, and labeled nuclei in each bin were counted. In each genotype, at least three mice were examined.
Immunostaining of cryostat sections
Brains of embryos were dissected out and fixed with 2% paraformaldehyde in 0.1 M PBS (pH 7.4) for 2 h at room temperature. Cryostat coronal sections of cerebral walls (16 or 20 Ìm) were prepared using a cryomicrotome (CM3000; Leica) mounted on APS-coated microscope slides and air dried. As primary monoclonal antibodies, RC2 supernatant (Developmental Studies Hybridoma Bank), antichondroitin sulfate proteoglycan (CSPG) (clone CS56; Sigma-Aldrich), and anti-Reelin CR-50 antibodies (provided by Dr. Kazunori Nakajima, Jikei University) (Yoneshima et al., 1997) were used.
Hippocampal cell culture and immunofluorescence microscopy
Cultures of hippocampal neurons were prepared as described previously (Goslin and Banker, 1998). In this experiment (Fig. 6), we intercrossed map2 +/−map1b +/− and map2 −/−map1b +/− mice and compared neurons derived from map2 +/−map1b +/, map2 −/−map1b +/, map2 +/ map1b −/−, and map2 −/−map1b −/− littermate mice to collect samples efficiently. The cultures were photographed directly using an inverted phase–contrast microscope (Nikon) and observed with a conventional fluorescence microscope AX (Olympus) or a confocal laser scanning microscope (LSM510; ZEISS or MRC-1000; Bio-Rad Laboratories) after immunostaining. The lengths of axons and dendrites were measured in three independent experiments.
Immunocytochemistry was performed as described previously (Takei et al., 2000). A monoclonal antityrosine tubulin TUB-1A2 antibody (Sigma-Aldrich) and a polyclonal anti-GluR1 IgG (Chemicon) were used as the primary antibodies. For actin staining, FITC-conjugated phalloidin (Sigma-Aldrich) was used.
Rescue experiment on cultured hippocampal neurons
The full-length cDNA of rat MAP2C (Chen et al., 1992) was tagged with EGFP (CLONTECH Laboratories, Inc.) at the NH2 termini and ligated into pAdexCAw1 vector with CAG promoter to produce the recombinant adenovirus as described previously (Nakata et al., 1998). Cultured hippocampal neurons (prepared as described above except for the deletion of coculture with glia and supplementation with B27 supplement; GIBCO BRL) were infected by the adenovirus on the day of plating and observed after 3 d.
Electron microscopy
Mice and cultured hippocampal cells were fixed with 2% paraformaldehyde and 2.5% glutaraldehyde in 0.1 M sodium cacodylate buffer (pH 7.4). Brains were dissected out and sectioned using a microslicer. Matching areas of each tissue were chosen, fixed overnight, processed by the conventional method, and observed with a transmission electron microscope (JEOL-2000 EX or 2010 H). Distances between the nearest adjacent MTs in the axon and dendrites of each genotype were measured directly and counted, respectively, from prints. For each genotype, at least two independent mice were examined.
Time-lapse analysis of vesicle transport
The recombinant adenovirus expressing a GFP-tagged GAP-43 (Nakata et al., 1998) were infected into 17-d-old cultured hippocampal cells over a period of 20 min. The cells were examined 36 h after infection using the MRC1024 confocal laser scanning unit (Bio-Rad Laboratories) at room temperature. The axons were excited using a krypton-argon laser at 488 nm wavelength. Following the method previously described (Nakata et al., 1998), the axons were first bleached by continuous scanning for ∼1 min with 100% laser power at zoom 6.0 and then observed under 30 or 10% laser power at zoom 4.0. The speed of the vesicles was determined by measuring the distance the vesicles moved between two successive frames (5 s).
Acknowledgments
We thank Dr. Kazunori Nakajima (Jikei University) for providing the anti-Reelin antibody; N. Honma, H. Sato, N. Onouchi, M. Sugaya-Otsuka, and H. Fukuda (University of Tokyo) for their technical assistance; Y. Kanai, S. Terada, Y. Tanaka, Y. Okada, S. Takeda, M. Setou, and all members of the Hirokawa laboratory for their valuable discussions and suggestions.
This work has been supported by a Center of Excellence grant from the Ministry of Education, Culture, Sports, Science and Technology to N. Hirokawa.
Footnotes
*
Abbreviations used in this paper: CNS, central nervous system; E, embryonic day; MAP, microtubule-associated protein; MT, microtubule; P, postnatal day; PNS, peripheral nervous system.
References
- Bicknese, A.R., A.M. Sheppard, D.D. O'Leary, and A.L. Pearlman. 1994. Thalamocortical axons extend along a chondroitin sulfate proteoglycan-enriched pathway coincident with the neocortical subplate and distinct from the efferent path. J. Neurosci. 14:3500–3510. [DOI] [PMC free article] [PubMed] [Google Scholar]
- Boyne, L.J., K. Martin, S. Hockfield, and I. Fischer. 1995. Expression and distribution of phosphorylated MAP1B in growing axons of cultured hippocampal neurons. J. Neurosci. Res. 40:439–450. [DOI] [PubMed] [Google Scholar]
- Brugg, B., D. Reddy, and A. Matus. 1993. Attenuation of microtubule-associated protein 1B expression by antisense oligodeoxynucleotides inhibits initiation of neurite outgrowth. Neuroscience. 52:489–496. [DOI] [PubMed] [Google Scholar]
- Caceres, A., J. Mautino, and K.S. Kosik. 1992. Suppression of MAP2 in cultured cerebellar macroneurons inhibits minor neurite formation. Neuron. 9:607–618. [DOI] [PubMed] [Google Scholar]
- Chae, T., Y.T. Kwon, R. Bronson, P. Dikkes, E. Li, and L.H. Tsai. 1997. Mice lacking p35, a neuronal specific activator of Cdk5, display cortical lamination defects, seizures, and adult lethality. Neuron. 18:29–42. [DOI] [PubMed] [Google Scholar]
- Chen, J., Y. Kanai, N.J. Cowan, and N. Hirokawa. 1992. Projection domains of MAP2 and tau determine spacings between microtubules in dendrites and axons. Nature. 360:674–677. [DOI] [PubMed] [Google Scholar]
- Cunningham, C.C., N. Lecler, L.A. Flanagan, M. Lu, P.A. Janmey, and K.S. Kosik, 1997. Microtubule-associated protein 2c reorganizes both microtubules and microfilaments into distinct cytological structures in an actin-binding protein-280–deficient melanoma cell line. J. Cell Biol. 136:845–857. [DOI] [PMC free article] [PubMed] [Google Scholar]
- des Portes, V., F. Francis, J.-M. Pinard, I. Desguerre, M.-L. Moutard, I. Snoeck, L.C. Meiners, F. Capron, R. Cusmai, S. Ricci, et al. 1998. Doublecortin is the major gene causing X-linked subcortical laminar heterotopia (SCLH). Hum. Mol. Gen. 7:1063–1070. [DOI] [PubMed] [Google Scholar]
- Edelmann, W., M. Zervas, P. Costello, L. Roback, I. Fischer, J.A. Hammarback, N. Cowan, P. Davies, B. Wainer, and R. Kucherlapati. 1996. Neuronal abnormalities in microtubule-associated protein 1B mutant mice. Proc. Natl. Acad. Sci. USA. 93:1270–1275. [DOI] [PMC free article] [PubMed] [Google Scholar]
- Francis, F., A. Koulakoff, D. Boucher, P. Chafey, B. Schaar, M.-C. Vinet, G. Friocourt, N. McDonnell, O. Reiner, A. Kahn, et al. 1999. Doublecortin is a developmentally regulated, microtubule-associated protein expressed in migrating and differentiating neurons. Neuron. 23:247–256. [DOI] [PubMed] [Google Scholar]
- Garcia, M.L., and D.W. Cleveland. 2001. Going new places using an old MAP: tau, microtubules and human neurodegenerative disease. Curr. Opin. Cell Biol. 13:41–48. [DOI] [PubMed] [Google Scholar]
- Gleeson, J.G., K.M. Allen, J.W. Fox, E.D. Lamperti, S. Berkovic, I. Scheffer, E.C. Cooper, W.B. Dobyns, S.R. Minnerath, M.E. Ross, et al. 1998. Doublecortin, a brain-specific gene mutated in human X-linked lissencephaly and double cortex syndrome, encodes a putative signaling. Cell. 92:63–72. [DOI] [PubMed] [Google Scholar]
- Gleeson, J.G., P.T. Lin, L.A. Flanagan, and C.A. Walsh. 1999. Doublecortin is a microtubule-associated protein and is expressed widely by migrating neurons. Neuron. 23:257–271. [DOI] [PubMed] [Google Scholar]
- Goffinet, A.M. 1984. Events governing organization of postmigratory neurons: studies on brain development in normal and reeler mice. Brain Res. 319:261–296. [DOI] [PubMed] [Google Scholar]
- Gonzalez-Billault, C., E. Demandt, F. Wandosell, M. Torres, P. Bonaldo, A. Stoykova, K. Chowdhury, P. Gruss, J. Avila, and M.P. Sanchez. 2000. Perinatal lethality of microtubule-associated protein 1B-deficient mice expressing alternative isoforms of the protein at low levels. Mol. Cell Neurosci. 16:408–421. [DOI] [PubMed] [Google Scholar]
- Goslin, K., and G. Banker. 1998. Rat hippocampal neurons in low-density culture. In Culturing Nerve Cells, 2nd edition. G. Bander, and K. Goslin, editors. MIT Press, Cambridge, MA. 339–370.
- Halloran, M.C., and K. Kalil. 1994. Dynamic behaviors of growth cones extending in the corpus callosum of living cortical brain slices observed with video microscopy. J. Neurosci. 14:2161–2177. [DOI] [PMC free article] [PubMed] [Google Scholar]
- Harada, A., K. Oguchi, S. Okabe, J. Kuno, S. Terada, T. Ohshima, R. Sato-Yoshitake, Y. Takei, T. Noda, and N. Hirokawa. 1994. Altered microtubule organization in small-calibre axons of mice lacking tau protein. Nature. 369:488–491. [DOI] [PubMed] [Google Scholar]
- Hirokawa, N. 1991. Molecular architecture and dynamics of the neuronal cytoskeleton. In The Neuronal Cytoskeleton. R.D. Burgoyne, editor. Wiley Liss, New York. 5–74.
- Hirokawa, N. 1994. Microtubule organization and dynamics dependent on microtubule-associated proteins. Curr. Opin. Cell Biol. 6:74–81. [DOI] [PubMed] [Google Scholar]
- Hirotsune, S., M.W. Fleck, M.J. Gambello, G.J. Bix, A. Chen, G.D. Clark, D.H. Ledbetter, C.J. McBain, and A. Wynshaw-Boris. 1998. Graded reduction of Pafah1b1 (Lis1) activity results in neuronal migration defects and early embryonic lethality. Nat. Genet. 19:333–339. [DOI] [PubMed] [Google Scholar]
- Kalcheva, N., J.S. Albala, L.I. Binder, and B. Shafit-Zagardo. 1994. Localization of specific epitopes on human microtubule-associated protein 2. J. Neurochem. 63:2336–2341. [DOI] [PubMed] [Google Scholar]
- Kalcheva, N., J. Albala, K. O'Guin, H. Rubino, C. Garner, and B. Shafit-Zagardo. 1995. Genomic structure of human microtubule-associated protein 2 (MAP-2) and characterization of additional MAP-2 isoforms. Proc. Natl. Acad. Sci. USA. 92:10894–10898. [DOI] [PMC free article] [PubMed] [Google Scholar]
- Meixner, A., S. Haverkamp, H. Wassle, S. Fuhrer, J. Thalhammer, N. Kropf, R.E. Bittner, H. Lassmann, G. Wiche, and Propst. F. 2000. MAP1B is required for axon guidance and is involved in the development of the central and peripheral nervous system. J. Cell Biol. 151:1169–1178. [DOI] [PMC free article] [PubMed] [Google Scholar]
- Misson, J.P., M.A. Edwards, M. Yamamoto, and V.S. Caviness. 1988. Identification of radial glial cells within the developing murine central nervous system: studies based upon a new histochemical marker. Dev. Brain Res. 44:94–108. [DOI] [PubMed] [Google Scholar]
- Nakata, T., S. Terada, and N. Hirokawa. 1998. Visualization of the dynamics of synaptic vesicle and plasma membrane proteins in living axons. J. Cell Biol. 140:659–674. [DOI] [PMC free article] [PubMed] [Google Scholar]
- Noble, M., S.A. Lewis, and N.J. Cowan. 1989. The microtubule binding domain of microtubule-associated protein MAP1B contains a repeated sequence motif unrelated to that of MAP2 and tau. J. Cell Biol. 109:3367–3376. [DOI] [PMC free article] [PubMed] [Google Scholar]
- Ohshima, T., J.M. Ward, C.G. Huh, G. Longenecker, Veeranna, H.C. Pant, R.O. Brady, L.J. Martin, and A.B. Kulkarni. 1996. Targeted disruption of the cyclin-dependent kinase 5 gene results in abnormal corticogenesis, neuronal pathology and perinatal death. Proc. Natl. Acad. Sci. USA. 93:11173–11178. [DOI] [PMC free article] [PubMed] [Google Scholar]
- Paglini, G., G. Pigino, P. Kunda, G. Morfini, R. Maccioni, S. Quiroga, A. Ferreira, and A. Caceres. 1998. Evidence for the participation of the neuron-specific CDK5 activator P35 during laminin-enhanced axonal growth. J. Neurosci. 18:9858–9869. [DOI] [PMC free article] [PubMed] [Google Scholar]
- Rakic, P. 1988. Specification of cerebral cortical areas. Science. 241:170–176. [DOI] [PubMed] [Google Scholar]
- Rakic, P., E. Knyihar-Csillik, and B. Csillik. 1996. Polarity of microtubule assemblies during neuronal cell migration. Proc. Natl. Acad. Sci. USA. 93:9218–9222. [DOI] [PMC free article] [PubMed] [Google Scholar]
- Reiner, O., R. Carrozzo, Y. Shen, M. Wehnert, F. Faustinella, W.B. Dobyns, C.T. Caskey, and D.H. Ledbetter. 1993. Isolation of a Miller-Dieker lissencephaly gene containing G protein, beta-subunit-like repeats. Nature. 364:717–721. [DOI] [PubMed] [Google Scholar]
- Sanchez, C., J. Diaz-Nido, and J. Avila. 2000. Phosphorylation of microtubule-associated protein 2 (MAP2) and its relevance for the regulation of the neuronal cytoskeleton function. Prog. Neurobiol. 61:133–168. [DOI] [PubMed] [Google Scholar]
- Sapir, T., M. Elbaum, and O. Reiner. 1997. Reduction of microtubule catastrophe events by LIS1, platelet-activating factor acetylhydrolase subunit. EMBO J. 16:6977–6984. [DOI] [PMC free article] [PubMed] [Google Scholar]
- Sato-Yoshitake, R., Y. Shiomura, H. Miyasaka, and N. Hirokawa. 1989. Microtubule-associated protein 1B: molecular structure, localization, and phosphorylation-dependent expression in developing neurons. Neuron. 3:229–238. [DOI] [PubMed] [Google Scholar]
- Sharma, N., Y. Kress, and B. Shafit-Zagardo. 1994. Antisense MAP-2 oligonucleotides induce changes in microtubule assembly and neuritic elongation in pre-existing neurites of rat cortical neurons. Cell Motil. Cytoskeleton. 27:234–247. [DOI] [PubMed] [Google Scholar]
- Sheldon, M., D.S. Rice, G. D'Arcangelo, H. Yoneshima, K. Nakajima, K. Mikoshiba, B.W. Howell, J.A. Cooper, D. Goldowitz, and T. Curran. 1997. Scrambler and yotari disrupt the disabled gene and produce a _reeler_-like phenotype in mice. Nature. 389:730–733. [DOI] [PubMed] [Google Scholar]
- Skene, J.H. 1989. Axonal growth-associated proteins. Annu. Rev. Neurosci. 12:127–156. [DOI] [PubMed] [Google Scholar]
- Takahashi, T., R.S. Nowakowski, and V.S. Caviness, Jr. 1992. BUdR as an S-phase marker for quantitative studies of cytokinetic behaviour in the murine cerebral ventricular zone. J. Neurocytol. 21:185–197. [DOI] [PubMed] [Google Scholar]
- Takei, Y., S. Kondo, A. Harada, S. Inomata, T. Noda, and N. Hirokawa. 1997. Delayed development of nervous system in mice homozygous for disrupted microtubule-associated protein 1B (MAP1B) gene. J. Cell Biol. 137:1615–1626. [DOI] [PMC free article] [PubMed] [Google Scholar]
- Takei, Y., J. Teng, A. Harada, and N. Hirokawa. 2000. Defects in axonal elongation and neuronal migration in mice with disrupted tau and map1b genes. J. Cell Biol. 150:989–1000. [DOI] [PMC free article] [PubMed] [Google Scholar]
- Tanaka, E.M., and M.W. Kirschner. 1991. Microtubule behavior in the growth cones of living neurons during axon elongation. J. Cell Biol. 115:345–363. [DOI] [PMC free article] [PubMed] [Google Scholar]
- Tanaka, E.M., and J. Sabry. 1995. Making connection: cytoskeletal rearrangements during growth cone guidance. Cell. 83:171–176. [DOI] [PubMed] [Google Scholar]
- Tögel, M., G. Wiche, and F. Propst. 1998. Novel features of the light chain of microtubule-associated protein MAP1B: microtubule stabilization, self-interaction, actin filament binding, and regulation by heavy chain. J. Cell Biol. 143:695–707. [DOI] [PMC free article] [PubMed] [Google Scholar]
- Trommsdorff, M., M. Gotthardt, T. Hiesberger, J. Shelton, W. Stockinger, J. Nimpf, R.E. Hammer, J.A. Richardson, and J. Herz. 1999. Reeler/disabled-like disruption of neuronal migration in knockout mice lacking the VLDL receptor and ApoE receptor 2. Cell. 97:689–701. [DOI] [PubMed] [Google Scholar]
- Tsui, H.T., K.L. Lankford, H. Dis, and W.L. Klein. 1984. Novel organization of microtubules in cultured central nervous system neurons: formation of hairpin loops at ends of maturing neurites. J. Neurosci. 4:3002–3013. [DOI] [PMC free article] [PubMed] [Google Scholar]
- Tucker, R.P. 1990. The roles of microtubule-associated proteins in brain morphogenesis: a review. Brain Res. Brain Res. Rev. 15:101–120. [DOI] [PubMed] [Google Scholar]
- Ulloa, L., J. Diaz-Nido, and J. Avila. 1993. Depletion of casein kinase II by antisense oligonucleotide prevents neuritogenesis in neuroblastoma cells. EMBO J. 12:1633–1640. [DOI] [PMC free article] [PubMed] [Google Scholar]
- Yoneshima, H., E. Nagata, M. Matsumoto, M. Yamada, K. Nakajima, T. Miyata, M. Ogawa, and K. Mikoshiba. 1997. A novel neurological mutant mouse, yotari, which exhibits reeler-like phenotype but expresses CR-50 antigen/reelin. Neurosci. Res. 29:217–223. [DOI] [PubMed] [Google Scholar]
