Functional cartography of complex metabolic networks (original) (raw)
. Author manuscript; available in PMC: 2008 Jan 7.
Published in final edited form as: Nature. 2005 Feb 24;433(7028):895–900. doi: 10.1038/nature03288
Abstract
High-throughput techniques are leading to an explosive growth in the size of biological databases and creating the opportunity to revolutionize our understanding of life and disease. Interpretation of these data remains, however, a major scientific challenge. Here, we propose a methodology that enables us to extract and display information contained in complex networks1–3. Specifically, we demonstrate that we can find functional modules4,5 in complex networks, and classify nodes into universal roles according to their pattern of intra- and inter-module connections. The method thus yields a ‘cartographic representation’ of complex networks. Metabolic networks6–8 are among the most challenging biological networks and, arguably, the ones with most potential for immediate applicability9. We use our method to analyse the metabolic networks of twelve organisms from three different superkingdoms. We find that, typically, 80% of the nodes are only connected to other nodes within their respective modules, and that nodes with different roles are affected by different evolutionary constraints and pressures. Remarkably, we find that metabolites that participate in only a few reactions but that connect different modules are more conserved than hubs whose links are mostly within a single module.
If we are to extract the significant information from the topology of a large, complex network, knowledge of the role of each node is of crucial importance. A cartographic analogy is helpful to illustrate this point. Consider the network formed by all cities and towns in a country (the nodes) and all the roads that connect them (the links). It is clear that a map in which each city and town is represented by a circle of fixed size and each road is represented by a line of fixed width is hardly useful. Rather, real maps emphasize capitals and important communication lines so that we can obtain scale-specific information at a glance. Similarly, it is difficult, if not impossible, to obtain information from a network with hundreds or thousands of nodes and links, unless the information about nodes and links is conveniently summarized. This is particularly true for biological networks.
Here, we propose a methodology, which is based on the connectivity of the nodes, that yields a cartographic representation of a complex network. The first step in our method is to identify the functional modules4,5 in the network. In the cartographic picture, modules are analogous to countries or regions, and enable a coarse-grained, and thus simplified, description of the network. Then we classify the nodes in the network into a small number of system-independent ‘universal roles’.
It is common that social networks have communities of highly interconnected nodes that are less connected to nodes in other communities. Such modular structures have been reported not only in social networks5,10–12, but also in food webs13 and biochemical networks4,14–16. It is widely believed that the modular structure of complex networks plays a critical role in their functionality4,14,16. There is therefore a clear need to develop algorithms to identify modules accurately5,11,17–20.
We identify modules by maximizing the network's modularity11,18,21 using simulated annealing22 (see Methods). Simulated annealing enables us to perform an exhaustive search and to minimize the problem of finding sub-optimal partitions. It is noteworthy that, in our method, we do not need to specify a priori the number of modules; rather, this number is an outcome of the algorithm. Our algorithm is able to reliably identify modules in a network whose nodes have as many as 50% of their connections outside their own module (Fig. 1).
Figure 1.

Performance of module identification methods. To test the performance of the method, we build ‘random networks’ with known module structure. Each test network comprises 128 nodes divided into 4 modules of 32 nodes. Each node is connected to the other nodes in its module with probability pi, and to nodes in other modules with probability po < pi. On average, thus, each node is connected to _k_out = 96 po nodes in other modules and to _k_in = 31 pi in the same module. Additionally, pi and po are selected so that the average degree of the nodes is k = 16. We display networks with: a, _k_in = 15 and _k_out = 1; b, _k_in = 11 and _k_out = 5; and c, _k_in = _k_out = 8. d, The performance of a module identification algorithm is typically defined as the fraction of correctly classified nodes. We compare our algorithm to the Girvan–Newman algorithm5,18, which is the reference algorithm for module identification11,18,19. Note that our method is 90% accurate even when half of a node's links are to nodes in outside modules. e, Our module-identification algorithm is stochastic, so different runs yield, in principle, different partitions. To test the robustness of the algorithm, we obtain 100 partitions of the network depicted in c and plot, for each pair of nodes in the network, the fraction of times that they are classified in the same module. As shown in the figure, most pairs of nodes are either always classified in the same module (red) or never classified in the same module (dark blue), which indicates that the solution is robust.
When considering modular networks, it is plausible to surmise that the nodes in a network are connected according to the role they fulfil. This fact has been long recognized in the analysis of social networks23. For example, in a classical hierarchical organization, the chief executive is not directly connected to plant employees but is connected to the members of the board of directors. Such a statement holds for virtually any organization; that is, the role of chief executive is defined irrespective of the particular organization considered.
We propose a new method to determine the role of a node in a complex network. Our approach is based on the idea that nodes with the same role should have similar topological properties24 (see Supplementary Information for a discussion on how our approach relates to previous work). We predict that the role of a node can be determined, to a great extent, by its within-module degree and its participation coefficient, which define how the node is positioned in its own module and with respect to other modules25,26 (see Methods). These two properties are easily computed once the modules of a network are known.
The within-module degree zi measures how ‘well-connected’ node i is to other nodes in the module. High values of zi indicate high within-module degrees and vice versa. The participation coefficient Pi measures how ‘well-distributed’ the links of node i are among different modules. The participation coefficient Pi is close to 1 if its links are uniformly distributed among all the modules, and 0 if all its links are within its own module.
We define heuristically seven different universal roles, each defined by a different region in the z–P parameter space (Fig. 2). According to the within-module degree, we classify nodes with z ≥ 2.5 as module hubs and nodes with z < 2.5 as non-hubs. Both hub and non-hub nodes are then more finely characterized by using the values of the participation coefficient (see Supplementary Information for a detailed justification of this classification scheme, and for a discussion on possible alternatives).
Figure 2.
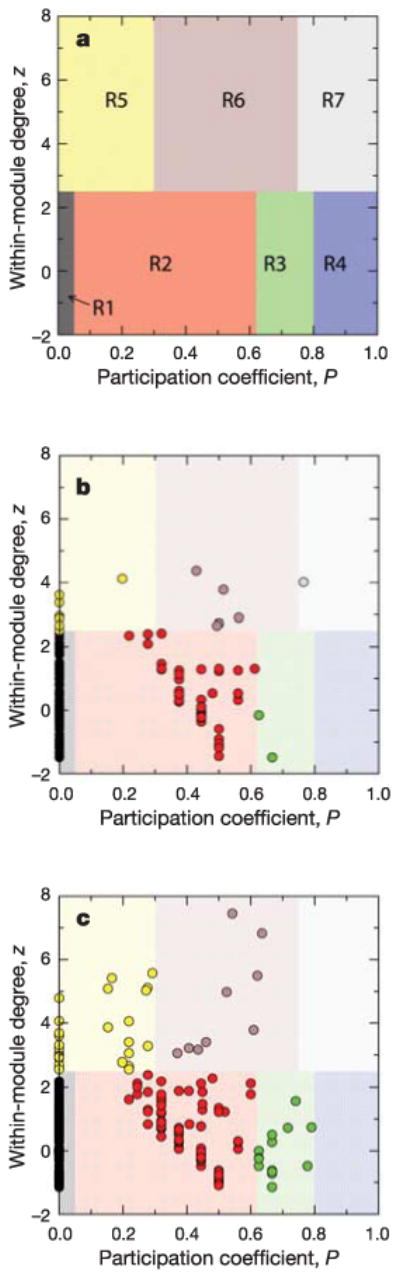
Roles and regions in the z_–_P parameter space. a, Each node in a network can be characterized by its within-module degree and its participation coefficient (see Methods for definitions). We classify nodes with z ≥ 2.5 as module hubs and nodes with z < 2.5 as non-hubs. We find that non-hub nodes can be naturally assigned into four different roles: (R1) ultra-peripheral nodes; (R2) peripheral nodes; (R3) non-hub connector nodes; and (R4) non-hub kinless nodes. We find that hub nodes can be naturally assigned into three different roles: (R5) provincial hubs; (R6) connector hubs; and (R7) kinless hubs (see text and Supplementary Information for details). b, Metabolite role determination for the metabolic network of E. coli, as obtained from the MZ database. Each metabolite is represented as a point in the z_–_P parameter space, and is coloured according to its role. c, Same as b but for the complete KEGG database.
We find that non-hub nodes can be naturally divided into four different roles: (R1) ultra-peripheral nodes; that is, nodes with all their links within their module (P ≤ 0.05); (R2) peripheral nodes; that is, nodes with most links within their module (0.05 < _P_ ≤ 0.62); (R3) non-hub connector nodes; that is, nodes with many links to other modules (0.62 < _P_ ≤ 0.80); and (R4) non-hub kinless nodes; that is, nodes with links homogeneously distributed among all modules (_P_ > 0.80). We find that hub nodes can be naturally divided into three different roles: (R5) provincial hubs; that is, hub nodes with the vast majority of links within their module (P ≤ 0.30); (R6) connector hubs; that is, hubs with many links to most of the other modules (0.30 < _P_ ≤ 0.75); and (R7) kinless hubs; that is, hubs with links homogeneously distributed among all modules (_P_ > 0.75).
To test the applicability of our approach to complex biological networks, we consider the cartographic representation of the metabolic networks6–9,14 of twelve organisms: four bacteria (Escherichia coli, Bacillus subtilis, Lactococcus lactis and Thermasynechococcus elongatus), four eukaryotes (Saccharomyces cerevisiae, Caenorhabditis elegans, Plasmodium falciparum and Homo sapiens), and four archaea (Pyrococcus furiosus, Aeropyrum pernix, Archaeoglobus fulgidus and Sulfolobus solfataricus). In metabolic networks, nodes represent metabolites and two nodes i and j are connected by a link if there is a chemical reaction in which i is a substrate and j a product, or vice versa. In our analysis, we use the database developed by Ma and Zeng8 (MZ) from the Kyoto Encyclopedia of Genes and Genomes27 (KEGG). The results we report are not altered if we consider the complete KEGG database instead (Figs 2c and 4b, and Supplementary Information).
Figure 4.

Roles of metabolites and inter-species conservation. To quantify the relation between roles and conservation, we calculate the loss rate _p_lost(R) of each metabolite (see Methods). Each thin line in the graph corresponds to a comparison between two species. Because we are interested in metabolites that are present in some species but missing in others, metabolic networks of species within the same superkingdom—bacteria, eukaryotes and archaea—are usually too similar to provide statistically sound information, especially for roles containing only a few metabolites. Therefore, we consider in our analysis only pairs of species that belong to different superkingdoms. The thick line is the average over all pairs of species. The loss rate _p_lost(R) is maximum for ultra-peripheral (R1) nodes and minimum for connector hubs (R6). Provincial hubs (R5) have a significantly and consistently higher _p_lost(R) than non-hub connectors (R3), even though the within-module degree and the total degree of provincial hubs is larger. Note that, out of the total 48 pair comparisons, only in two cases is _p_lost(R) lower for provincial hubs than for non-hub connectors, whereas the opposite is true in 44 cases. a, b, Results obtained for the MZ database (a) and the complete KEGG database (b).
First, we identify the functional modules in the different metabolic networks (Fig. 3). Finding modules in metabolic networks purely on the basis of topological properties is an extremely important task. For example, Schuster et al. have reported on the impossibility of obtaining elementary flux modes28 from complete metabolic networks due to the combinatorial explosion of the number of such modes29. Our algorithm identifies an average of 15 different modules in each metabolic network—with a maximum of 19 for E. coli and H. sapiens, and a minimum of 11 for A. fulgidus. As expected, the density of links within each of the modules is significantly larger than between modules—typically 100–1,000 times larger (see Supplementary Information).
Figure 3.

Cartographic representation of the metabolic network of E. coli. Each circle represents a module and is coloured according to the KEGG pathway classification of the metabolites it contains. Certain important nodes are depicted as triangles (non-hub connectors), hexagons (connector hubs) and squares (provincial hubs). Interactions between modules and nodes are depicted using lines, with thickness proportional to the number of actual links. Inset: metabolic network of E. coli, which contains 473 metabolites and 574 links. This representation was obtained using the program Pajek. Each node is coloured according to the ‘main’ colour of its module, as obtained from the cartographic representation.
To assess how each of the modules is related to the pathways traditionally defined in biology, we use the classification scheme proposed in KEGG, which includes nine major pathways: carbohydrate metabolism, energy metabolism, lipid metabolism, nucleotide metabolism, amino-acid metabolism, glycan biosynthesis and metabolism, metabolism of cofactors and vitamins, biosynthesis of secondary metabolites and biodegradation of xenobiotics. Each metabolite in the KEGG database is assigned to at least one pathway; thus, we can determine to which pathways the metabolites in a given module belong. We find that most modules contain metabolites mostly from one major pathway. For example, in 17 of the 19 modules identified for E. coli, more than one-third of the metabolites belong to a single pathway. Interestingly, some other modules—two in the case of _E. coli_—cannot be trivially associated with a single traditional pathway. These modules are typically central in the metabolism and contain, mostly, metabolites that are classified in KEGG as belonging to carbohydrate and amino-acid metabolism.
Next we identify the role of each metabolite. In Fig. 2b we show the roles identified in the metabolic network of E. coli. Other organisms show a similar distribution of the nodes in the different roles, even though they correspond to organisms that are very distant from an evolutionary standpoint (see Supplementary Information). Role R1, which contains ultra-peripheral metabolites with small degree and no between-module links, comprises 76–86% of all the metabolites in the networks. This considerably simplifies the coarse-grained representation of the network as these nodes do not need to be identified separately. Note that this finding alone represents an important step towards the goal of extracting scale-specific information from complex networks.
The information about modules and roles enables us to build a cartographic representation of the metabolic network of, for example, E. coli (Fig. 3). This representation enables us to recover relevant biological information. For instance, we find that the metabolism is mostly organized around the module containing pyruvate, which in turn is strongly connected to the module whose hub is acetyl-coenzyme A (CoA). These two molecules are key to connecting the metabolism of carbohydrates, amino acids and lipids to the tricarboxylic acid (TCA) cycle from which ATP is obtained. These two modules are connected to more peripheral ones by key metabolites such as d-glyceraldehyde 3-phosphate and d-fructose 6-phosphate (which connect to the glucose and galactose metabolisms), d-ribose 5-phosphate (which connects to the metabolism of certain nucleotides), and glycerone phosphate (which connects to the metabolism of certain lipids).
Our analysis also uncovers nodes with key connector roles that take part in only a small but fundamental set of reactions. For example, _N_-carbamoyl-l-aspartate takes part in only three reactions but is vital because it connects the pyrimidine metabolism, whose hub is uracil, to the core of the metabolism through the alanine and aspartate metabolism. The potential importance of such non-hub connectors points to another consideration. It is a plausible hypothesis that nodes with different roles are under different evolutionary constraints and pressures. In particular, we expect that nodes with structurally relevant roles are more necessary and therefore more conserved across species.
To quantify the relation between roles and conservation, we define the loss rate _p_lost(R) (see Methods). Structurally relevant roles are expected to have low values of _p_lost(R) and vice versa. We find that the different roles have different loss rates (Fig. 4). As expected, ultra-peripheral nodes (role R1) have the highest loss rate whereas connector hubs (role R6) are the most conserved across all species considered.
The results for the comparison of _p_lost(R) for ultra-peripheral nodes and connector hubs is illustrative, but hardly surprising. The comparison of _p_lost(R) for non-hub connectors (role R3) and provincial hubs (role R5), however, yields a surprising finding. The metabolites in the provincial hubs class have many within-module connections, sometimes as many as five standard deviations more connections than the average node in the module. Conversely, non-hub connector metabolites have few links relative to other nodes in their modules—and fewer total connections than the metabolites in role R5 (see Supplementary Fig. S12b, c). The links of non-hub connectors, however, are distributed among several different modules, whereas the links of provincial hubs are mainly within their modules. We find that non-hub connectors are systematically and significantly more conserved than provincial hub metabolites (Fig. 4).
A possible explanation for the high degree of conservation of non-hub connectors is as follows. Connector nodes are responsible for inter-module fluxes. These modules are otherwise poorly connected or not connected at all to each other, so the elimination of connector metabolites will probably have a large impact on the global structure of fluxes in the network. On the contrary, the pathways in which provincial hubs are involved may be backed up within the module in such a way that elimination of these metabolites may have a comparatively smaller impact, which in addition would probably be confined to the module containing the provincial hub.
Our results therefore point to the need to consider each complex biological network as a whole, instead of focusing on local properties. In protein networks, for example, it has been reported that hubs are more essential than non-hubs30. Notwithstanding the relevance of such a finding, our results suggest that the global role of nodes in the network might be a better indicator of their importance than degree26.
Our ‘cartography’ provides a scale-specific method to process the information contained in the structure of complex networks, and to extract knowledge about the function performed by the network and its constituents. An open question is how to adapt current module-detection algorithms to networks with a hierarchical structure.
For metabolic networks—a comparatively well studied and well understood case—our method allows us to recover firmly established biological facts, and to uncover important new results, such as the significant conservation of non-hub connector metabolites. Similar results can be expected when our method is applied to other complex networks that are not as well studied as metabolic networks. Among those, protein interaction and gene regulation networks may be the most significant.
Methods
Modularity
For a given partition of the nodes of a network into modules, the modularity M of this partition is11,18,21:
| M≡∑s=1NM [lsL−(ds2L)2] | (1) |
|---|
where NM is the number of modules, L is the number of links in the network, ls is the number of links between nodes in module s, and ds is the sum of the degrees of the nodes in module s. The rationale for this definition of modularity is the following. A good partition of a network into modules must comprise many within-module links and as few as possible between-module links. However, if we just try to minimize the number of between-module links (or, equivalently, maximize the number of within-module links) the optimal partition consists of a single module and no between-module links. Equation (1) addresses this difficulty by imposing that M = 0 if nodes are placed at random into modules or if all nodes are in the same cluster11,18,21.
The objective of a module identification algorithm is to find the partition with largest modularity, and several methods have been proposed to attain such a goal. Most of them rely on heuristic procedures and use M, or a similar measure, only to assess their performance. In contrast, we use simulated annealing22 to find the partition with the largest modularity.
Simulated annealing for module identification
Simulated annealing22 is a stochastic optimization technique that enables you to find ‘low-cost’ configuration without getting trapped in ‘high-cost’ local minima. This is achieved by introducing a computational temperature T. When T is high, the system can explore configurations of high cost whereas at low T the system only explores low-cost regions. By starting at high T and slowly decreasing T, the system descends gradually towards deep minima, eventually overcoming small cost barriers.
When identifying modules, the objective is to maximize the modularity, and thus the cost is C = −M, where M is the modularity as defined in equation (1). At each temperature, we perform a number of random updates and accept them with probability:
| p={1if Cf≤Ciexp (−Cf−CiT)if Cf>Ci | (2) |
|---|
where Cf is the cost after the update and Ci is the cost before the update.
Specifically, at each T we propose ni = _fS_2 individual node movements from one module to another, where S is the number of nodes in the network. We also propose nc = fS collective movements, which involve either merging two modules or splitting a module. For f we typically choose f = 1. After the movements are evaluated at a certain T, the system is cooled down to _T_′ = cT, with c = 0.995.
Within-module degree and participation coefficient
Each module can be organized in very different ways, ranging from totally centralized—with one or a few nodes connected to all the others—to totally decentralized, with all nodes having similar connectivities. Nodes with similar roles are expected to have similar relative within-module connectivity. If ki is the number of links of node i to other nodes in its module si, k̄si is the average of k over all the nodes in si, and σksi is the standard deviation of k in si, then:
is the so-called _z_-score. The within-module degree _z_-score measures how well-connected node i is to other nodes in the module.
Different roles can also arise because of the connections of a node to modules other than its own. For example, two nodes with the same _z_-score will play different roles if one of them is connected to several nodes in other modules while the other is not. We define the participation coefficient Pi of node i as:
where kis is the number of links of node i to nodes in module s, and ki is the total degree of node i. The participation coefficient of a node is therefore close to 1 if its links are uniformly distributed among all the modules and 0 if all its links are within its own module.
Loss rate
To quantify the relation between roles and conservation, we calculate to what extent metabolites are conserved in the different species depending on the role they play. Specifically, for a pair of species, A and B, we define the loss rate as the probability p(RA = 0|RB = R) ≡ _p_lost(R) that a metabolite is not present in one of the species (RA = 0) given that it plays role R in the other species (RB = R). Structurally relevant roles are expected to have low values of _p_lost(R) and vice versa.
Supplementary Material
Supplementary Information accompanies the paper on www.nature.com/nature.
STable2module
STable2role
Supp Discussio
Supp Table 1
Supp Table 3
Acknowledgments
We thank L. Broadbelt, V. Hatzimanikatis, A. A. Moreira, E. T. Papoutsakis, M. Sales-Pardo and D. B. Stouffer for discussions and suggestions, and H. Ma and A. P. Zeng for providing us with their metabolic networks' database. R.G. thanks the Fulbright Program and the Spanish Ministry of Education, Culture & Sports. L.A.N.A. acknowledges the support of a Searle Leadership Fund Award and of a NIH/NIGMS K-25 award.
Footnotes
Competing interests statement The authors declare that they have no competing financial interests.
References
- 1.Amaral LAN, Scala A, Barthelémy M, Stanley HE. Classes of small-world networks. Proc Natl Acad Sci USA. 2000;97:11149–11152. doi: 10.1073/pnas.200327197. [DOI] [PMC free article] [PubMed] [Google Scholar]
- 2.Albert R, Barabási AL. Statistical mechanics of complex networks. Rev Mod Phys. 2002;74:47–97. [Google Scholar]
- 3.Amaral LAN, Ottino J. Complex networks: Augmenting the framework for the study of complex systems. Eur Phys J B. 2004;38:147–162. [Google Scholar]
- 4.Hartwell LH, Hopfield JJ, Leibler S, Murray AW. From molecular to modular biology. Nature. 1999;402(Suppl):C47–C52. doi: 10.1038/35011540. [DOI] [PubMed] [Google Scholar]
- 5.Girvan M, Newman MEJ. Community structure in social and biological networks. Proc Natl Acad Sci USA. 2002;99:7821–7826. doi: 10.1073/pnas.122653799. [DOI] [PMC free article] [PubMed] [Google Scholar]
- 6.Jeong H, Tombor B, Albert R, Oltvai ZN, Barabási AL. The large-scale organization of metabolic networks. Nature. 2000;407:651–654. doi: 10.1038/35036627. [DOI] [PubMed] [Google Scholar]
- 7.Wagner A, Fell DA. The small world inside large metabolic networks. Proc R Soc Lond B. 2001;268:1803–1810. doi: 10.1098/rspb.2001.1711. [DOI] [PMC free article] [PubMed] [Google Scholar]
- 8.Ma H, Zeng AP. Reconstruction of metabolic networks from genome data and analysis of their global structure for various organisms. Bioinformatics. 2003;19:270–277. doi: 10.1093/bioinformatics/19.2.270. [DOI] [PubMed] [Google Scholar]
- 9.Hatzimanikatis V, Li C, Ionita JA, Broadbelt L. Metabolic networks: enzyme function and metabolite structure. Curr Opin Struct Biol. 2004;14:300–306. doi: 10.1016/j.sbi.2004.04.004. [DOI] [PubMed] [Google Scholar]
- 10.Guimerà R, Danon L, Díaz-Guilera A, Giralt F, Arenas A. Self-similar community structure in a network of human interactions. Phys Rev E. 2003;68(no 065103) doi: 10.1103/PhysRevE.68.065103. [DOI] [PubMed] [Google Scholar]
- 11.Newman MEJ, Girvan M. Finding and evaluating community structure in networks. Phys Rev E. 2004;69(no 026113) doi: 10.1103/PhysRevE.69.026113. [DOI] [PubMed] [Google Scholar]
- 12.Arenas A, Danon L, Díaz-Guilera A, Gleiser PM, Guimerà R. Community analysis in social networks. Eur Phys J B. 2004;38:373–380. [Google Scholar]
- 13.Krause AE, Frank KA, Mason DM, Ulanowicz RE, Taylor WW. Compartments revealed in food-web structure. Nature. 2003;426:282–285. doi: 10.1038/nature02115. [DOI] [PubMed] [Google Scholar]
- 14.Ravasz E, Somera AL, Mongru DA, Oltvai ZN, Barabási AL. Hierarchical organization of modularity in metabolic networks. Science. 2002;297:1551–1555. doi: 10.1126/science.1073374. [DOI] [PubMed] [Google Scholar]
- 15.Holme P, Huss M. Subnetwork hierarchies of biochemical pathways. Bioinformatics. 2003;19:532–538. doi: 10.1093/bioinformatics/btg033. [DOI] [PubMed] [Google Scholar]
- 16.Papin JA, Reed JL, Palsson BO. Hierarchical thinking in network biology: the unbiased modularization of biochemical networks. Trends Biochem Sci. 2004;29:641–647. doi: 10.1016/j.tibs.2004.10.001. [DOI] [PubMed] [Google Scholar]
- 17.Eriksen KA, Simonsen I, Maslov S, Sneppen K. Modularity and extreme edges of the Internet. Phys Rev Lett. 2003;90(no 148701) doi: 10.1103/PhysRevLett.90.148701. [DOI] [PubMed] [Google Scholar]
- 18.Newman MEJ. Fast algorithm for detecting community structure in networks. Phys Rev E. 2004;69(no 066133) doi: 10.1103/PhysRevE.69.066133. [DOI] [PubMed] [Google Scholar]
- 19.Radicchi F, Castellano C, Cecconi F, Loreto V, Parisi D. Defining and identifying communities in networks. Proc Natl Acad Sci USA. 2004;101:2658–2663. doi: 10.1073/pnas.0400054101. [DOI] [PMC free article] [PubMed] [Google Scholar]
- 20.Donetti L, Muñoz MA. Detecting network communities: A new systematic and efficient algorithm. J Stat Mech Theor Exp. 2004 P10012. [Google Scholar]
- 21.Guimerà R, Sales-Pardo M, Amaral LAN. Modularity from fluctuations in random graphs and complex networks. Phys Rev E. 2004;70(no 025101) doi: 10.1103/PhysRevE.70.025101. [DOI] [PMC free article] [PubMed] [Google Scholar]
- 22.Kirkpatrick S, Gelatt CD, Vecchi MP. Optimization by simulated annealing. Science. 1983;220:671–680. doi: 10.1126/science.220.4598.671. [DOI] [PubMed] [Google Scholar]
- 23.Wasserman S, Faust K. Social Network Analysis. 4. Ch. 12. Cambridge Univ. Press; Cambridge: 1994. [Google Scholar]
- 24.Guimerà R, Amaral LAN. Cartography of complex networks: Modules and universal roles. J Stat Mech Theor Exp. 2005 doi: 10.1088/1742-5468/2005/02/P02001. P02001. [DOI] [PMC free article] [PubMed] [Google Scholar]
- 25.Rives AW, Galitski T. Modular organization of cellular networks. Proc Natl Acad Sci USA. 2003;100:1128–1133. doi: 10.1073/pnas.0237338100. [DOI] [PMC free article] [PubMed] [Google Scholar]
- 26.Han JDJ, et al. Evidence for dynamically organized modularity in the yeast protein–protein interaction network. Nature. 2004;430:88–93. doi: 10.1038/nature02555. [DOI] [PubMed] [Google Scholar]
- 27.Kanehisa M, Goto S. KEGG: Kyoto Encyclopedia of Genes and Genomes. Nucleic Acids Res. 2000;28:27–30. doi: 10.1093/nar/28.1.27. [DOI] [PMC free article] [PubMed] [Google Scholar]
- 28.Schuster S, Fell DA, Dandekar T. A general definition of metabolic pathways useful for systematic organization and analysis of complex metabolic networks. Nature Biotechnol. 2000;18:326–332. doi: 10.1038/73786. [DOI] [PubMed] [Google Scholar]
- 29.Schuster S, Pfeiffer T, Moldenhauer F, Koch I, Dandekar T. Exploring the pathway structure of metabolism: decomposition into subnetworks and application to Microplasma pneumoniae. Bioinformatics. 2002;18:351–361. doi: 10.1093/bioinformatics/18.2.351. [DOI] [PubMed] [Google Scholar]
- 30.Jeong H, Mason SP, Barabási AL, Oltvai ZN. Lethality and centrality in protein networks. Nature. 2001;411:41–42. doi: 10.1038/35075138. [DOI] [PubMed] [Google Scholar]
Associated Data
This section collects any data citations, data availability statements, or supplementary materials included in this article.
Supplementary Materials
STable2module
STable2role
Supp Discussio
Supp Table 1
Supp Table 3