Aberrant High Expression of B Lymphocyte Chemokine (Blc/Cxcl13) by C11b+Cd11c+ Dendritic Cells in Murine Lupus and Preferential Chemotaxis of B1 Cells towards Blc (original) (raw)
Abstract
We observed here that the expression of B lymphocyte chemokine (BLC/CXCL13) was markedly enhanced in the thymus and kidney in aged (NZB × NZW)F1 (BWF1) mice developing lupus nephritis, but not in similarly aged NZB and NZW mice. BLC-positive cells were present in the cellular infiltrates in the target organs with a reticular pattern of staining. CD11b+CD11c+ dendritic cells were increased in the thymus and spleen in aged BWF1 mice and identified as the major cell source for BLC. CD4+ T cells as well as B cells were dramatically increased in the thymus in aged BWF1 mice, whereas no increase was observed in aged NZB and NZW mice. B1/B2 ratio in the thymus was significantly higher than those in the spleen and peripheral blood in aged BWF1 mice. Interestingly, BLC showed preferential chemotactic activity for B1 cells derived from several mouse strains, including nonautoimmune mice. Cell surface CXCR5 expression on B1 cells was significantly higher than that on B2 cells. Thus, aberrant high expression of BLC by myeloid dendritic cells in the target organs in aged BWF1 mice may play a pivotal role in breaking immune tolerance in the thymus and in recruiting autoantibody-producing B cells in the development of murine lupus.
Keywords: chemokine, lupus, dendritic cells, B1 cells, T cells
Introduction
It is generally believed that autoimmune diseases result from breakdown in immunological tolerance 1. (NZB × NZW)F1 (BWF1) mice spontaneously develop systemic autoimmune disorders resembling SLE in humans 2 3. It is characterized by production of a variety of IgG autoantibodies and massive deposition of immune complexes in glomeruli in the kidney. More than 95% of these mice die from renal failure before 12 mo of age. A marked mononuclear cell infiltration in the target organs including the kidney and lung is another characteristic in aged BWF1 mice. The mechanism and pathophysiological significance for mononuclear cell infiltration in the target organs in the development of SLE, however, remain largely unknown.
Recent advances in molecular and biological analysis on chemokine/chemokine receptors have revealed pivotal roles of these proteins in inflammatory cellular infiltration 4. Chemokines and their receptors also play a pivotal role in linking innate immunity with acquired immunity through regulating dendritic cell (DC) trafficking 5 6 7 8. It is now widely accepted that dysregulation of Th1/Th2 balance is a general feature of autoimmune diseases in the onset, progression, and prognosis 9 10.
On the other hand, B1 cells which have different origin and function from conventional B cells (B2 cells) have long been considered to be involved in autoantibody production in autoimmune diseases 11 12 13. They produce IgM natural Abs in serum and contribute to IgA-producing plasma cells in the lamina propria in the gut 14. Involvement of B1 cells in IgM-mediated autoimmune diseases such as autoimmune hemolytic anemia was also demonstrated 15 16. However, it remains to be elucidated whether Ig class switching from IgM to IgG occurs in B1 cells in the development of autoimmune diseases. There is accumulating evidence suggesting that B cell receptor (BCR)-mediated signaling by autoantigens is essential for induction of B1 cell phenotype and that B1 cells can be induced from adult precursors by appropriate Ag 17.
We hypothesized that aberrant chemokine expression could be a cause for activation of autoreactive T and B cells through abnormal cell trafficking and localization in the absence of any defect in the machinery for immunological tolerance. We examined the chemokine expression in the lesions of lupus mice and found that the expression of B lymphocyte chemokine (BLC) was markedly enhanced in aged BWF1 mice. Our findings would provide a novel understanding of SLE as a chemokine disorder where aberrant high expression of BLC by DCs and preferential chemotaxis of B1 cells towards BLC may play a pivotal role in the development of murine lupus.
Materials and Methods
Mice.
BWF1 mice, originally obtained from the Shizuoka Laboratory Animal Center (Shizuoka, Japan), were maintained in our animal facility at The University of Tokyo. Female mice aged 2 mo were used as young mice, while 8–12-mo-old mice with moderate to severe proteinuria were used as aged mice.
Abs.
Rat mAbs specific for mouse CD4 (GK1.5), CD8 (53-7.6), CD35 (8C12), CD11b (M1/70), CD11c (HL-3), B220/CD45R (RA3-6B2), CD5 (53-7.3RRH), F4/80 (CI:A3-1), and MHC class II (ER-TR3) were purchased from BD PharMingen. Goat anti-BLC pAb was purchased from Genzyme. Follicular DC (FDC)-M1, FDC-specific mAb, was a gift from Dr. K. Maeda (Yamagata University School of Medicine, Yamagata, Japan). mAb for anti-CXCR5 mAb (2G8) was produced as described previously 18.
Reverse Transcription PCR Analysis on Chemokine Expression.
Total cellular RNA was isolated from lymphoid cells or various organs using RNeasy (QIAGEN) according to the manufacturer's instructions. In some experiments, cells purified by flow cytometer (FCM) sorting or MACS® magnetic beads (Miltenyi Biotec) were used for RNA preparation. It was then reverse transcribed into cDNA using Superscript II preamplification kit (Life Technologies) and amplified with specific oligonucleotide primers (BLC, sense 5′-TCTCTCCAGGCCACGGTATTCT-3′, antisense, 5′-ACCATTTGGCACGAGGATTCAC-3′; glyceraldehyde-3-phosphate dehydrogenase [G3PDH], sense 5′-AGTATGACTCCACTAACGGCAA-3′, antisense, 5′-TCTCGCTC- CTGGAAGATGGT-3′). PCR was performed by a thermal cycler for 35 cycles of 94°C for 45 s, 55°C for 60 s, and 72°C for 90 s, and final extension was done at 72°C for 10 min. BLC amplicon was detected as a 300-bp product on 2.5% agarose gels. Real-time quantitative PCR analysis was performed by using ABI 7700 sequence detector system (PE Biosystems). FAM (6-carboxyfluorescein)-labeled primers were used as target hybridization probes for BLC and glyceraldehyde 3-phosphate dehydrogenase (GAPDH) (BLC, 5′-CATCATAGTTCGGATTCAAGTTACGCCCCC-3′; GAPDH, 5′-AAGGGACACAGTCAAGGCCGAGAAT-3′). The thermal cycling conditions included 50°C for 2 min and 95°C for 10 min, followed by 50 cycles of amplification at 95°C for 15 s and 55°C for 1.5 min for denaturing and annealing, respectively. PCR reactions were run in triplicate. BLC quantity in aged mice was normalized by the level of GAPDH and compared with that in young mice. BLC quantity in purified cell population obtained from the same lymphoid organs was expressed relative to normalized BLC quantity in whole splenic or thymic cells.
Histological and Immunohistochemical Examination.
Cryostat sections (3-μm thick) of kidney and the thymus were stained with goat anti-BLC pAb, followed by biotinylated rabbit anti–goat IgG (Dako) and horseradish peroxidase (HRP)-labeled streptavidin (Dako). To decrease nonspecific staining, avidin/biotin blocking solution (Vector Laboratories) and normal rabbit IgG was used between each step. HRP-labeled goat anti–rat Ab (Biosource International) was used for staining of CD4, CD8, CD11b, CD35, B220, F4/80, MHC class II, and FDC-M1. HRP-labeled streptavidin (Dako) was used as a second reagent for staining with biotin-labeled anti-CD11c mAb.
Flow Cytometric Analysis.
Aliquots of 106 spleen cells were incubated with PE-labeled anti-B220 and FITC-conjugated anti-CD5 mAbs. For four color staining, thymocytes were stained with FITC-conjugated mAb, PE-conjugated mAb, and biotinylated mAb, followed by Alexa-594–labeled mAb and allophycocyanin (APC)-conjugated streptavidin. For staining for CXCR5 molecules on B1 or B2 cells, a mixture of spleen and peritoneal cells was stained with 2G8 culture supernatants (1:4) followed by PE-labeled F(ab′)2 goat anti–rat IgG pAb (Southern Biotechnology Associates, Inc.). Cells were then blocked by normal rat IgG and stained with FITC-labeled anti-B220 and biotin-labeled anti-CD5 mAbs followed by APC-streptavidin. Flow cytometric analysis and cell sorting was carried out using FACStarPLUS™ (Becton Dickinson) with CELLQuest™ software (Becton Dickinson) or using EPICS ELITE® (Beckman Coulter). The purity of sorted cells exceeded 95%.
Chemotaxis Assay.
Chemotaxis assay using ChemoTx plate (Neuro Probe) was performed according to the manufacturer's instructions. In brief, spleen cells were suspended at 106 cells/ml in RPMI 1640 containing 0.5% BSA and 20 mM HEPES. 60 μl of cell suspension was loaded on the membrane plate and placed onto a flat-bottomed microtiter plate with 96 wells containing 30 μl of serially diluted BLC solution in each well. The plate was then incubated at 37°C for 90 min and migrated cells were collected. Cells were then stained with FITC-labeled anti-CD5 and PE-labeled anti-B220 mAbs and counted on an EPICS ELITE cell sorter. Chemotaxis assays for B1 and B2 cells were performed on the same plate and on the same day in each experiment because the absolute migrated cells varies in each chemotaxis assay. For chemotaxis assay for purified B1 and B2 cells, the mixture of 5 × 10⁶ spleen and the peritoneal cells from young BWF1 mice was stained with FITC-labeled anti-CD5 and PE-labeled anti-B220 mAbs and subjected to cell sorting using an EPICS ELITE cell sorter. The purity of B1 and B2 cells was >95% in all experiments.
Statistical Analysis.
Statistical analysis was performed using Student's t test. The 95% confidence limit was taken as significant.
Results
Marked Increase in BLC Expression in the Target Organs of Aged BWF1 Mice Developing Lupus Nephritis.
Histological examination showed that a massive mononuclear cell infiltration in the kidney and the lung, but not in the liver in aged BWF1 mice developing lupus nephritis (Fig. 1 A). Cellular infiltrates are usually observed around the renal artery and arcuate arteries in the kidney and around pulmonary arteries in the lung. Reverse transcription (RT)-PCR analysis revealed that BLC gene expression was markedly increased in the kidney and the thymus in aged BWF1 mice compared with that in young mice (Fig. 1 B).
Figure 1.

Marked increase in BLC expression in the kidney and the thymus in aged BWF1 mice. (A) Hematoxylin and eosin staining of paraffin-embedded sections from the kidney, lung, and liver in aged BWF1 mice developing lupus nephritis. A representative histology from >10 examinations of aged BWF1 mice is presented. Similar histological findings were obtained in other examinations. (B, a) RT-PCR analysis was performed on total cellular RNAs obtained from the spleen (Spl), thymus (Thy), lung, kidney (Kid), and liver of young and aged BWF1 mice. A representative result from four independent experiments is presented. Similar results were obtained in other experiments. (b) Real-time quantitative PCR was performed as described in Materials and Methods. BLC quantity in aged mice was normalized by the level of GAPDH and compared with that in young mice. The results were expressed as mean magnification (fold) ± SD for triplicate samples. A representative result from three independent experiments is presented. Similar results were obtained in other experiments. *P < 0.01, **P < 0.001. (C) Kidney cryosections from aged BWF1 mice were stained with goat anti-BLC pAbs followed by biotinylated rabbit anti–goat pAb and HRP-labeled streptavidin. Representative pictures from one of three aged BWF1 mice are presented. (D, a) RNAs obtained from spleen cells, LN cells, and thymic cells of similarly aged NZB, NZW, and BWF1 mice were used for RT-PCR. Similar level of PCR products for GAPDH were obtained (not shown). Three mice for each strain were examined and similar results were obtained. (b) Real-time quantitative PCR analysis on thymic cells obtained from similarly aged NZB, NZW, and BWF1 mice. BLC quantity in aged mice was normalized by the level of GAPDH and compared with that in young mice. The results were expressed as mean magnification (fold) ± SD for triplicate samples. A representative result from three independent experiments is presented. Similar results were obtained in other experiments. *P < 0.01, **P < 0.001.
Quantitative difference in BLC expression in the thymus and the kidney between young and aged BWF1 mice was confirmed by real-time PCR analysis (Fig. 1 B, b). Extremely high magnification of BLC expression was observed in the thymus and the kidney of aged BWF1 mice compared with normalized BLC quantity in young BWF1 mice (2,004 ± 296 and 483 ± 50-fold, respectively). Expression of several other chemokines such as monokine induced by IFN-γ (Mig) and regulated upon activation, normal T cell expressed and secreted (RANTES) were also increased in the thymus and the kidney in aged BWF1 mice compared with young mice, whereas thymus and activation-regulated chemokine (TARC), monocyte chemoattractant protein 1 (MCP-1), and macrophage inflammatory protein (MIP)-1a were not detected in RT-PCR analysis (data not shown). BLC expression was also increased in enlarged draining LNs for the lung and the kidney (data not shown). Immunohistochemical staining for BLC with anti-BLC pAbs demonstrated the presence of BLC-positive cells in the cellular infiltrates in the kidney and the thymus with a reticular pattern of staining (Fig. 1 C). Many B cells, CD4+ T cells, F4/80+ macrophages, but a few CD8 T cells were present in the cellular infiltrates, and MHC class II molecules were strongly expressed in the entire region of the infiltrates (data not shown). Similar results were obtained with the infiltrated lung (data not shown). In the thymus, normal thymic architecture was lost and BLC was diffusely distributed in the entire region (Fig. 1 C). Arterial walls were strongly stained by anti-BLC pAbs presumably due to massive secretion of BLC in the thymus in aged BWF1 mice. RT-PCR analysis on microdissected cells obtained from kidney cryosections showed that BLC expression was largely confined to the mononuclear cell infiltrates in aged BWF1 mice (data not shown). BLC expression in the thymus of similarly aged NZB and NZW mice was marginal compared with that in aged BWF1 mice (Fig. 1 D, a). Similar levels of PCR products for GAPDH were obtained (not shown). Real-time PCR analysis on BLC expression in the thymus confirmed an extremely high magnification of BLC expression in the thymus of aged BWF1 mice compared with aged NZB and NZW mice (Fig. 1 D, b). BLC expression in aged NZB mice was significantly increased in aged NZB mice, although it was much lower than that in BWF1 mice (26.5 ± 6.4 versus 696 ± 171-fold increase compared with normalized BLC quantity in young mice).
Identification of BLC-producing Cells in Aged BWF1 Mice.
FCM analysis showed that CD11b+CD11c+ cells were significantly increased in the thymus and spleen in aged BWF1 mice (Fig. 2 A). The percentages of CD11b+CD11c+ cells in the thymus in young and aged mice were 0.49 ± 0.08 (n = 4) and 5.58 ± 2.39 (n = 4), respectively (P < 0.01). In the spleen, those in young and aged mice were 2.37 ± 0.32 (n = 4) and 5.70 ± 3.36, respectively (P < 0.05). CD11b+CD11c+ cells were also slightly increased in similarly aged NZB mice compared with that in aged NZW mice (1.07 ± 0.60% in aged NZB mice, 0.13 ± 0.06% in aged NZW mice; n = 3, P < 0.01), although the percentage was lower than that in aged BWF1 mice. RT-PCR analysis on highly purified leukocyte subpopulations demonstrated that BLC was highly expressed in splenic CD11c+ cells obtained from aged BWF1 mice, but not in CD4+ T cells or B cells including B1 and B2 cells (Fig. 2 B, a). Enriched BLC expression in splenic CD11c+ cells in aged BWF1 mice was confirmed by real-time quantitative PCR analysis (Fig. 2 B, b). Similar results were obtained with FCM-sorted CD11b+ CD11c+ cells derived from the thymus of aged BWF1 mice as well as MACS-purified CD11c+ cells (Fig. 2 C, a and b). CD11b+CD11c+ cells in the spleen and thymus in aged BWF1 mice also highly expressed MHC class II on the cell surfaces (data not shown). These results suggested that mature myeloid DCs were the major cell source for BLC in aged BWF1 mice developing lupus nephritis. In accordance with the enhanced expression of BLC in aged BWF1 mice, many CD11c+, CD11b+, and B220+ cells were infiltrated in the thymus (Fig. 2 D). It should be noted that CD11c+ cells showed a similar localization to CD11b+ cells in adjacent thymic cryosections.
Figure 2.

Identification of BLC-producing cells in aged BWF1 mice. (A) FCM analysis on splenic and thymic cells from young and aged BWF1 mice stained with FITC-labeled anti-CD11b and PE-labeled anti-CD11c mAbs. A representative FCM profile from four independent experiments is presented. The percentages of CD11b+CD11c+ cells in the thymus in young and aged mice were 0.49 ± 0.08 (n = 4) and 5.58 ± 2.39 (n = 4), respectively (P < 0.01). In the spleen, those in young and aged mice were 2.37 ± 0.32 (n = 4) and 5.70 ± 3.36, respectively (P < 0.05). (B, a) RT-PCR analysis for BLC expression on highly purified splenic (Spl) CD4, B, B1, B2, and CD11c+ cells obtained from aged BWF1 mice. Appropriately stained CD4, B, B1, and B2 cells were sorted on FCM, and CD11c+ cells were purified on MACS® magnetic beads coupled with anti-CD11c mAb. One of three independent experiments is shown. Similar results were obtained in other experiments. (b) Real-time quantitative PCR on the same samples as Fig. 2 B, a. BLC quantity in each purified cell population was expressed relative to normalized BLC quantity in the whole splenic cells. PCR reactions were run in triplicate. (C, a) RT-PCR analysis on magnetic beads-purified CD11c+ cells and sorted CD11b+CD11c+ cells obtained from aged BWF1 thymus (Thy). The results are representative of three independent experiments. (b) Real-time quantitative PCR on the same samples as Fig. 2 C, a. BLC quantity in each purified cell population was expressed relative to normalized BLC quantity in the whole thymic cells. (D) Immunohistochemical examinations on thymic cryosections from young and aged BWF1 mice. 4-micron thick thymic cryosections were stained with anti-CD11b, CD11c, or B220 mAb followed by HRP-labeled rabbit anti–rat pAb. A representative histology from five young and aged mice was presented.
B1 and B2 Cells Were Markedly Increased in the Thymus in Aged BWF1 Mice.
Flow cytometric analysis on the thymus revealed that CD4+CD8+ double-positive T cells were dramatically decreased in the aged thymus whereas CD4 single-positive cells and B cells were markedly increased (Fig. 3 A). The percentages of CD4+ T cells in young and aged mice were 16.2 ± 6.0% (n = 4) and 51.0 ± 5.3% (n = 4), respectively (P < 0.001), whereas those of CD8+ T cells were 5.92 ± 1.2% and 11.1 ± 3.3%, respectively (_P_ < 0.05). Most of the double-negative cells in the aged thymus turned out to be B cells, including B1 cells (Fig. 3 A). The total percentage of B cells in the thymus in young and aged mice was 0.69 ± 0.16 (_n_ = 4) and 18.1 ± 6.3% (_n_ = 5), respectively (_P_ < 0.01). The percentages of B1 cells in the thymus were 0.28 ± 0.08 (_n_ = 4) and 5.15 ± 2.67% (_n_ = 5) in young and aged mice, respectively (_P_ < 0.01), whereas those of B2 cells were 0.35 ± 0.18 and 10.2 ± 5.5%, respectively (_P_ < 0.01). B1 cells were also often increased in the spleen and enlarged LNs, including pulmonary LNs and renal LNs in aged BWF1 mice (data not shown). The percentages of B1 cells in young and aged spleen were 4.84 ± 0.7% (_n_ = 6) and 7.0 ± 3.83% (_n_ = 8), respectively (_P_ > 0.05), whereas those of B2 cells were 31.4 ± 7.8% 6 and 36.2 ± 8.4% 8, respectively (P > 0.05). Dramatic decrease in the number of CD4+CD8+ T cells and marked increase in CD4+ and B cells in the thymus was not observed in similarly aged NZB and NZW mice (Fig. 3 B). Aged BALB/c mice did not show any abnormality in lymphocyte subsets either (data not shown). B1/B2 ratio in the aged thymus was significantly higher than that in the spleen and the peripheral blood, suggesting that B1 cells were accumulated in the thymus in aged BWF1 mice (Fig. 3 C). Although increase in BLC expression and the number of B1 cells in the spleen was often observed in aged BWF1 mice, B1/B2 ratio was not statistically significant.
Figure 3.

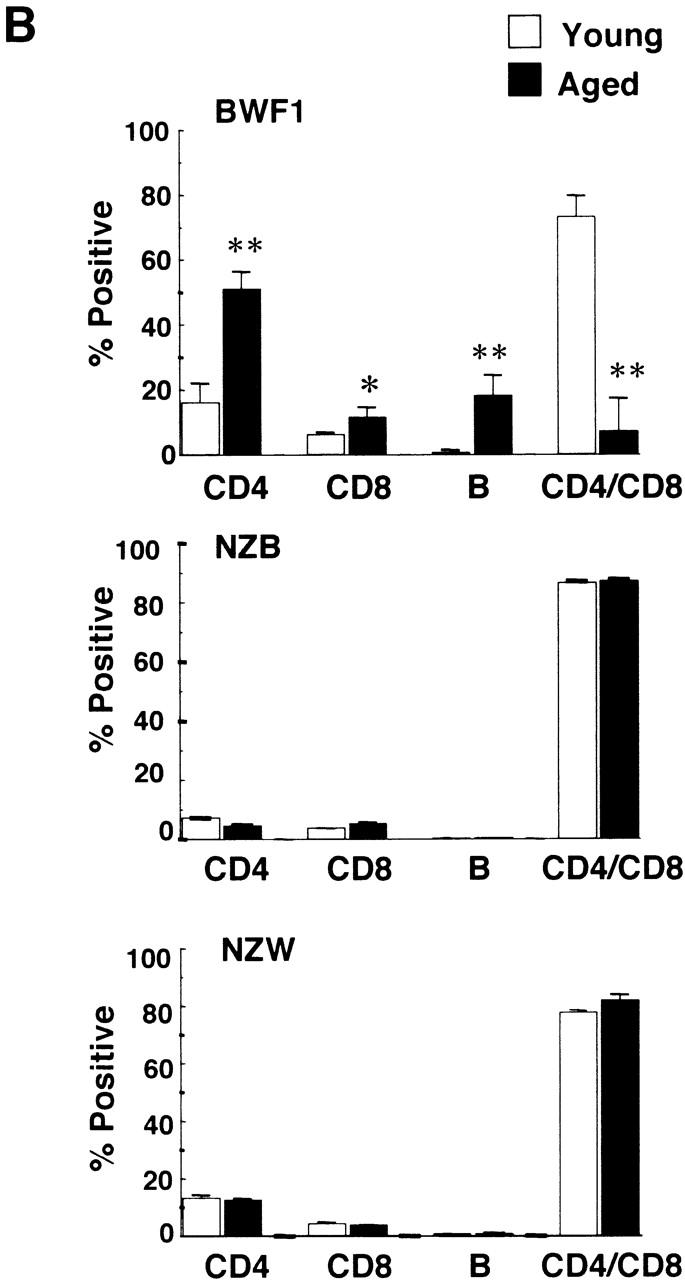

Dramatic increase of CD4+ T and B cells including B1 cells in the thymus in aged BWF1 mice. (A) Flow cytometric analysis was performed on thymocytes from young and aged BWF1 mice. Four-color analysis was performed on thymocytes using FITC-CD4, Alexa 594-CD8, PE-B220, and APC-CD5. A representative FCM profile from four independent experiments is presented. (B) The percentages of CD4+ T cells in young and aged mice were 16.2 ± 6.0% (n = 4) and 51.0 ± 5.3% (n = 4), respectively (P < 0.001), whereas those of CD8+ T cells were 5.92 ± 1.2% (n = 4) and 11.1 ± 3.3% (n = 4), respectively (P < 0.05). The total percentage of B cells in the thymus in young and aged mice was 0.69 ± 0.16 (n = 4) and 18.1 ± 6.3% (n = 5), respectively (P < 0.001). The percentages of B1 cells in the thymus were 0.28 ± 0.08 (n = 4) and 5.15 ± 2.67% (n = 5) in young and aged mice, respectively (P < 0.01), whereas those of B2 cells were 0.35 ± 0.18 (n = 4) and 10.2 ± 5.5% (n = 5), respectively (P < 0.01). *P < 0.01, **P < 0.001. (C) B1/B2 ratios in the thymus (n = 5), the spleen (n = 5), and the peripheral blood (n = 4) in aged BWF1 mice are presented (0.42 ± 0.13, 0.18 ± 0.14, and 0.13 ± 0.05, respectively). *P < 0.01.
BLC Preferentially Chemoattracts B1 Cells In Vitro.
Chemotaxis assay for BLC using highly purified sorted B1 and B2 cells was then performed to examine the differential effect of BLC on B1 and B2 cells. Interestingly, B1 cells were chemoattracted towards BLC much more efficiently than B2 cells (Fig. 4 A). Preferential chemotaxis of B1 cells towards BLC was observed in other mouse strains including NZB, NZW, BALB/c, and C57BL/6 mice, although the total number of migrated cells and percentage of input varied in each assay (Fig. 4A and Fig. C). When peritoneal cells from NZB, NZW, and BWF1 mice were assayed at 0.3 μg/ml BLC on the same day on the same plate, a similar number of cells was migrated (data not shown). Approximately four times more B1 cells were migrated towards BLC at the concentration of 0.1 and 0.3 μg/ml with a bell-shaped dose–response curve (Fig. 4 A). Kinetic study also showed a preferential chemotaxis of B1 cells towards BLC (Fig. 4 B). Preferential chemotaxis of B1 cells towards BLC was also observed when whole spleen cells were used and stained with anti-CD5 and B220 mAbs after chemotaxis assays. B1/B2 ratios before and after migration were 0.16 ± 0.04 and 0.43 ± 0.28 (n = 6), respectively (P < 0.05), suggesting that preferential chemotaxis of B1 cells towards BLC is not attributed to a possible artifact by anti-CD5 Ab. A most representative FCM profile is shown in Fig. 4 D. The percentage of B1 cells in migrated cells was surprisingly increased after chemotaxis in this experiment.
Figure 4.

Preferential chemotaxis of B1 cells towards BLC. (A) Mixture of spleen and peritoneal cells from young BWF1 mice were stained for FITC-labeled CD5 and PE-B220 and sorted into B1 and B2 cells on an EPICS ELITE® cell sorter and then subjected to BLC chemotaxis assay as described in Materials and Methods. Migrated cells were counted on an FCM under the constant flow rate. Chemotaxis assays for B1 and B2 cells obtained from each strain were performed on the same plate on the same day. One of three independent experiments for each mouse strain is presented. Similar results were obtained in all experiments with a bell-shaped dose–response curve, although total cell number of migrated cells varied in each experiment. (B) Kinetic study was performed using FCM-sorted B1 and B2 cells at a concentration of 0.3 μg/ml rBLC. (C) Chemotaxis assays were also performed on B1 and B2 cells derived from C57BL/6 and BALB/c mice. One of two independent experiments is presented. A similar result was obtained in the other experiment. (D) Whole spleen cells from young BWF1 mice were used for chemotaxis assay for BLC. After chemotaxis, migrated cells were stained with FITC-labeled CD5 and PE-B220 mAbs and analyzed on EPICS ELITE®. A typical FCM profile is presented from six chemotaxis assays.
CXCR5 Expression on B1 and B2 Cells.
Flow cytometric analysis on peritoneal B1 and splenic B2 cells using anti-CXCR5 mAb demonstrated that cell surface expression of CXCR5 on peritoneal B1 cells was much higher than that on splenic B2 cells (Fig. 5 A). However, analysis on B1 and B2 cells in the same tissue localization revealed that the difference in CXCR5 expression was not so striking as it was seen between peritoneal B1 and splenic B2 cells, suggesting that the level of CXCR5 expression on B1 and B2 cells is dependent on or influenced by tissue localization (Fig. 5 B). Mean fluorescence channels for peritoneal B1 cells and splenic B2 cells were 12.0 ± 0.76 (n = 4) and 2.28 ± 0.46 (n = 4), respectively (P < 0.001). It should be noted that peritoneal B2 cells show much higher CXCR5 expression than splenic B2 cells (8.4 ± 0.54 versus 2.28 ± 0.46, respectively; P < 0.001). On the other hand, splenic B1 cells have lower CXCR5 expression than peritoneal B1 cells (5.2 ± 0.92 and 12.0 ± 0,76, respectively, P < 0.001). However, both splenic and peritoneal B1 cells showed higher expression of CXCR5 than B2 cells in the same tissue (Fig. 5 B).
Figure 5.


Higher CXCR5 expression on B1 than B2 cells. (A) Mixture of spleen and peritoneal cells from young BWF1 mice were stained with anti-CXCR5, anti-CD5, and anti-B220 mAbs and then analyzed for CXCR5 expression on gated B1 or B2 population using a FACStar™ FCM. A representative flow cytometric profile from three mice is presented. Mean fluorescence channels for B1 and B2 cells were 796 ± 18 (n = 3) and 113 ± 9.0 (n = 3), respectively (P < 0.001). Staining on CD5−B220− cells was presented as an internal control. Rat IgG control showed no positive staining. (B) Similar experiments using whole spleen or peritoneal cells from four mice were performed in addition to the mixed population and analyzed on an EPICS ELITE® FMC. Mean fluorescence channels for peritoneal B1 cells and splenic B2 cells were 12.0 ± 0.76 (n = 4) and 2.28 ± 0.46 (n = 4), respectively (P < 0.001). It should be noted that peritoneal B2 cells show much higher CXCR5 expression than splenic B2 cells (8.4 ± 0.54 versus 2.28 ± 0.46, respectively; P < 0.001). On the other hand, splenic B1 cells have lower CXCR5 expression than peritoneal B1 cells (5.2 ± 0.92 and 12.0 ± 0.76, respectively; P < 0.001).
Discussion
BLC (CXCL13), a CXC chemokine, is the only chemokine so far which is known to specifically chemoattract B cells through the interaction with its receptor CXCR5 18 19. Recent report has also demonstrated that activated T cells as well as B cells migrated towards BLC 20. This study demonstrated that BLC was markedly increased in the target organs especially in the thymus and kidney in aged BWF1 mice whereas BLC was barely detected in these organs in young mice. Reticular pattern of BLC staining in the cellular infiltrates in the target organs and high expression of BLC in purified CD11b+11c+ or CD11c+ cells strongly suggested that myeloid DCs were the major cell source for BLC in aged BWF1. Mazzucchelli et al. 21 recently reported that BLC was expressed in _Helicobacter pylori_–induced mucosa-associated lymphoid tissue and gastric lymphoma, suggesting that transformed B cells were a possible source of BLC. However, it is highly unlikely that BLC was produced by B cells in aged BWF1 mice because RT-PCR analysis on sorted splenic B cells including B1 and B2 cells showed a much lower level of BLC expression than that in CD11c+ cells. It is also unlikely that enhanced BLC expression was attributed to FDCs in aged BWF1 mice because FDCs are generally considered to be CD11c negative and purified CD11c+ cells from aged BWF1 spleen cells were negative for CD35 and FDC-M1 (data not shown). Ansel et al. 22 reported that BLC staining was detected in CR1− follicular stromal cells as well as CR1+ FDCs in B cell follicles, also indicating that FDCs are not the only cell source for BLC.
Consistent with marked increase in BLC expression in the thymus in aged BWF1 mice, many CD11b+C11c+ cells as well as B cells were infiltrated in the thymus. The presence of abnormal DCs in thymus may give rise to positive selection of autoreactive T cells, instead of the normal negative selection. This possibility was supported by the fact that CD4 single-positive T cells were in fact markedly increased in the thymus in aged BWF1 mice whereas CD4+CD8+ T cells were dramatically decreased. It is quite likely that autoreactive T cells stimulate B cells including B1 cells in the presence of BLC-producing DCs in the thymus of aged BWF1 mice. It has been recently reported that CXCR5+ CD4 T cells designated as follicular helper T cells (TFH) are specifically involved in IgG production by B cells 23 24. It is also tempting to speculate that cell–cell interaction between BLC-producing DCs, TFH, and B cells including B1 cells play a pivotal role for IgG autoantibody production in aged BWF1 mice. Massive IgG autoantibody production and accumulation in site in the target organs such as the kidney and the lung would cause more direct damages on these organs than systemic autoantibody production. In this context, maturing signals for DCs in the thymus or chemokine/chemokine receptors involved in trafficking and localization of BLC producing DCs would be the most critical element in the development of lupus nephritis.
The thymus is not the only organ where BLC is expressed, but BLC is constitutively expressed in B cell follicles in secondary lymphoid organs and also in other organs including the lung and liver. We do not know at this point whether BLC-expressing cells in these organs play the same role in activating T and B cells as those in the thymus of aged BWF1 mice. BLC expression in the second lymphoid organs in young mice is most likely derived from FDCs in B cell follicles. It has not been proved, however, that FDCs present antigens to T cells directly in vivo. Furthermore, Gray et al. 25 suggested that FDCs did not synthesize MHC class II molecules, but acquire MHC molecules shed from B cells. Therefore, antigen presenting ability of FDCs might be much less efficient than mature DCs. On the other hand, BLC expressing cells in nonlymphoid organs may not be DCs, but specialized macrophages such as alveolar macrophages and Kupffer cells. We favor the idea that only mature DCs producing BLC effectively activate autoreactive T and B cells in a cognate manner. Lack of mononuclear cell infiltration in the liver of aged BWF1 mice is a matter of interest. Limmer et al. 26 recently reported that hepatic endothelial cells induced antigen-specific T cell tolerance. Autoreactive T cell response in the liver could be tolerated or suppressed in aged BWF1 mice. Alternatively, DC maturation may be inhibited in the liver microenvironment.
BLC expression in the thymus slightly, but significantly increased in aged NZB, but not in NZW mice, although the level of BLC expression was much lower than that in aged BWF1 mice. It was also observed that the percentage of CD11b+CD11c+ cells in aged NZB mice were significantly higher than that in aged NZW mice, suggesting that BLC expression in the thymus is not merely an age-related phenomenon. NZB mice spontaneously develop autoimmune hemolytic mediated by B1 cells 15 16, but never develop lupus nephritis, suggesting that other factors are required for the full development of lupus nephritis. In fact, many candidate genes have been mapped so far by genetic analysis on responsible genes for murine lupus 1 2 3. It is, therefore, likely that expression of some of the polymorphic candidate genes derived from NZW strain are involved in the development of lupus nephritis in addition to BLC upregulation in BWF1 mice. Alternatively, the difference in the number of CD11b+CD11c+ cells between aged BWF1 and NZB thymus (5.58 versus 1.07%) is critical and enough for induction of massive T cell activation in the thymus. Ansel et al. 22 recently reported the presence of a positive feedback mechanism between BLC and LTα1β2 in the formation of primary B cell follicles, where BLC induces LTα1β2 expression by B cells and LTα1β2 then promotes maturation of FDCs. Possible difference in the level of LTα1β2 expression might result in different maturation stage of DCs in the thymus. It was also reported that circulating zTNF4 (B lymphocyte stimulator [Blys], B cell activation factor from the TNF family [BAFF], TNF and apoptosis ligand–related leukocyte-expressed ligand 1 [TALL-1], TNF homologue that activates apoptosis, nuclear factor B, and c-Jun NH2-terminal kinase [THANK]), a potent coactivator of B cells in vivo and in vitro, was abundant in BWF1 mice and MRL/lpr mice during the development of SLE, and that transgenic mice overexpressing zTNF4 in lymphoid cells developed SLE-like symptoms and expanded B1 cells in the spleen 27 28 29 30 31. Autoantibody production would be greatly accelerated if BLC-expressing DCs are potent zTNF4 producers.
The finding of preferential chemotactic activity of BLC for B1 cells is of particular interest. Preferential chemotactic activity of BLC for B1 cells was also observed in NZB, NZW, C57BL/6, and BALB/c mice, suggesting that B1 cells have a unique property to migrate towards BLC. Flow cytometric analysis on CXCR5 using anti-CXCR5 mAb showed higher expression of CXCR5 molecules on B1 cells than B2 cells. It is, therefore, most likely that preferential chemotactic activity of BLC on B1 cells is attributed to higher CXCR5 expression on B1 cells than B2 cells. However, it should be noted that CXCR5 expression on B1 and B2 cells is different depending on their tissue localization. Splenic B1 cells express lower CXCR5 than those in the peritoneum whereas peritoneal B2 cells do express higher CXCR5 than splenic B2 cells. Edward et al. 32 recently reported the developmental switches in chemokine response profiles during B cell differentiation and maturation. They observed no differences in BLC chemotaxis nor in CXCR5 expression between B1 and B2 cells. The difference between their results and ours is possibly attributed to relatively high expression of CXCR5 on peritoneal B2 cells because they used C57BL/6 peritoneal cells instead of purified B1 and B2 cells. We also observed high background migration in chemotaxis chambers with 5 μm pore size which they used. Finally, BLC concentration (500 nM) they used was much higher than that for maximum chemotaxis in our experimental system. It is unlikely that prior staining with anti-CD5 and B220 Abs to chemotaxis assay affected B1 and B2 cell migration because significant increase in B1/B2 ratio was also observed when unstained whole spleen cells were used. With regard to the different result on CXCR5 expression on B1 and B2 cells, it is most likely attributed to use of anti-CXCR5 mAb in our experiments instead of polyclonal Ab. The fact that many B cells were infiltrated in the thymus in aged BWF1 mice and B1/B2 ratio was significantly higher than that in the spleen and peripheral blood suggested that B1 cells were also preferentially recruited in vivo towards BLC. Higher B1/B2 ratio in the thymus in aged BWF1 mice than other BLC constitutively expressing-organs might be attributed to potent antigen presenting ability of BLC producing DCs in the thymus and subsequent accumulation of T cell factors required for B1 cell expansion (IL-5, for example). In other words, BLC-producing mature DCs in the thymus and other target organs, but not FDCs or specialized macrophages, could play a role in the development of systemic autoimmune disease. Although B1 cells have long been considered to be involved in IgM autoantibody production, no direct evidence for the development of SLE has been provided. Pathogenic IgG autoantibody production by B1 cells may be initiated in the thymus of aged BWF1 mice in the presence of autoreactive CD4+ T cells and mature myeloid DCs.
Collectively, we have demonstrated for the first time that BLC expression by DCs was strikingly enhanced in the target organs in a murine model for SLE and that BLC preferentially chemoattracts B1 cells. These results suggest that aberrant trafficking and localization of BLC-producing DCs could cause tolerance breakdown in the thymus and induce systemic autoantibody production. This study also give us novel insight into SLE as a disorder in chemokine/DC dynamics and may provide a new therapeutic approach to regulate the disease by targeting the chemokine/chemokine receptor system.
Acknowledgments
We are very grateful to Dr. Taichi Ezaki and Kenjiro Matusno for helpful comments on histological examinations. We also thank Dr. K. Maeda (Yamagata University School of Medicine) for a kind gift of FDC-M1 mAb.
This study was supported in part by grants from CREST (Core Research and Evolutional Science and Technology, Japan Science and Technology Corporation) and LRI (The Long-ranged Research Initiative, Japan).
Footnotes
Abbreviations used in this paper: APC, allophycocyanin; BLC, B lymphocyte chemokine; DC, dendritic cell; FCM, flow cytometer; FDC, follicular DC; GAPDH, glyceraldehyde 3-phosphate dehydrogenase; HRP, horseradish peroxidase; RT, reverse transcription.
References
- Theofilopoulos A.N. Murine models of systemic lupus erythematosus. Adv. Immunol. 1985;37:269–390. doi: 10.1016/s0065-2776(08)60342-9. [DOI] [PubMed] [Google Scholar]
- Kotzin B.L. Systemic lupus erythematosus. Cell. 1996;85:303–306. doi: 10.1016/s0092-8674(00)81108-3. [DOI] [PubMed] [Google Scholar]
- Shirai T., Hirose S., Okada T., Nishimura H. Immunology and immunopathology of the autoimmune disease of NZB and related mouse strains. In: Rihova E.B., Vetvicka V., editors. Immunological Disorders in Mice. CRC Press Inc; Boca Raton, FL: 1991. pp. 95–136. [Google Scholar]
- Baggiolini M. Chemokine and leukocyte traffic. Nature. 1998;392:565–568. doi: 10.1038/33340. [DOI] [PubMed] [Google Scholar]
- Banchereau J., Steinman R.M. Dendritic cells and control of immunity. Nature. 1998;392:245–252. doi: 10.1038/32588. [DOI] [PubMed] [Google Scholar]
- Sallusto F., Lanzavecchia A., Mackay C.R. Chemokine and chemokine receptors in T cell priming and Th1/Th2-mediated responses. Immunol. Today. 1998;19:568–574. doi: 10.1016/s0167-5699(98)01346-2. [DOI] [PubMed] [Google Scholar]
- Yoneyama H., Harada A., Imai T., Baba M., Yoshie O., Zhang Y., Higashi H., Murai M., Asakura H., Matsushima K. Pivotal role of TARC, a CC chemokine, in bacteria-induced fulminant hepatic failure in mice. J. Clin. Invest. 1998;102:1933–1941. doi: 10.1172/JCI4619. [DOI] [PMC free article] [PubMed] [Google Scholar]
- Yoneyama H., Matsuno K., Zhang Y., Murai M., Itakura M., Ishikawa S., Hasegawa G., Naito M., Asakura H., Matsushima K. Regulation by chemokines of circulating dendritic cell precursors, and the formation of portal tract–associated lymphoid tissue, in a granulomatous liver disease. J. Exp. Med. 2001;193:35–49. doi: 10.1084/jem.193.1.35. [DOI] [PMC free article] [PubMed] [Google Scholar]
- Pearson C.I., McDevitt H.O. Redirecting Th1 and Th2 responses in autoimmune diseases. Curr. Top. Microbiol. Immunol. 1999;238:79–122. doi: 10.1007/978-3-662-09709-0_5. [DOI] [PubMed] [Google Scholar]
- Theofilopoulos A.J., Lawson B.R. Tumor necrosis factor and other cytokines in murine lupus. Ann. Rheum. Dis. 1999;58:149–155. doi: 10.1136/ard.58.2008.i49. [DOI] [PMC free article] [PubMed] [Google Scholar]
- Hayakawa K., Hardy R.R., Parks D.R., Herzenberg L.A. The “Ly-1 B” cell subpopulations in normal, immunodefective, and autoimmune mice. J. Exp. Med. 1983;157:202–218. doi: 10.1084/jem.157.1.202. [DOI] [PMC free article] [PubMed] [Google Scholar]
- Herzenberg L.A. The Ly-1 B cell lineage. Immunol. Rev. 1986;93:81–102. doi: 10.1111/j.1600-065x.1986.tb01503.x. [DOI] [PubMed] [Google Scholar]
- Herzenberg L.A. B-1 cellsthe lineage question revisited. Immunol. Rev. 2000;175:9–22. [PubMed] [Google Scholar]
- Fagarasan S., Honjo T. T independent immune responseNew aspects of B cell biology. Science. 2000;290:89–92. doi: 10.1126/science.290.5489.89. [DOI] [PubMed] [Google Scholar]
- Murakami M., Tsubata T., Okamoto M., Shimizu A., Kumagai S., Imura H., Honjo T. Antigen-induced apoptotic death of Ly-1 B cells responsible for autoimmune disease in transgenic mice. Nature. 1992;357:77–80. doi: 10.1038/357077a0. [DOI] [PubMed] [Google Scholar]
- Murakami M., Tsubata T., Shinkura R., Nishitani S., Okamoto Yoshioka H.M., Usui T., Miyawaki S., Honjo T. Oral administration of lipopolysaccharides activated B-1 cells in the peritoneal cavity and lamina propria of the gut and induces autoimmune symptoms in an autoantibody-transgenic mice. J. Exp. Med. 1994;180:111–121. doi: 10.1084/jem.180.1.111. [DOI] [PMC free article] [PubMed] [Google Scholar]
- Wortis H.H., Berland R. Origin of B1 cells. J. Immunol. 2001;166:2163–2166. doi: 10.4049/jimmunol.166.4.2163. [DOI] [PubMed] [Google Scholar]
- Forster R., Mattis A.E., Kremmer E., Wolf E., Brem G., Lipp M. A putative chemokine receptor, BLR1, directs B cell migration to defined lymphoid organs and specific anatomic compartment of the spleen. Cell. 1996;87:1037–1047. doi: 10.1016/s0092-8674(00)81798-5. [DOI] [PubMed] [Google Scholar]
- Gunn M.D., Ngo V.N., Ansel K.M., Ekland E.H., Cyster J.G., Williams L.T. B-cell-homing chemokine made in lymphoid follicles activates Burkitt's lymphoma receptor-1. Nature. 1998;391:799–803. doi: 10.1038/35876. [DOI] [PubMed] [Google Scholar]
- Ansel K.M., McHeyzer-Williams L.J., Ngo V.N., McHeyzer-Williams M.G., Cyster J.G. In vivo-activated CD4 T cells upregulate CXC chemokine receptors 5 and reprogram their response to lymphoid chemokines. J. Exp. Med. 1999;190:1123–1134. doi: 10.1084/jem.190.8.1123. [DOI] [PMC free article] [PubMed] [Google Scholar]
- Mazzucchelli L., Blaser A., Kappeler A., Scharli P., Laissue J.A., Baggiolini M., Uguccioni M. BCA-1 is highly expressed in Helicobacter pylori-induced mucosa-associated lymphoid tissue and gastric lymphoma. J. Clin. Invest. 1999;104:49–54. doi: 10.1172/JCI7830. [DOI] [PMC free article] [PubMed] [Google Scholar]
- Ansel K.M., Ngo V.N., Hyman P.L., Luther S.A., Forster R., Sedgwick J.D., Browining J.L., Lipp M., Cyster J.G. A chemokine-driven positive feedback loop organizes lymphoid follicles. Nature. 2000;406:309–314. doi: 10.1038/35018581. [DOI] [PubMed] [Google Scholar]
- Schaerli P., Willmann K., Lung A.B., Lipp M., Loetscher P., Moser B. CXC chemokine receptor 5 expression defines follicular homing T cells with B cell helper function. J. Exp. Med. 2000;192:1553. doi: 10.1084/jem.192.11.1553. [DOI] [PMC free article] [PubMed] [Google Scholar]
- Breitfeld D., Ohl L., Kremmer E., Ellwart J., Sallusto F., Lipp M., Forster R. Follicular B helper T cells express CXC chemokine receptor 5, localize to B cell follicles, and support immunoglobulin production. J. Exp. Med. 2000;192:1545–1552. doi: 10.1084/jem.192.11.1545. [DOI] [PMC free article] [PubMed] [Google Scholar]
- Gray D., Kosco M., Stockinger B. Novel pathway of antigen presentation for the maintenance of memory. Int. Immunol. 1991;3:141–148. doi: 10.1093/intimm/3.2.141. [DOI] [PubMed] [Google Scholar]
- Limmer A., Ohl J., Kurts C., Ljungren H.-G., Reiss Y., Groettrup M., Monberg F., Arnold B., Knolle P.A. Efficient presentation of exogenous antigen by liver endothelial cells to CD8+ T cells results in antigen-specific T-cell tolerance. Nat. Med. 2000;6:1348–1354. doi: 10.1038/82161. [DOI] [PubMed] [Google Scholar]
- Gross J.A., Johnston A.J., Mudri S., Enselman R., Dillon S.R., Madden K., Xu W., Parish-Novak J., Foster D., Lofton-Day C. TACI and BCMA are receptors for a TNF homologue implicated in B-cell autoimmune disease. Nature. 2000;404:995–998. doi: 10.1038/35010115. [DOI] [PubMed] [Google Scholar]
- Moore P.A., Belvedere O., Orr A., Pieri K., LaFleur D.W., Feng P., Soppet D., Charters M., Gentz R., Parmelee D. Blysmember of the tumor necrosis factor family and B lymphocytes stimulator. Science. 1999;285:260–263. doi: 10.1126/science.285.5425.260. [DOI] [PubMed] [Google Scholar]
- Shu H.-B., Hu W.-H., Johnson H. TALL-1 is a novel member of the TNF family that is down-regulated by mitogens. J. Leukoc. Biol. 1999;65:680–683. [PubMed] [Google Scholar]
- Mukhopadlyay A., Ni J., Zhai Y., Yu G.-L., Aggarwal B.B. Identification and characterization of a novel cytokine, THANK, a TNF homologue that activates apoptosis, nuclear factor-kappaB, and c-jun NH2-terminal kinase. J. Biol. Chem. 1999;274:15978–15981. doi: 10.1074/jbc.274.23.15978. [DOI] [PubMed] [Google Scholar]
- Schneider P., Mackay F., Steiner V., Hofmann K., Bodmer J.L., Holler N., Ambrose C., Lawton P., Bixer S., Acha-Orbea H. BAFF, a novel ligand of the tumor necrosis factor family, stimulates B cell growth. J. Exp. Med. 1999;189:1747–1756. doi: 10.1084/jem.189.11.1747. [DOI] [PMC free article] [PubMed] [Google Scholar]
- Edward P.B., Campbell J.J., Soler D., Dong Z., Manlogat N., Picarella D., Hardy R.R., Butcher E.C. Developmental switches in chemokine response profiles during B cell differentiation and maturation. J. Exp. Med. 2000;191:1303–1317. doi: 10.1084/jem.191.8.1303. [DOI] [PMC free article] [PubMed] [Google Scholar]