The Strategy of T Cell Antigen-presenting Cell Encounter in Antigen-draining Lymph Nodes Revealed by Imaging of Initial T Cell Activation (original) (raw)
Abstract
The development of an immune response critically relies on the encounter of rare antigen (Ag)-specific T cells with dendritic cells (DCs) presenting the relevant Ag. How two rare cells find each other in the midst of irrelevant other cells in lymph nodes (LNs) is unknown. Here we show that initial T cell activation clusters are generated near high endothelial venules (HEVs) in the outer paracortex of draining LNs by retention of Ag-specific T cells as they exit from HEVs. We further show that tissue-derived DCs preferentially home in the vicinity of HEVs, thus defining the site of cluster generation. At this location DCs efficiently scan all incoming T cells and selectively retain those specific for the major histocompatibility complex–peptide complexes the DCs present. Such strategic positioning of DCs on the entry route of T cells into the paracortex may foster T cell–DC encounter and thus optimize initial T cell activation in vivo.
Keywords: T cell activation, dendritic cells, imaging, in vivo
Introduction
A critical event in the initiation of an immune response is the encounter of Ag-specific T cells with DCs that present the Ag of interest. Confronted with the low frequency of the two protagonists, the immune system has evolved efficient strategies for the two cell types to meet within organized lymphoid organs. On one hand, lymphocytes continuously patrol the entire body, achieving a complete tour of the lymphatic system within 24 h (1). On the other hand, DCs that pick up the Ag at the site of infection are stimulated by pathogen-derived signals to migrate through the afferent lymph toward the draining LNs (2). Although this strategy clarifies how the two cell types concentrate within one limited anatomical site, it still does not explain how Ag-specific T cells and relevant DCs find each other in the midst of millions of irrelevant cells present in the LN.
It has been proposed that appropriate anatomical location might be determined by changes of expression of chemokines and chemokine receptors during DC maturation (3). Stimulation by TNF-α, microbial products, or CD40 induces in DCs a redistribution of MHC molecules, expression of high level of costimulatory molecules, and thus maturation of DCs into potent stimulators of naive T cells (4). These maturation signals also induce in immature DCs the expression of the LN homing chemokine receptor CCR7, itself instructing trafficking of the DCs toward the LN (5–8). In addition, mature DCs express CCL19 (MIP-3β, ELC) and CCL21 (SLC), the ligands for CCR7, and may therefore attract naive and memory T cells within LNs (5). Because all naive T cells express CCR7, simple chemoattraction would appear inefficient, as all T cells within the LN would have to survey the entire LN and scan all activated DCs. An alternative model was proposed by Gretz et al. (9). Ultrastructural studies of LN paracortex suggest that high endothelial venules (HEVs) are part of organized structures: the paracortical cords. Thus, HEVs are at one end of a corridor that T cells would be obliged to take when crossing the endothelial barrier and gaining access to the paracortex. Gretz et al. (9) proposed that DCs settle within the corridors in the proximity of HEVs and there, as gatekeepers, scan all incoming T cells selectively retaining those that express a relevant TCR. This strategic location should permit more efficient recruitment of Ag-specific T cells into the immune response. Such organized routing of T cells is, however, questioned by the recent observation that T cells migrate randomly into intact LNs (10–13).
In this study, we report on the anatomy and mechanisms of initial T cell activation within the LN. We show by confocal microscopy that DCs that have picked up Ag within the skin preferentially locate in the vicinity of HEVs. We further show that this strategic location allows for an efficient scanning of incoming T cells and selective retention and activation of Ag-specific T cells. These results suggest a novel strategy that the immune system may have developed to optimize encounter of rare Ag-specific T cells and DCs presenting the Ag of interest.
Materials and Methods
Mice.
The 3A9 mice are transgenic for a TCR specific for the hen egg lysozyme (HEL) peptide 46–61 presented by I-Ak (14). The 3A9 mice were maintained on a CBA/J background and for adoptive transfer, crossed with B10.BR Ly5.1+ congenic mice.
Cells and Adoptive Transfer.
CD4+ T cells were purified from the LN of 3A9 transgenic mice by negative selection as previously described (15). On average, the population recovered was composed of >90% CD4+ T cells of which <3% were CD44+. The cells were labeled with 5-(and-6)-carboxyfluorescein diacetate succinimidyl ester (CFSE; Molecular Probes) or orange fluorescent tetramethylrhodamine (CMTMR) as previously described (15). (CBA/J×B10.BR)F1 recipient mice were injected intravenously with 2 × 10⁶ wild-type (W) or 3A9 CD4+ T cells.
Generation of DCs.
DCs were derived from BM by culture for 7 d in RPMI supplemented with 10% FCS, antibiotics, 2 mM glutamine, 50 μM 2-ME, and 30% conditioned medium from GM-CSF transfected NIH3T3 cells, as previously described (16, 17). Nonadherent DCs were harvested, incubated overnight with 3 μM peptide (pigeon cytochrome c [PCC] 88–104 or HEL 46–61), and 106 peptide-loaded DCs were injected into the footpads of recipient mice. 80% of the nonadherent cells are DC based on CD11c expression and express CD11b but not CD8α and B220.
Immunization.
Green (505/515) or red (580/605) fluorescent, 40 nm FluoSpheres® Neuravidin™-labeled microspheres were incubated with biotinylated HEL (Sigma-Aldrich) or BSA (Sigma-Aldrich). The mice were immunized by subcutaneous injection in the hind footpads with ∼0.1 × 10⁹ HEL or BSA microspheres emulsified in CFA in a 10-μl volume or with 30 μg native HEL protein emulsified in CFA.
Antibodies and Flow Cytometry.
The anti-CD11c (HL-3), anti-CD11b (M1.70), anti-Ly5.1 (A20), anti-CD8α (53.6.7), anti-B220 (RA36B2), and anti-CD4 (RM4–5) Ab were purchased from BD Biosciences. These antibodies were directly coupled to allophycocyanin, PE, FITC, or biotin, in which case staining was revealed using streptavidin-PE or streptavidin-allophycocyanin (BD Biosciences).
Immunostaining.
LNs were fixed overnight in medium containing 0.05 M phosphate buffer, 0.1 M l-lysine, pH 7.4, 2 mg/ml NaIO4, and 10 mg/ml paraformaldehyde, and then dehydrated in consecutive sucrose gradients (10, 20, and 30% in phosphate buffer). Tissues were snap frozen in Tissue-Tek® (Sakura Finetek). 8 μm frozen sections were stained with either FITC or allophycocyanin anti-B220 Ab (RA36B2), Alexa Fluor 488 phalloidin (Molecular Probes), unconjugated anti–peripheral LN addressin (PNAd) Ab (MECA-79), or anti-CD25 Ab (PC61) as previously described (18). PNAd and CD25 staining was revealed with an Alexa Fluor 647 goat anti–rat IgG (Molecular Probes). Immunofluorescence confocal microscopy was performed with Leica TCS 4D and Zeiss LSM 510 confocal microscopes. Separate images were collected for each fluorochrome and overlaid to obtain a multicolor image. LNs were scanned and the different images were juxtaposed to reconstitute a whole LN. Final image processing was performed using Adobe Photoshop. Quantitative analysis of T cell distribution into LN sections was performed using ImageJ software (National Institutes of Health). For each section the deep paracortex zone, excluding most HEVs, and the outer paracortex zone, including most HEVs, were defined manually. The number of cells present in each zone was then calculated by image processor. Alternatively, the distance between each individual DC or T cell and the most proximal HEV was determined as follows. The x and y coordinates of DCs, T cells, and HEVs were determined using ImageJ software. The minimal euclidean distance (Di) was calculated with the following equation: Di = minj {√[(xi−xj)2 + (yi−yj)2]}, where i = 1 … n (DC); j = 1 … n (HEV) and min is the minimum function. Distance intervals were defined and the percentage of cells within each interval were calculated.
Online Supplemental Material.
Figs. S1 and S2 are available at http://www.jem.org/cgi/content/full/jem.20030167/DC1. Fig. S1 shows T cell transit through the paracortical cord surrounding the HEV when accessing the paracortex. Fig. S2 shows homing of BM-derived DCs near HEVs in draining LNs.
Results
Initial T Cell Activation Takes Place Near HEVs.
To visualize the early phase of T cell activation in vivo, we used an adoptive transfer system in which CFSE-labeled TCR transgenic T cells (3A9) specific for 46–61 HEL peptide presented by I-Ak were injected into syngenic hosts. The fluorescent dye CFSE permits both imaging of T cells within the LN by confocal microscopy and examination of T cell division through FACS® analysis of CFSE dilution. The recipient mice were primed 24 h after adoptive transfer by subcutaneous injection of HEL protein emulsified in CFA. As expected, in naive mice or mice injected with CFA only, the 3A9 T cells scattered within the T cell areas of the LN (Fig. 1 a, A and C, and not depicted). Starting around 16 h and clearly evident by 24 h after injection, 3A9 T cells relocalized in the outer part of the paracortex, just beneath the B cell zone in Ag-draining LNs (Fig. 1 a, B). The pattern suggests a clustering, potentially around DCs in a restricted area of the paracortex. This restricted localization is transient, lasting for around 20 h, and then T cells distributed into the T cell zone (Fig. 1 a, D). At this time point most 3A9 T cells have divided several times as evidenced by CFSE dilution (Fig. 1 a, D, inset). To ensure that initial activation of the Ag-specific T cells occurs within the observed clusters, we analyzed CD25 expression by 3A9 T cells, a receptor that is induced rapidly and transiently after TCR engagement (19). As a control for the Ag specificity of the activation process we cotransferred 3A9 transgenic T cells and nontransgenic wild-type CD4 T cells. In addition, to synchronize T cell activation, mice were first immunized with HEL protein and then, 24 h later, adoptively transferred with CMTMR-labeled 3A9 and CFSE-labeled nontransgenic CD4 T cells. Expression of CD25 was analyzed by immunohistology 24 h after T cell transfer (Fig. 1 b). Some recipient LN cells, likely corresponding to the regulatory CD4+ CD25+ T cells and T cells specific for environmental pathogens, expressed CD25. Regardless of the immunization regiment, the nontransgenic CD4 T cells did not up-regulate CD25 expression. Likewise, in CFA-injected mice the 3A9 T cells remained CD25−. In contrast, in HEL-immunized mice most 3A9 T cells present in clusters expressed CD25 and showed increased size indicating that they were activated. Therefore, initial T cell activation does not take place randomly within the paracortex where most T cells scatter, but rather in the outer paracortex, in boundary areas between the B cell and T cell zone.
Figure 1.

Visualization of 3A9+ CD4+ T cell activation in situ. (a) CFSE-labeled 3A9+ CD4 T cells (green) were injected into recipient mice as described in Materials and Methods. 24 h later, mice were primed in the footpad with CFA (A–C) or CFA plus HEL (B–D). Draining popliteal LNs were harvested 24 or 48 h after immunization and analyzed by confocal microscopy. The B cell zones defined on sections as areas rich in B220+ cells appear in blue. Division of 3A9+ CD4 T cells was evaluated by FACS® analysis of CFSE dilution (inset in C and D). (b) Recipient mice were injected with CFA or CFA plus HEL 24 h before transfer of CMTMR-labeled 3A9 T cells (red) and CFSE-labeled nontransgenic T cells (blue). Draining LNs were harvested 24 h after T cell transfer and analyzed by confocal microscopy after staining with anti-CD25 Ab (green). 2 representative clusters of 3A9 T cells in sections of 2 different LNs, out of 14 analyzed, are shown for HEL-injected mice.
Structural analyses indicate that HEVs are primarily located near the B cell zone in the paracortex of LNs (20). To examine the possibility that clusters accumulated near HEVs we stained sections with an Ab specific for the PNAd that is selectively found on the luminal phase of HEVs (21). As anticipated, clusters of Ag-specific T cells were preferentially found near and around HEVs (Fig. 2 a, B). To substantiate our observation we quantified T cell localization in the LNs of immunized and unimmunized mice. We delineated two areas within the LN paracortex corresponding to the deep paracortex excluding most HEVs and the outer paracortex where most HEVs are found, and counted the number of T cells within each zone (Fig. 2 a). In CFA-injected mice, 3A9 T cells segregated equally within the two zones reflecting the rate of basal trafficking within the nodes (Fig. 2 b). In HEL-injected mice, 74.5 ± 6.4% (mean ± SD, n = 14) of the 3A9 T cells were found in the outer paracortex (Fig. 2 b). Therefore, the 3A9 T cells appear selectively trapped in the outer paracortex near HEVs, in Ag-draining LNs. This confinement suggests that clusters are not formed by the Ag-specific T cells already present in the deep paracortex that would relocalize near HEVs, but instead by incoming T cells that exit from the HEVs and accumulate around Ag-presenting DCs.
Figure 2.

Initial CD4+ T cell activation clusters localize near HEVs. (a) Mice were adoptively transferred with CMTMR-labeled 3A9+ CD4 T cells (red) and then primed 24 h later with CFA (A) or CFA plus HEL (B). Draining LNs were harvested 24 h after immunization. Sections were analyzed by confocal microscopy after staining with a B cell–specific (green) and an anti-PNAd Ab that specifically reacts with HEVs (blue). (b) The percentage of 3A9 T cells present within or outside the deep paracortex defined by the dashed line in (a) was counted as described in Materials and Methods. The mean percentage and SD of 9 and 14 individual LNs isolated from either CFA- or CFA/HEL-injected mice, respectively, is presented.
Initial Activation Clusters Are Constituted by DCs and T Cells.
To ensure that the clusters of 3A9 T cells observed in primed mice are indeed constituted by T cells and Ag-loaded DCs, we coupled the HEL protein or, as control, BSA directly to fluorescent microspheres. These 40-nm particles are too big to percolate freely into the LNs (22). Previous studies have shown that when injected subcutaneously, these microspheres are phagocytosed by skin-resident monocytes that differentiate into DCs and migrate toward draining LNs (23). Indeed, FACS® analysis of LN cells of injected mice showed that microsphere-positive cells expressed CD11c and thus belong to the DC lineage (Fig. 3 a). In addition, these microsphere-positive cells expressed CD11b but not B220 or CD8α (Fig. 3 a and not depicted). Confocal analysis of bead-positive cells indicated that beads accumulated within cells, suggesting that they had been phagocytosed and engulfed by CD11c+ DCs (not depicted and Fig. 3 c). Finally, the bead-positive cells detected in the LN paracortex of immunized mice expressed CD11c and thus belong to the DC lineage (Fig. 4 a, B).
Figure 3.
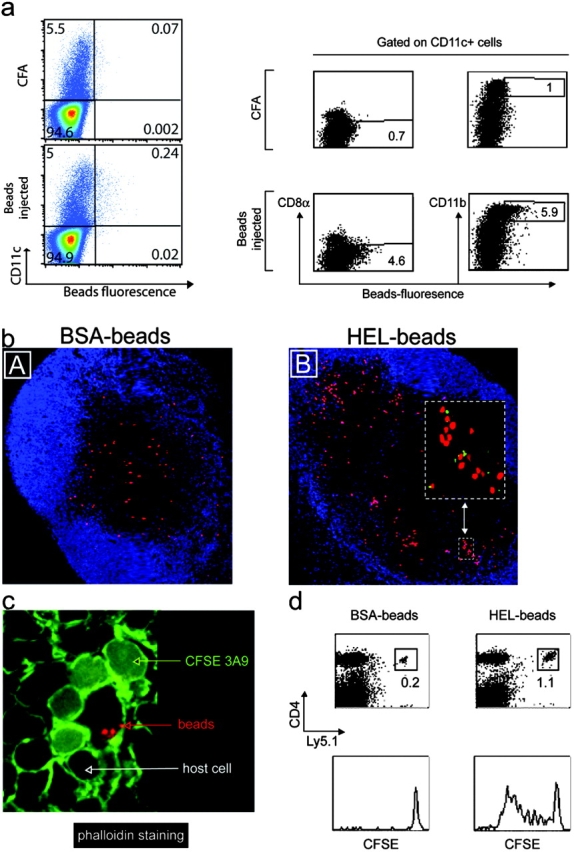
CD4+ T cells cluster around Ag-loaded DCs in the outer paracortex of draining LNs. (a) Mice were primed by subcutaneous injection of BSA-coupled fluorescent microspheres. Draining LNs from five mice were harvested 24 h later and the expression of CD11c, CD11b, and CD8α was examined by FACS® analysis of total LN cells or CD11c+ cells, as indicated. (b–d) Mice were adoptively transferred with dye-labeled 3A9 CD4 T cells and then primed 24 h later with BSA- or HEL-coupled fluorescent microspheres, as indicated. Draining LNs were harvested 24 h (b and c) or 3 d (d) after immunization. (b) Clustering of 3A9 T cells (red) with microsphere-positive cells (green) near the B cell area revealed by anti-B220 staining (blue) is shown. (c) Phalloidin staining highlights the tight interaction between 3A9 T cells (diffuse green staining) and bead-containing DCs (red dots). (d) FACS® analysis of CFSE profile of 3A9 T cells. One experiment out of two (a and c) or three (b and d) with similar results is presented.
Figure 4.
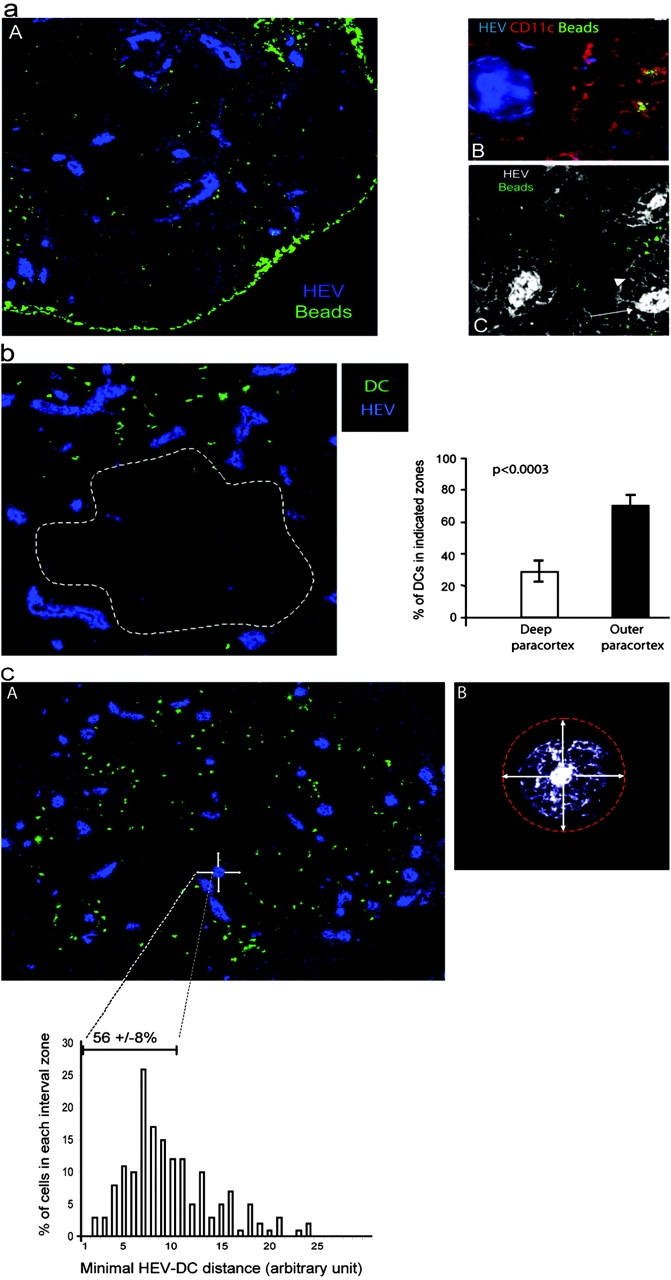
Ag-loaded DCs migrate preferentially near HEVs. (a) Mice were primed by subcutaneous injection of BSA-coupled fluorescent microspheres as in Fig. 3 a. Sections of draining LNs were stained with a PNAd-specific Ab (A and B, blue) and a CD11c-specific Ab (B, red), whereas beads appear in green. In C, sections were stained with the PNAd-specific Ab (white) and electronic sensitivity was increased to highlight the reticular network (arrowhead) that surrounds the HEV (arrow). ×160 in A and ×200 in B and C. One representative experiment out of three performed is shown. (b and c) BM-derived DCs were CMTMR labeled (green) and injected into the footpads of mice. LNs were collected 24 h later and sections were stained with a PNAd-specific Ab (blue). (b) The percentage of DCs present inside or outside the deep paracortex defined by the dashed line was calculated as indicated in Materials and Methods. The mean percentage and SD of 13 individual LNs is presented. (c) The distance between each DC and the most proximal HEV was calculated as described in Materials and Methods and the percentage of DCs within each distance interval was plotted (histogram). In addition, we defined a proximity perimeter around the HEV (A and B, arrows) with a radius of one and one half times the diameter of an HEV (A and B, refer to Results). The distance intervals included in this perimeter and the mean percentage ± SD of DCs within that perimeter are indicated on the histogram.
Next, we determined whether bead-containing DCs clustered with the 3A9 T cells. Therefore, mice were adoptively transferred with CMTMR-labeled 3A9 T cells (red) and immunized 24 h later with fluorescent microspheres coupled to HEL or BSA (green). Clustering of the 3A9 T cells was only found in mice immunized with HEL-coupled microspheres and in that case involved fluorescent beads (Fig. 3 b, inset). To ensure that 3A9 T cells interacted with bead-loaded DCs, we incubated the sections with fluorescent phalloidin that binds actin filaments resulting in a bright staining of the membrane of all cells within the LN. In this case the 3A9 T cells were CFSE labeled, giving a diffuse cytoplasmic green staining and the beads were red. Close examination of clusters showed that the 3A9 T cells as well as rare endogenous cells surrounded and interacted with bead-carrying DCs (Fig. 3 c). Finally, HEL-coupled microspheres were efficient 3A9 T cell activators (Fig. 3 d).
Collectively, these results suggest that after immunization, skin DCs migrate to the draining LN where they interact with and stimulate the Ag-specific T cells near HEVs. These observations further suggested that homing of tissue-derived DCs near HEVs may determine the site of T cell activation.
Tissue-derived DCs Home in the Vicinity of HEVs.
Because beads containing DCs interacted with and stimulated the 3A9 T cells, we used this experimental approach to analyze the localization of skin-derived DCs in immunized LN. We found that beads accumulated in the subcapsular sinus that drains the afferent lymph (Fig. 4 a, A). This bright staining likely corresponds to bead aggregates as observed when soluble protein is injected subcutaneously (24). In the paracortex, fluorescent beads were found in the proximity of HEVs where initial activation clusters are located (Fig. 4 a, A). In this case, bead-positive cells expressed CD11c and thus likely correspond to the DCs identified by FACS® analysis (Fig. 4 a, B).
Structural analysis have shown that HEVs are surrounded by a network of fibroblastic reticular cells that wind around the HEVs forming the paracortical cord (9). We found that this reticular network is weakly stained with the PNAd-specific Ab (Fig 4 a, C). It is unclear whether staining results from stickiness of the fibroblastic reticular cells that invest the reticular fibers or very low levels of expression of PNAd by these fibers. Nonetheless, this reactivity reveals the reticular network surrounding the HEV allowing for a more detailed examination of T cell and DC positioning. Previous studies have shown that immigrant cells transit through the cord before getting access to the cavities that constitute most of the paracortex (9, 25). In agreement, T cells were found within the paracortical cords and in the cavities (see Fig. S1, available at http://www.jem.org/cgi/content/full/jem.20030167/DC1). In contrast, bead-loaded DCs were generally excluded from the cord and primarily found in the cavities (Fig. 4 a, C). However, some DCs appear to come into very close contact, lining along the cortical side of the cord (Fig. 4 a, C). Thus, DCs appeared to home in the very near proximity of HEVs at sites T cells might take to gain access to the paracortex.
In this experimental set up, quantitative analysis of DC localization and DC–T cell interactions is complicated by the fact that only cells that have engulfed several beads are detected at the low magnification used to visualize an entire LN. In addition, many beads containing DCs might be missed because beads accumulated in a confined area of the DC and are thus quite often out of the section plan (Fig. 3 c). To have a more accurate measurement of the process we analyzed the placement, within LNs, of in vitro–differentiated DCs when injected into the footpad of recipient mice. At 6 h after footpad injection, CMTMR-labeled DCs are primarily found in or just beneath the subcapsular sinus indicating that they access draining LNs by the afferent lymphatics (see Fig. S2, available at http://www.jem.org/cgi/content/full/jem.20030167/DC1). Then, the DCs migrate into the LN paracortex where they reside for up to 48 h (Fig. 4 b and Fig. S2, available at http://www.jem.org/cgi/content/full/jem.20030167/DC1). The injected DCs did not distribute randomly into the T cell zone but preferentially homed in the outer paracortex of the draining LN (Fig. 4 b). Indeed, 77 ± 7% (mean ± SD, n = 13) of the LN-homing DCs concentrated in the outer paracortex of draining LNs. Importantly, most DCs were still found at this location 48 h after transfer, indicating that they did not simply pass there on their way to the deep paracortex (Fig. S2, available at http://www.jem.org/cgi/content/full/jem.20030167/DC1). We wished to determine the proportion of injected DCs that may come into close proximity of the HEV cord. Therefore, we evaluated by computer analysis the distance between each DC and the most proximal HEV (Fig. 4 c). Because the cord was not always clearly visible we defined a proximity perimeter around the HEVs. On average, the cord has a radius equal to the diameter of the HEV it surrounds. Thus, we defined a perimeter around the HEV corresponding to one and one half times the diameter of the HEV (Fig. 4 c, B). Because DCs did not enter the paracortical cord (Fig. 4 a, C), this perimeter around the HEV appeared as a rational estimate of the HEV most proximal area. We found that 55.8 ± 8.3% (mean ± SD, n = 5) of the injected DCs located in that narrow perimeter, confirming our previous observations. This result is quite remarkable since DCs migrate into the node through the afferent lymph and not through the HEVs (Fig. S2, available at http://www.jem.org/cgi/content/full/jem.20030167/DC1).
Next, we determined whether in this case too, DCs' placement conditioned DC–T cell clustering in the outer paracortex. For this experiment, HEL-loaded or, as control, PCC-loaded DCs were injected into recipient mice 6 h before transfer of 3A9 T cells. The mice were killed 18 h after T cell transfer and the localization of DC–T cell clusters was analyzed by confocal microscopy. As expected, HEL-loaded but not PCC-loaded DCs formed numerous clusters with 3A9 T cells (Fig. 5) . Most DC–T cell clusters were found in the outer paracortex thus matching DCs' localization. Indeed, 83 ± 8% (n = 8) of the clusters involving labeled DCs and 3A9 T cells were confined to the outer paracortex in the proximity of HEV (Fig. 5, B). Collectively, these data indicate that cluster formation in the outer paracortex is determined by DCs' placement in the proximity of HEVs.
Figure 5.

DCs' placement near HEVs determine the localization of activation cluster. BM-derived DCs were pulsed with PCC or HEL peptide, labeled with CMTMR (green), and then injected into the footpads of recipient mice. 6 h later, CFSE-labeled 3A9 T cells (red) were adoptively transferred and draining LNs were collected 18 h after T cell transfer. The percentage of DC–T cell clusters in the deep or outer paracortex of mice injected with HEL-loaded DCs was measured as in Fig. 4 b. The mean percentage and SD of eight individual LNs is presented.
The DCs Located Near HEVs Scan Incoming T Cells.
We wished to further determine whether DCs scan all incoming T cells and selectively trap T cells expressing a T cell receptor specific for the peptide–MHC complexes they present. Therefore, we analyzed concomitantly the traffic of nonspecific and specific T cells. Thus, recipient mice were preimmunized 24 h before adoptive transfer of CFSE-labeled 3A9 T cells (green) and CMTMR-labeled nontransgenic (W) CD4 T cells (red). Preliminary experiments had shown that Ag-loaded DCs reach the LN by 8–18 h after immunization (Fig. S2, available at http://www.jem.org/cgi/content/full/jem.20030167/DC1, not depicted, and reference 24). Under these conditions, Ag-loaded DCs would have homed appropriately within the LN and recruitment of Ag-specific T cells within the activation clusters could be examined by kinetic studies (Fig. 6 a). 10 min after transfer, both 3A9 and wild-type CD4 T cells were detected within the HEVs of immunized mice. By 1 h after transfer, both CD4 T cell populations had crossed the endothelial barrier, remaining near HEVs in the paracortical zone. While the wild-type CD4 T cells continued their journey toward the deep paracortex, which they reached by 6 h after transfer, the 3A9 T cells remained and appeared to cluster in the outer paracortex near HEVs. Clustering of 3A9 T cells was already visible 1 h after transfer and clearly evident 6 and 24 h after transfer. As expected, migration of the two populations was comparable when mice were injected with CFA only (Fig. 6 a). Importantly, at 1 and 6 h after transfer, some wild-type T cells were found within forming clusters of Ag-specific 3A9 T cells (Fig. 6 a, inset). Colocalization of the two T cell populations suggests that all incoming T cells pass near DCs in sufficient proximity to allow TCR–MHC interaction. T cells expressing a TCR specific for the MHC–peptide complexes presented by the DCs will arrest and establish firm contact with the DCs. In contrast, nonspecific T cells will not arrest and continue their journey into the deep paracortex. Scanning of DCs by incoming T cells was also suggested in the previous experiments where few 3A9 T cells were found to colocalize with PCC-loaded DCs (Fig. 5) and by recent two photon analysis of DC–T cell interaction in vivo (13). This kinetics study combined with quantitative analysis of T cell sojourn in the outer paracortex indicated that in the absence of Ag, T cells accessed to the deep paracortex within <6 h (Fig. 6 b). At this time point, ingress and egress seemed to reach some equilibrium so that the distribution of wild-type CD4 T cells into the outer and deep paracortex was comparable (Fig. 6 b). In contrast, 82.3 and 76.15% of the 3A9 T cells found in the draining LN were still present in the outer paracortex at 6 and 24 h after HEL immunization, respectively (Fig. 6 b). Retention of the 3A9 T cells in the proximity of HEV in the outer paracortex was further confirmed by statistical analysis of the distance distribution of 3A9 T cells or wild-type T cells with the most proximal HEV (Fig. 6 c). Thus, 3A9 T cells were preferentially found in the HEV most proximal area where DCs concentrate whereas wild-type T cells have a more dispersed distribution, away from HEVs.
Figure 6.
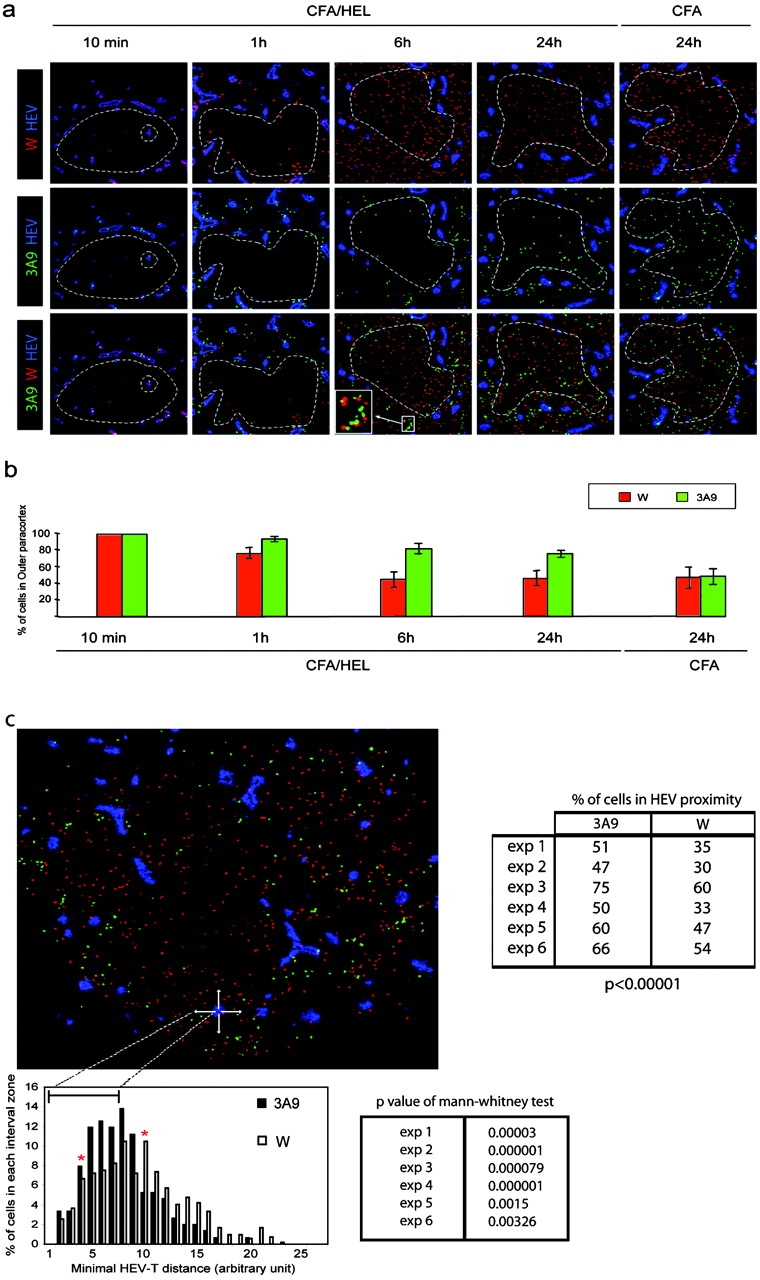
DCs scan incoming CD4 T cells nearby HEVs. (a) CFSE-labeled 3A9 CD4 T cells (3A9, green) and CMTMR-labeled nontransgenic CD4+ T cells (W, red) were coinjected into recipient mice immunized 24 h earlier with CFA or CFA/HEL, as indicated. Draining LNs were harvested at the indicated time points after adoptive transfer and analyzed by confocal microscopy after staining with a PNAd-specific Ab (blue). (b) The percentage of 3A9 CD4 T cells present in the outer paracortex (outside dashed circle) was calculated as described in Materials and Methods. The mean values and SD of four (CFA) and at least eight (CFA/HEL) different nodes analyzed in one representative experiment out of three performed are shown. (c) The minimal distance between 3A9 (solid bars) or wild-type (open bars) and the most proximal HEV was calculated as in Fig. 4 c and is presented in the histogram. Red stars delineate the boundaries of two distinct areas. In the first area, most proximal to the HEV (intervals 4–9), the 3A9 T cells are more frequent than the wild-type CD4 T cells. In the second area (intervals 10–27), more distant from the HEV, the wild-type CD4 T cells are more frequent than the 3A9 T cells. The distribution of 3A9 and wild-type CD4 T cells are significantly different based on a Mann and Whitney test of results obtained with six distinct LNs. The percentage of 3A9 or wild-type T cells within the proximity perimeter of an HEV was calculated as in Fig. 4 c and is presented for the six individual LNs analyzed.
Collectively, these results indicate that tissue-derived DCs localize near the HEVs where as gatekeepers they scan incoming T cells and selectively retain and stimulate Ag-specific T cells. We further show that the placement of DCs near HEVs allows for an efficient recruitment of Ag-specific T cells into activation clusters.
Discussion
In this study, we examined the strategy the immune system may have developed to foster T cell–APC interactions at the initiation of an immune response. We show that initial T cell activation by Ag-presenting DCs is confined to a restricted area of the paracortex, in the proximity of HEVs. We further show that DCs, migrating from the site of immunization, preferentially home in the vicinity of HEVs and may therefore determine the site of T cell activation.
Positioning of DCs next to HEVs permits efficient encounter between T cells and DCs. Indeed we found that most Ag-specific T cells passing the HEV are selectively trapped by the relevant DCs. This later observation might be explained by a very organized routing of T cells into the LN. Thus, as suggested by Gretz et al. (9), T cells, when leaving the HEVs, may enter into corridors that direct them through the paracotical cord. These corridors may then connect to the cavities constituting the paracortex at sites where DCs would preferentially home. In agreement, we show that DCs preferentially locate in the cavity lining along the paracortical cord. Recent two photon microscopy and confocal analysis of T cell trafficking into intact node suggest, however, that T cells move randomly when leaving the HEVs thus dismissing an organized routing of T cells through corridors (10–13). Such random motion also suggests that chemokines are not directing basal T cell movement (12). It still remains possible, however, that chemokines may do so when expressed locally by DCs in immunized LNs. Mature DCs express CCL19 and CCL21 and may therefore attract CCR7 expressing incoming naive and memory T cells (5). Dynamic imaging of T cell trafficking through HEVs under conditions where DCs are deficient for these chemokines should help clarify these issues.
A critical question raised by this model is how DCs decide where to go within the LN. Preferential localization of DCs in the outer paracortex likely relies on migration and subsequent arrest of the DCs in these restricted areas of the LN. Directional migration of the DCs might be imposed in part by LN organization. After maturation, tissue DCs loose expression of tissue homing receptor and acquire CCR7 expression, two events that are instrumental for DC migration to regional LNs (5–8). CCL19 and CCL21 are the two known CCR7 ligands. Interestingly, expression of these chemokines is confined to stromal cells mainly residing in the outer cortex (7, 26). Expression of these chemokines might therefore target DCs to specific location and contribute in part to DC arrest, though firm arrest likely involves additional signals such as carbohydrate interaction with the collagen fibers of the reticular network. In organized inflammatory infiltrates, blood-borne DCs also take a perivascular localization further suggesting that DCs' placement is tightly regulated (27–29). Interestingly, in this case too, the DCs proximal to HEVs formed clusters with T cells.
We showed that placement of DCs near HEVs allows for efficient recruitment of Ag-specific T cells into activation clusters. Although we have no experimental evidence to support it, it is tempting to speculate that such placement optimizes T cell responses. Indeed, the probability of encounter of two rare cell types, the relevant DCs and the Ag-specific T cells, is likely higher when the “searching area” is limited. This would be the case when DCs are confined around HEVs and not when they are dispersed in the entire paracortex densely packed with irrelevant T cells. Such encounter might also be improved because the DCs' chemokine gradient would be higher in proximity of HEVs and thus more efficient at directing T cell movement. In addition, placement of DCs near HEVs likely also reduces the “searching period.” Although T cell velocity within LNs is high, in the range of 11 μm min−1, scrutinizing the entire paracortex would be time consuming and therefore might be detrimental for the host immune response (10–13). Several studies have shown that T cell entry within inflamed LNs is augmented (30, 31, and unpublished data). As a consequence, Ag-specific T cells access the LN draining the infection site more efficiently, thus increasing the likelihood that rare Ag-specific T cells that are dispersed throughout the body encounter DCs presenting the Ag of interest. Therefore, we would propose that increased influx of T cells into the LNs combined with a strategic location of DCs at the entry doors of T cells within LNs might be two critical mechanisms that the immune system has developed to force relevant T cells and DCs to meet.
Acknowledgments
We thank L. Leserman, B. Malissen, and A.-M. Schmitt-Verhulst for critical reading of the manuscript.
This work was supported by institutional grants to S. Guerder from INSERM and CNRS and by grants from Agence Nationale de Recherche sur le Sida. M. Bajénoff was supported by a fellowship from the Ligue Nationale Contre le Cancer and the Association pour la Recherche sur le Cancer.
Abbreviations used in this paper: CFSE, 5-(and-6)-carboxyfluorescein diacetate succinimidyl ester; CMTMR, orange fluorescent tetramethylrhodamine; HEL, hen egg lysozyme; HEV, high endothelial venule; PCC, pigeon cytochrome c; PNAd, peripheral LN addressin.
The online version of this article contains supplemental material.
References
- 1.Young, A.J. 1999. The physiology of lymphocyte migration through the single lymph node in vivo. Semin. Immunol. 11:73–83. [DOI] [PubMed] [Google Scholar]
- 2.Banchereau, J., and R.M. Steinman. 1998. Dendritic cells and the control of immunity. Nature. 392:245–252. [DOI] [PubMed] [Google Scholar]
- 3.Sallusto, F., and A. Lanzavecchia. 2000. Understanding dendritic cell and T-lymphocyte traffic through the analysis of chemokine receptor expression. Immunol. Rev. 177:134–140. [DOI] [PubMed] [Google Scholar]
- 4.Mellman, I., and R.M. Steinman. 2001. Dendritic cells: specialized and regulated antigen processing machines. Cell. 106:255–258. [DOI] [PubMed] [Google Scholar]
- 5.Sallusto, F., B. Palermo, D. Lenig, M. Miettinen, S. Matikainen, I. Julkunen, R. Forster, R. Burgstahler, M. Lipp, and A. Lanzavecchia. 1999. Distinct patterns and kinetics of chemokine production regulate dendritic cell function. Eur. J. Immunol. 29:1617–1625. [DOI] [PubMed] [Google Scholar]
- 6.Saeki, H., A.M. Moore, M.J. Brown, and S.T. Hwang. 1999. Cutting edge: secondary lymphoid-tissue chemokine (SLC) and CC chemokine receptor 7 (CCR7) participate in the emigration pathway of mature dendritic cells from the skin to regional lymph nodes. J. Immunol. 162:2472–2475. [PubMed] [Google Scholar]
- 7.Dieu, M.C., B. Vanbervliet, A. Vicari, J.M. Bridon, E. Oldham, S. Ait-Yahia, F. Briere, A. Zlotnik, S. Lebecque, and C. Caux. 1998. Selective recruitment of immature and mature dendritic cells by distinct chemokines expressed in different anatomic sites. J. Exp. Med. 188:373–386. [DOI] [PMC free article] [PubMed] [Google Scholar]
- 8.Gunn, M.D., S. Kyuwa, C. Tam, T. Kakiuchi, A. Matsuzawa, L.T. Williams, and H. Nakano. 1999. Mice lacking expression of secondary lymphoid organ chemokine have defects in lymphocyte homing and dendritic cell localization. J. Exp. Med. 189:451–460. [DOI] [PMC free article] [PubMed] [Google Scholar]
- 9.Gretz, J.E., A.O. Anderson, and S. Shaw. 1997. Cords, channels, corridors and conduits: critical architectural elements facilitating cell interactions in the lymph node cortex. Immunol. Rev. 156:11–24. [DOI] [PubMed] [Google Scholar]
- 10.Miller, M.J., S.H. Wei, I. Parker, and M.D. Cahalan. 2002. Two-photon imaging of lymphocyte motility and antigen response in intact lymph node. Science. 296:1869–1873. [DOI] [PubMed] [Google Scholar]
- 11.Stoll, S., J. Delon, T.M. Brotz, and R.N. Germain. 2002. Dynamic imaging of T cell-dendritic cell interactions in lymph nodes. Science. 296:1873–1876. [DOI] [PubMed] [Google Scholar]
- 12.Miller, M.J., S.H. Wei, M.D. Cahalan, and I. Parker. 2003. Autonomous T cell trafficking examined in vivo with intravital two-photon microscopy. Proc. Natl. Acad. Sci. USA. 100:2604–2609. [DOI] [PMC free article] [PubMed] [Google Scholar]
- 13.Bousso, P., and E. Robey. 2003. Dynamics of CD8(+) T cell priming by dendritic cells in intact lymph nodes. Nat. Immunol. 4:579–585. [DOI] [PubMed] [Google Scholar]
- 14.Ho, W., M. Cooke, C. Goodnow, and M. Davis. 1994. Resting and anergic B cells are defective in CD28-dependent costimulation of naive CD4+ T cells. J. Exp. Med. 179:1539–1549. [DOI] [PMC free article] [PubMed] [Google Scholar]
- 15.Bajenoff, M., O. Wurtz, and S. Guerder. 2002. Repeated antigen exposure is necessary for the differentiation, but not the initial proliferation, of naive CD4(+) T cells. J. Immunol. 168:1723–1729. [DOI] [PubMed] [Google Scholar]
- 16.Inaba, K., M. Inaba, N. Romani, H. Aya, M. Deguchi, S. Ikehara, S. Muramatsu, and R.M. Steinman. 1992. Generation of large numbers of dendritic cells from mouse bone marrow cultures supplemented with granulocyte/macrophage colony-stimulating factor. J. Exp. Med. 176:1693–1702. [DOI] [PMC free article] [PubMed] [Google Scholar]
- 17.Winzler, C., P. Rovere, M. Rescigno, F. Granucci, G. Penna, L. Adorini, V.S. Zimmermann, J. Davoust, and P. Ricciardi-Castagnoli. 1997. Maturation stages of mouse dendritic cells in growth factor–dependent long-term cultures. J. Exp. Med. 185:317–328. [DOI] [PMC free article] [PubMed] [Google Scholar]
- 18.Guerder, S., J. Meyerhoff, and R. Flavell. 1994. The role of the T cell costimulator B7-1 in autoimmunity and the induction and maintenance of tolerance to peripheral antigen. Immunity. 1:155–166. [DOI] [PubMed] [Google Scholar]
- 19.Cotner, T., J.M. Williams, L. Christenson, H.M. Shapiro, T.B. Strom, and J. Strominger. 1983. Simultaneous flow cytometric analysis of human T cell activation antigen expression and DNA content. J. Exp. Med. 157:461–472. [DOI] [PMC free article] [PubMed] [Google Scholar]
- 20.Hendriks, H.R., A.M. Duijvestijn, and G. Kraal. 1987. Rapid decrease in lymphocyte adherence to high endothelial venules in lymph nodes deprived of afferent lymphatic vessels. Eur. J. Immunol. 17:1691–1695. [DOI] [PubMed] [Google Scholar]
- 21.Streeter, P.R., B.T. Rouse, and E.C. Butcher. 1988. Immunohistologic and functional characterization of a vascular addressin involved in lymphocyte homing into peripheral lymph nodes. J. Cell Biol. 107:1853–1862. [DOI] [PMC free article] [PubMed] [Google Scholar]
- 22.Gretz, J.E., C.C. Norbury, A.O. Anderson, A.E. Proudfoot, and S. Shaw. 2000. Lymph-borne chemokines and other low molecular weight molecules reach high endothelial venules via specialized conduits while a functional barrier limits access to the lymphocyte microenvironments in lymph node cortex. J. Exp. Med. 192:1425–1440. [DOI] [PMC free article] [PubMed] [Google Scholar]
- 23.Randolph, G.J., K. Inaba, D.F. Robbiani, R.M. Steinman, and W.A. Muller. 1999. Differentiation of phagocytic monocytes into lymph node dendritic cells in vivo. Immunity. 11:753–761. [DOI] [PubMed] [Google Scholar]
- 24.Ingulli, E., D.R. Ulman, M.M. Lucido, and M.K. Jenkins. 2002. In situ analysis reveals physical interactions between CD11b+ dendritic cells and antigen-specific CD4 T cells after subcutaneous injection of antigen. J. Immunol. 169:2247–2252. [DOI] [PubMed] [Google Scholar]
- 25.Gretz, J.E., E.P. Kaldjian, A.O. Anderson, and S. Shaw. 1996. Sophisticated strategies for information encounter in the lymph node: the reticular network as a conduit of soluble information and a highway for cell traffic. J. Immunol. 157:495–499. [PubMed] [Google Scholar]
- 26.Luther, S.A., H.L. Tang, P.L. Hyman, A.G. Farr, and J.G. Cyster. 2000. Coexpression of the chemokines ELC and SLC by T zone stromal cells and deletion of the ELC gene in the plt/plt mouse. Proc. Natl. Acad. Sci. USA. 97:12694–12699. [DOI] [PMC free article] [PubMed] [Google Scholar]
- 27.van Dinther-Janssen, A.C., S.T. Pals, R. Scheper, F. Breedveld, and C.J. Meijer. 1990. Dendritic cells and high endothelial venules in the rheumatoid synovial membrane. J. Rheumatol. 17:11–17. [PubMed] [Google Scholar]
- 28.Lo, D., C.R. Reilly, B. Scott, R. Liblau, H.O. McDevitt, and L.C. Burkly. 1993. Antigen-presenting cells in adoptively transferred and spontaneous autoimmune diabetes. Eur. J. Immunol. 23:1693–1698. [DOI] [PubMed] [Google Scholar]
- 29.Kabel, P.J., H.A. Voorbij, M. De Haan, R.D. van der Gaag, and H.A. Drexhage. 1988. Intrathyroidal dendritic cells. J. Clin. Endocrinol. Metab. 66:199–207. [DOI] [PubMed] [Google Scholar]
- 30.Cahill, R.N., H. Frost, and Z. Trnka. 1976. The effects of antigen on the migration of recirculating lymphocytes through single lymph nodes. J. Exp. Med. 143:870–888. [DOI] [PMC free article] [PubMed] [Google Scholar]
- 31.Larsen, C.G., A.O. Anderson, E. Appella, J.J. Oppenheim, and K. Matsushima. 1989. The neutrophil-activating protein (NAP-1) is also chemotactic for T lymphocytes. Science. 243:1464–1466. [DOI] [PubMed] [Google Scholar]