CCR5 Levels and Expression Pattern Correlate with Infectability by Macrophage-tropic HIV-1, In Vitro (original) (raw)
Abstract
Chemokine receptors serve as coreceptors for HIV entry into CD4+ cells. Their expression is thought to determine the tropism of viral strains for different cell types, and also to influence susceptibility to infection and rates of disease progression. Of the chemokine receptors, CCR5 is the most important for viral transmission, since CCR5 is the principal receptor for primary, macrophage-tropic viruses, and individuals homozygous for a defective CCR5 allele (Δ32/ Δ32) are highly resistant to infection with HIV-1. In this study, CCR5-specific mAbs were generated using transfectants expressing high levels of CCR5. The specificity of these mAbs was confirmed using a broad panel of chemokine receptor transfectants, and by their non-reactivity with T cells from Δ32/Δ32 individuals. CCR5 showed a distinct pattern of expression, being abundant on long-term activated, IL-2–stimulated T cells, on a subset of effector/memory T cells in blood, and on tissue macrophages. A comparison of normal and CCR5 Δ32 heterozygotes revealed markedly reduced expression of CCR5 on T cells from the heterozygotes. There was considerable individual to individual variability in the expression of CCR5 on blood T cells, that related to factors other than CCR5 genotype. Low expression of CCR5 correlated with the reduced infectability of T cells with macrophage-tropic HIV-1, in vitro. Anti-CCR5 mAbs inhibited the infection of PBMC by macrophage-tropic HIV-1 in vitro, but did not inhibit infection by T cell–tropic virus. Anti-CCR5 mAbs were poor inhibitors of chemokine binding, indicating that HIV-1 and ligands bind to separate, but overlapping regions of CCR5. These results illustrate many of the important biological features of CCR5, and demonstrate the feasibility of blocking macrophage-tropic HIV-1 entry into cells with an anti-CCR5 reagent.
Chemokine receptors are 7 transmembrane spanning G protein–coupled receptors (7TMR)1 that mediate a variety of functions on leukocytes, particularly cell migration (1–4). Chemokine signaling through these receptors is important for the positioning of cells within a tissue, and possibly also for integrin activation during the multi-step process of leukocyte extravasation (5, 6). This notion stems from the ability of pertussis toxin, an inhibitor of Gαi activity, or anti-chemokine mAbs, to inhibit leukocyte migration in a variety of inflammatory settings (7–9). Mice deficient in certain chemokines or chemokine receptors also show impaired inflammatory responses (10, 11). Recently, chemokine receptors have attracted considerable attention for their role as coreceptors for HIV-1 entry into cells. Therefore the expression of these receptors regulates not only leukocyte migration through tissues, but also the infection of cells by different strains of HIV-1.
Chemokine receptors are expressed differentially on leukocyte subsets, which accounts for chemotactic patterns in vitro, and presumably selective migration of some leukocyte types in vivo. CCR3, the eotaxin receptor, is expressed mostly by eosinophils which may account in part for the selective accumulation of eosinophils at certain inflammatory sites (12–14). The IL-8 receptors also show a selective expression on neutrophils, and anti–IL-8 therapy in various animal models inhibits neutrophil migration and associated tissue injury (15–17). Little is known about chemokine receptor expression on T cells, although T cells respond to RANTES, MIP-1α, MIP-1β, and macrophage chemoattractant protein (MCP)-1, MCP-2, and MCP-3 (18–22), suggesting the involvement of CCR1, CCR2, CCR4, or CCR5. T cells also respond to the CXC chemokine SDF-1, which binds CXCR4 (23–25), and IP-10 and Mig, which bind CXCR3 (26, 27). Determining the expression pattern of chemokine receptors on T cells at various stages of differentiation or activation is important for understanding T cell migration, particularly subset migration to inflammatory lesions.
The first indication that chemokine receptors might function as coreceptors for HIV-1 entry came from observations that RANTES, MIP-1α, and MIP-1β suppressed infection of susceptible cells in vitro by macrophage-tropic primary HIV-1 isolates (28). The chemokine receptor CXCR4 was found to support infection and cell fusion of CD4+ cells by laboratory-adapted, T-tropic HIV-1 strains (29). CCR5, a RANTES, MIP-1α, and MIP-1β receptor, was subsequently identified by five separate groups as the principal coreceptor for primary macrophage-tropic strains (30–34). CCR3 and CCR2b were also identified as other coreceptors that supported infection by some strains of HIV-1 (30, 32), although to date, all known macrophagetropic strains use CCR5 as a coreceptor.
The importance of CCR5 for HIV-1 transmission was underscored by the observation that certain individuals who had been repeatedly exposed to HIV-1 but remained uninfected had a defect in CCR5 expression (35–38). CD4+ T cells from these individuals were highly resistant in vitro to the entry of primary macrophage-tropic HIV but were readily infectable with viruses adapted to grow in transformed T cell lines (35, 39). These non-infectable individuals were found to be homozygous for a defective CCR5 allele that contains an internal 32–base pair deletion (CCR5 Δ32). The truncated protein encoded by this gene is apparently not expressed at the cell surface. CCR5 Δ32 homozygous individuals comprise ∼1% of the Caucasian population, and heterozygous individuals comprise ∼20% (35–38). In studies of >2,700 HIV-1–infected individuals, no Δ32 homozygotes were found, indicating the profound effect of this genotype on resistance to acquisition of HIV-1 (35–38). Individuals who are heterozygous for the Δ32 CCR5 allele have been shown to progress more slowly to AIDS than wild-type homozygous individuals (36–38), suggesting that CCR5 expression may be altered in these individuals, and that this affects HIV-1 replication in vivo.
The identity of CCR5 as the principal coreceptor for primary HIV-1 isolates allows a new understanding of viral tropism, disease pathogenesis, and disease susceptibility. CCR5 is also a promising new target for blocking HIV-1 entry into cells. Towards this end, we have developed mAbs to CCR5. These mAbs were used to identify important features on the biology of CCR5. First, CCR5 is expressed by a distinct subset of T cells, the CD26hi effector/ memory subset, as well as by macrophages. Second, individuals heterozygous for the CCR5 Δ32 allele expressed markedly reduced levels of CCR5 on the surface of their T cells. Third, there was considerable variation in expression of CCR5 from individual to individual within the +/+ population, and levels of expression correlated with susceptibility of cells to infection in vitro. Finally, an anti-CCR5 mAb was able to block, in vitro, macrophage-tropic HIV-1 infection of PBMC, demonstrating the feasibility of mAb inhibition of this receptor.
Materials and Methods
Study Subjects.
All protocols involving the use of human material were reviewed and approved by a human studies committee. Venous blood was collected from volunteer donors and PBMC were isolated by ficoll-hypaque density gradient centrifugation. The PBMC were used to determine CCR5 genotype, CCR5 surface expression, and infectivity of HIV-1.
Cells and Cell Lines.
PBMCs were isolated as described (12). To generate CD3 blasts, 2 × 10⁶ PBMC/ml in RPMI-1640 plus 10% FCS were added to tissue culture plates first coated with the anti-CD3 antibody TR77. After 4–6 d, blasts were removed to fresh media and supplemented with recombinant human interleukin 2 (rhIL-2; Hoffmann-LaRoche, Nutley, NJ) at 100 U/ml. Other cell lines used included transfectants of the L1.2 murine pre B cell lymphoma, expressing high levels of CCR3 (13), CXCR1 and CXCR2 (40), CXCR3, CXCR4, CCR2b, CCR4, CCR5 (41), and CCR1 (42) (kindly provided by Dr. Eugene Butcher, Stanford University, Stanford, CA). For most receptors, L1.2 transfectants were also generated with the octapeptide Flag epitope, which allowed detection (in most cases) with anti-Flag mAb. Transfectants were maintained in RPMI-1640 supplemented with 10% bovine serum and 800 μg/ml G418, except for certain transfectants of CCR5 (see below). The different transfectants were monitored for expression of the relevant receptors, using mAbs specific for CCR3, CCR2, CXCR1, CXCR2, CXCR3, CXCR4 (14, 18), and in some cases anti-Flag mAb M2 (Kodak Scientific Imaging Systems, Rochester, NY). For CCR5, expression was also monitored by ligand binding and Scatchard analysis. Other cell lines, such as the T cell and myelomonocytic cell lines, were obtained from the American Type Culture Collection (Rockville, MD).
In Vitro Infection of HIV-1.
Subjects were chosen based upon CCR5 genotype. Two homozygous +/+ individuals (pts 1 and 2), four +/Δ32 heterozygotes (patients 3, 4, 5, and 6), and two Δ32 homozygotes (patients 7 and 8, previously called EU3 and EU2, respectively (34, 35, 39), were chosen for in vitro infection studies. Isolated PBMC were stimulated with phytohemagglutinin (PHA-P, 5 μg/ml) or anti-CD3 (14) and carried in culture medium (RPMI 1640 supplemented with 10% heat-inactivated fetal bovine serum). IL-2 was added at 100 U/ml after 3 d. On the days indicated, CD4+ T cells were enriched by removal of CD8+ cells using anti-CD8 immunomagnetic beads (Dynal, Great Neck, NY). Isolates of HIV-1 were added to 2 × 10⁵ activated CD4+ lymphocytes at an inoculum of 600 TCID50 as previously determined by end-point dilution on random donor activated PBMC (multiplicity of infection [MOI] = 0.003). Viruses included the macrophage-tropic isolate JR-CSF (43) and the T cell lineadapted variant of SF162 called R3H (44). Infected cultures were carried for 11 d with feeding and p24 sampling on days 4, 7, and 11. HIV p24 production was determined by commercial ELISA (Abbott Laboratories, Abbott Park, IL). In some experiments, antiCCR5 antibody or recombinant chemokines RANTES, MIP-1α, and MIP-1β were added to the wells at the time of infection.
Construction of CCR5 Stable Transfectants.
CCR5 cDNA was obtained by PCR using a 5′-oligonucleotide primer and 3′-oligonucleotide primer that contained flanking XhoI and XbaI sites, respectively. For one set of transfectants, the 5′-primer also contained a Flag epitope (Asp.Tyr.Lys.Asp.Asp.Asp.Asp.Lys). The PCR fragment was subcloned into the XhoI-XbaI sites of pCDNA3 (Invitrogen) and this construct was designated CCR5/pCDNA3. Another expression vector, CCR5/pMRB101, was also constructed in which the CCR5 cDNA was subcloned into the HindIII– XbaI sites of pMRB101 (kindly provided by Martin Robinson). PCR fragments were sequenced to ascertain the sequence fidelity. In both of these expression vectors, the inserted gene was driven by a CMV promoter. The DNA was stably transfected into a murine pre-B lymphoma cell line (L1.2) as described (13, 41), except for the CCR5/pMRB101 construct, where mycophenolic acid-selective medium was used to select for transfectants. The cell surface expression of CCR5 was monitored by ligand binding and Scatchard analysis. For mAb production, the cell line transfected with CCR5/pMRB101, treated with 5 mM butyric acid for 16–18 h, was used exclusively for immunizing mice.
PCR Analysis of Genomic DNA.
Genomic DNA was isolated from PBMC of selected blood donors using Trizol reagent according to the manufacturer's instruction (GIBCO BRL). Upstream and downstream oligonucleotide primers for amplifying the CCR5 gene correspond to the second extracellular region of CCR5, and their sequences were as follows: 5′-primer: GAAGTTCCTCATTACACCTGCAGCTCTC; 3′-Primer: CTTCTTCTCATTTCGACACCGAAGCAGAG. Using this set of primers, the wild-type CCR5 allele will give rise to a PCR fragment of 174 bp, whereas the deleted allele will be 142 bp. For each PCR reaction (100 μl volume), 1 μg genomic DNA was first denatured at 95°C for 5 min, and amplified by 5 cycles of PCR (94°C, 45 s; 55°C, 45 s; 72°C, 45 s) followed by an additional 35 cycles (94°C, 45 s; 62°C, 45 s; 72°C, 30 s). The reaction products (25 μl) were run on a 4% Nusieve GTG agrose gel and DNA bands stained by ethidium bromide.
mAbs, Immunofluorescent Staining, and FACS® Analysis.
mAbs reactive with CCR5 were generated by immunizing mice with L1.2 cells expressing high levels of transfected CCR5-Flag (41). 10 female C57BL6 mice were immunized with 107 cells, intraperitoneally, six times at 2-wk intervals, and 8 fusions were performed in an attempt to identify a CCR5-specific mAb. 3 d after an i.v. injection of CCR5 L1.2 cells, the spleen was removed and cells were fused with the SP2/0 cell line as described (45). Generally 5,000–8,000 hybridomas were screened per fusion. In only one of the eight fusions were anti-CCR5 mAbs detected. The mAbs generated were 3A9 (IgG2a), 5C7 (IgG2a), 2F9 (IgG2a), 3D8 (IgG2a), 2C4 (IgG2a), 5D7 (IgG2a), 5H11 (IgG2b), and 1G4 (IgG2a). These mAbs were screened for reactivity on both CCR5-Flag as well as unflagged CCR5 L1.2 transfectants, and numerous other flagged and unflagged receptor transfectants. The anti-CXCR4 12G5 (46) was kindly provided by Jim Hoxie (University of Pennsylvania). PE-conjugated mAbs to CD4, CD8, CD14, CD20, CD25, CD26, CD69, CD45RO, and CD45RA were obtained from Becton Dickinson (San Jose, CA). Similar mAbs, as well as anti-CD95 PE, anti-CD3 Cy-Chrome, and antiCD4 Cy-Chrome were supplied by PharMingen (La Jolla, CA).
To assess reactivity of mAbs against transfected cells or leukocytes, indirect immunofluorescence and flow cytometry were used. Cells were washed once with PBS, and resuspended in 100 μl PBS containing 2% human serum and 0.1% sodium azide (staining buffer), 5 μg/ml purified antibody, 5 μg/ml IgG2a isotype matched control mAb (Sigma Chemical Co., St. Louis, MO), or 50 μl hybridoma culture supernatant. After 20 min at 4°C, cells were washed twice with staining buffer and resuspended in 50 μl FITC-conjugated affinity-purified F(ab′)2 goat anti–mouse IgG (Jackson ImmunoResearch Laboratories, West Grove, PA). After incubating for 20 min at 4°C, cells were washed twice in staining buffer and analyzed on the FACScan® to determine the level of surface expression. Propidium iodide was used to exclude dead cells.
Tissues, Immunohistochemistry.
Normal human mediastinal lymph node was obtained from the National Disease Research Interchange (NDRI, Philadelphia, PA). Immunohistochemical analysis for CCR5 was performed on frozen tissue samples using techniques previously described (47). The anti-CCR5 mAb 2F9 (10 μg/ml in 0.3% Triton X-100, 0.2% Tween 20, 1% FCS, 5% human AB serum, 0.1% sodium azide) were applied to tissue sections that were incubated overnight at 4°C. An isotype-matched irrelevant mAb (UPC10; Sigma) was used at the same concentration as a negative control on step sections of mediastinal node. Subsequently, biotinylated goat anti–mouse IgG and avidin-biotin-alkaline phosphatase complexes (Biogenex, San Ramon, CA) were added in sequence. Fast Red (Biogenex), containing levamisol to block endogenous alkaline phosphatase activity, was used as the chromogen and Mayers hematoxylin as the counterstain.
Results
Expression of CCR5 on Human Leukocytes.
Eight mAbs were generated to CCR5, by immunizing C57BL6 mice with the murine pre–B cell lymphoma line, L1.2, expressing transfected human CCR5. These transfectants expressed ∼240,000 MIP-1α binding sites per cell, as determined by ligand binding and Scatchard analysis (not shown). These mAbs, termed 3A9, 2F9, 5C7, 3D8, 2C4, 5D7, 5H11, and 1G4, reacted with L1.2 cells expressing CCR5, but not with L1.2 cells expressing the other chemokine receptors CCR1, CCR2, CCR3, CXCR1, CXCR2, CXCR3, CXCR4, or wild type L1.2 cells. The FACScan® profile of the various transfectants, stained with a representative mAb, 3A9, is shown in Fig. 1 A.
Figure 1.

Identification of CCR5-specific mAbs. (A) mAb 3A9 staining of various L1.2 transfectants. Stable L1.2 transfectants expressing either CCR1, CCR2b, CCR3, CCR4, CCR5, CXCR1 (IL-8 RA), CXCR2 (IL-8RB), CXCR3, and CXCR4 (fusin/Lestr) were stained with anti-CCR5 mAb 3A9. Negative control staining for all the L1.2 transfectants (not shown) resembled the staining shown for 3A9 on CCR1 L1.2 cells. (B) Lymphoblast as well as small lymphocyte staining within the paracortical region of mediastinal lymph node. (C) macrophage staining within the medullary region of a mediastinal lymph node. Photomicrographs (B) ×400; (C) ×500.
The reactivity of mAb 3A9 against certain human leukocyte types, and leukocyte cell lines, is outlined in Table 1. 3A9 stained a subset of blood lymphocytes, usually between 10–20% of cells. 3A9 was unreactive with most CD14+ monocytes, and was also unreactive with B cells (CD20+ cells), eosinophils (CCR3+), and neutrophils (Table 1). Of all the T cell lines we examined, the PM1 line was the only line that expressed appreciable levels CCR5, which correlates with the infectability of this line with macrophage-tropic HIV-1 (48, 49).
Table 1.
Reactivity of Anti-CCR5 mAb 3A9 with Various Leukocytes and Leukocyte Cell Lines
| Cell type | % positive | MFI |
|---|---|---|
| T cells (CD3+) | 14 (n = 30) | 40 |
| B cells (CD20+) | − | − |
| Neutrophils | − | − |
| Eosinophils | − | − |
| Monocytes | 5 | 10 |
| Sup-T1 (T cell line) | − | − |
| PM1 (T cell line) | 20 | 13 |
| Hut-78 (T cell line) | − | − |
| Jurkat (T cell line) | − | − |
| Molt4 clone 8 (T cell line) | − | − |
| CEM (T cell line) | − | − |
| Ramos (B cell line) | − | − |
| THP-1 (myelomonocytic) | − | − |
| KGla (myelomonocytic) | − | − |
| U937 (myelomonocytic) | − | − |
| HL-60 (myelomonocytic) | − | − |
| HMC-I (mast cell line) | 30 | 25 |
Since lymph nodes are a major reservoir of HIV-1 during the course of infection (50), immunohistochemical staining of mediastinal lymph node was also performed. Cells immunoreactive for CCR5 were identified in the paracortex (70%), medulla (20%), and subcapsular sinus (10%). The paracortex contained small clusters of 10–20 intensely immunoreactive cells that were morphologically consistent with T cell blasts (Fig. 1 B). The lymph node medulla contained scattered, individual immunoreactive cells that resembled macrophages (Fig. 1 C). The subcapsular sinus contained a mixture of the two cell types.
CCR5 Is Expressed on a Distinct Subset of Effector/Memory T Cells.
For most blood donors, the most distinctive expression of CCR5 was by CD3+ T cells (Table 1). The proportion of CD3+ cells stained was usually 10–20% of cells, with a heterogeneous staining intensity. A two-color immunofluorescence analysis of lymphocytes showed that a subset of both CD4+ cells and CD8+ cells expressed CCR5 (Fig. 2). These CCR5+ T cells expressed high levels of CD45RO, and low levels of CD45RA, a phenotype that is consistent with previous activation (51). An analysis using other markers indicative of previous cellular activation, such as CD26, showed that CCR5 was expressed on all CD26hi T cells, as well as some CD26intermediate cells. However CCR5+ cells expressed only low levels of markers for acute activation, such as CD25 (IL-2R), and CD69 (not shown). CCR5+ T cells were also CD95(Fas)+, and were mostly L-selectin−, a phenotype consistent with previous activation. A three-color immunofluorescence analysis using a third color anti-CD4 CyChrome revealed that CD4+ cells coexpressed CCR5 and the above lymphocyte markers in essentially the same pattern as that shown for ungated lymphocytes (not shown).
Figure 2.
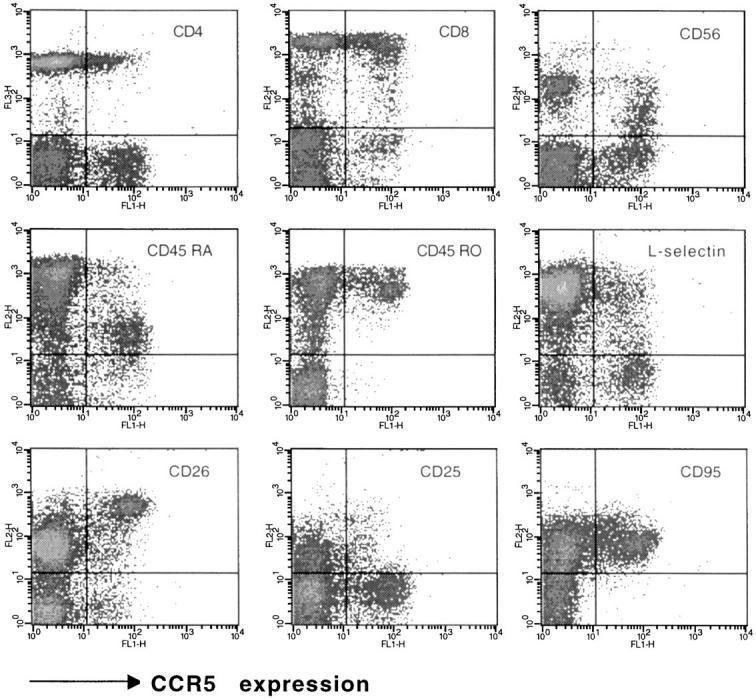
CCR5 expression on various populations of blood lymphocytes. A two-color staining protocol was used to assess for expression of CCR5 (_x_-axis in all plots) and the T cell subset markers CD4 and CD8, the naive/memory markers CD45RO and CD45RA, the activation markers CD26 and CD25, as well as L-selectin, CD95 (Fas) and CD56. The subset marker staining (_y_-axis) is indicated for each plot. Quadrants were set according to the staining of control mAbs. The staining was representative of eight donors analyzed.
Lymphocytes from +/Δ32 and Δ32/Δ32 Individuals Express Markedly Reduced Levels of CCR5.
The CCR5 mutant allele occurs at a frequency of 0.092 in the Caucasian population (35, 36). Individuals homozygous or heterozygous for the CCR5 mutant allele were identified by screening individuals at low and high risk for HIV-1 infection, using PCR. Fig. 3 A shows the PCR pattern for the three types of individuals: wild-type homozygous (+/+), heterozygous (+/Δ32), and homozygous for the deletion (Δ32/Δ32). A representative immunofluorescent staining of blood lymphocytes from each type of individual is shown in Fig. 3 B. An interesting finding was the very weak expression of CCR5 on +/Δ32 individuals. As expected, lymphocytes from Δ32/Δ32 individuals were CCR5 negative.
Figure 3.

Expression of CCR5 on T cells from normal (+/+), heterozygous (+/Δ32), and Δ32 homozygous (Δ32/Δ32) individuals. (A) Identification of +/+, +/Δ32, and Δ32/Δ32 individuals by PCR. Genomic DNA was isolated from PBMC of selected blood donors. PCR reactions were carried out using a set of 5′- and 3′- primers as described in Materials and Methods, and the reaction products were run on a 4% Nusieve GTG agarose gel and DNA bands stained by ethidium bromide. Under these conditions, a 174-bp band was detected for a +/+ individual (donor 5), a 142-bp band for Δ32 homozygous individuals (donors 1 and 2), and both 172- and 142-bp bands for heterozygous (+/Δ32) individuals (donors 3 and 4). Lane M shows the molecular weight markers. (B) Assessment of CCR5 expression on blood lymphocytes from +/+, +/Δ32, and Δ32/Δ32 individuals. Lymphocytes from the three types of individuals were stained with the anti-CCR5 mAb 3A9, and analyzed on the FACS®. Dot plots show fluorescence intensity (_y_-axis) and forward scatter (cell size, _x_-axis). The horizontal line in each plot indicates the point above which cells were considered positive, based on isotypematched control staining. This level of staining in all three plots resembled the staining of 3A9 shown for the Δ32/Δ32 individual. The staining profiles shown were representative of over 35 analyzed for +/+ individuals, 11 for +/Δ32 individuals, and 4 for Δ32/Δ32 individuals, although variability was observed (see below). (C ) Staining of anti-CD3–activated, rhIL-2–stimulated T cells from +/+, +/Δ32 and Δ32/Δ32 individuals. PBMC were activated with anti-CD3 mAb, and maintained in rhIL-2 for 21 d. Cell size (forward light scatter) is shown on the _x_-axis, and staining with mAb 3A9 on the _y_-axis.
T cells from individuals of each genotype were stimulated with anti-CD3, and were then incubated with IL-2 for varying periods of time. T cells derived from +/+ individuals stimulated in this fashion for 3 wk showed a marked upregulation of CCR5, while similarly treated cells from Δ32/Δ32 individuals were still negative for CCR5 expression (Fig. 3 C). T cells derived from +/Δ32 individuals showed a staining intensity almost 1 log less than that of +/+ T cells, indicative of a 5–10-fold reduced expression and consistent with the markedly reduced levels of CCR5 observed on resting T cells from +/Δ32 individuals. Peak expression of CCR5 on stimulated T cells from +/+ and +/Δ32 individuals required 3 wk of in vitro culture, at which time the majority of cells expressed CCR5. In these cultures, CCR5 expression was upregulated steadily from day 4, and the addition of IL-2 was obligatory for peak CCR5 expression. IL-2 has been reported to be an important stimulant for CC chemokine receptor expression (52), which we confirmed here at the protein level for CCR5.
Heterogeneity of CCR5 Expression by +/+ and +/Δ32 Individuals.
The results of staining of lymphocytes of 36 +/+ individuals, 11 +/Δ32 individuals, and 4 Δ32/Δ32 individuals, to determine the range and heterogeneity of CCR5 expression within each genotype, is depicted in Fig. 4. This analysis established that the pattern of CCR5 expression for most individuals showed a good correlation with CCR5 genotype, although a few +/+ individuals showed low levels of CCR5, and T cells from a minority of +/Δ32 individuals expressed slightly elevated levels of CCR5. Another important finding from this analysis was the considerable heterogeneity of CCR5 expression with the +/+ and +/Δ32 groups. This heterogeneity could be seen by assessing the percentage of cells positive for CCR5, as well as the mean fluorescence intensity of the CCR5+ subset (Fig. 4). Lymphocytes from all four Δ32/Δ32 individuals were CCR5−, and mean fluorescence intensity (MFI) for this category was not determined.
Figure 4.

Heterogeneity of CCR5 expression. Blood lymphocytes from 36 +/+ individuals, 11 +/Δ32 individuals, and 4 Δ32/Δ32 individuals were assessed for percentage CCR5 positive (3A9 staining) cells (left), and MFI of the positive subset (right). Each point represents the value obtained for a single individual. Staining was performed using mAb 3A9, and FACS® analysis. To calculate MFI, the positively stained subset was gated, according to control staining, and MFI was calculated using CellQuest software.
Infectability of PBMC from +/+, +/Δ32, and Δ32/Δ32 Individuals with Macrophage-tropic HIV-1 Correlates with CCR5 Expression.
PBMC from various blood donors, expressing different levels of CCR5, were examined for their infectability with a macrophage-tropic strain of HIV-1, JR-CSF (43), or a T-tropic strain, R3H (44). Infectability with HIV-1 and surface expression of CCR5 were performed simultaneously on activated CD4+ PBMC from eight subjects encompassing the three major known CCR5 genotypes. The two CCR5 wild-type homozygotes (pts 1 and 2) had the greatest number of CD4+ cells with surface expression of CCR5 (9.8–12.5%, Fig. 5 A). Similar to what is shown in Fig. 4, there was variability in the percentage of CD4+ cells expressing CCR5 among the heterozygotes. Expression ranged from levels observed in wild-type homozygotes (9%) to that observed in CCR5 Δ32 homozygotes (<2%, which is within the background level of detection). As expected, the surface expression of CXCR4 did not vary according to CCR5 genotype (Fig. 5 B). There was a close association between the number of CD4+ cells with surface expression of CCR5 and infectability of those cells by the macrophage-tropic isolate, JR-CSF (Fig. 5 A). Infection by the T-tropic isolate R3H was not affected by the expression of CCR5 nor did it correlate closely with the percentage of cells that expressed CXCR4, although there was variation in their ability to be infected by T-tropic viral isolate for reasons that remain unclear. These results indicate that the number of CD4+ cells that express CCR5 upon activation is a major determinant of the in vitro susceptibility to macrophage-tropic virus infection.
Figure 5.

CCR5 surface expression correlates with macrophage-tropic HIV infectability. PBMC from 8 subjects were tested for CCR5 genotype by PCR. Genotypes are represented by (+) for a wild-type allele and (−) for a Δ32 allele. PBMC were stimulated with anti-CD3 antibody and carried for 16 d in the presence of rhIL-2. CD8+ cells were depleted using immunomagnetic beads. Expression of CCR5 or CXCR4 on the surface of CD4+ cells was determined by dual staining with anti-CD4 antibody and mAb 3A9 (CCR5) or 12G5 (CXCR4), respectively, on a FacsCaliber® (Becton Dickinson). Enriched CD4+ cells were inoculated at 2 × 10⁵ cells per well with 600 TCID50 of JR-CSF (a) or R3H (b) and p24 production was measured on days 4, 7, and 11. Based on the growth rates of the two isolates in vitro, day 4 and day 11 p24 results for JR-CSF and R3H, respectively, are shown (dark bars) in comparison to percentage of cells expressing specific coreceptors (stippled bars).
Anti-CCR5 mAb Inhibits Macrophage-tropic HIV-1 Infection of Primary T Cells.
The ability of anti-CCR5 mAbs to inhibit HIV-1 infection of PBMC was assessed. A preliminary analysis showed that mAb 3A9 was the most effective inhibitor of macrophage-tropic HIV-1 infection of PBMC. As shown in Fig. 6 A, a high concentration of mAb 3A9, when added at the time of virus inoculation, was able to neutralize >95% of infection by the macrophage-tropic isolate JR-CSF. This was similar to the amount of inhibition observed when 200 ng each of recombinant RANTES, MIP-1α, and MIP-1β were added to the culture (Fig. 6 A). Neither the anti-CCR5 mAb nor the recombinant chemokines had any inhibitory effect upon infection with the T-tropic strain, R3H (Fig. 6 B). To determine the sensitivity of JR-CSF to neutralization by mAb 3A9, the antibody was added to PBMC at the time of virus inoculation in serial fivefold dilution (Fig 6 C). mAb 3A9 was able to inhibit JR-CSF infection on PHA-activated PBMC with ID50 and ID90 values of 0.5–2.3 μg/ml and 15.3–17.2 μg/ml, respectively. mAb 3A9 (and to a lesser extent the other anti-CCR5 mAbs) also inhibited viral entry in the single round replication of an env-complemented recombinant HIV-1 virus (not shown).
Figure 6.
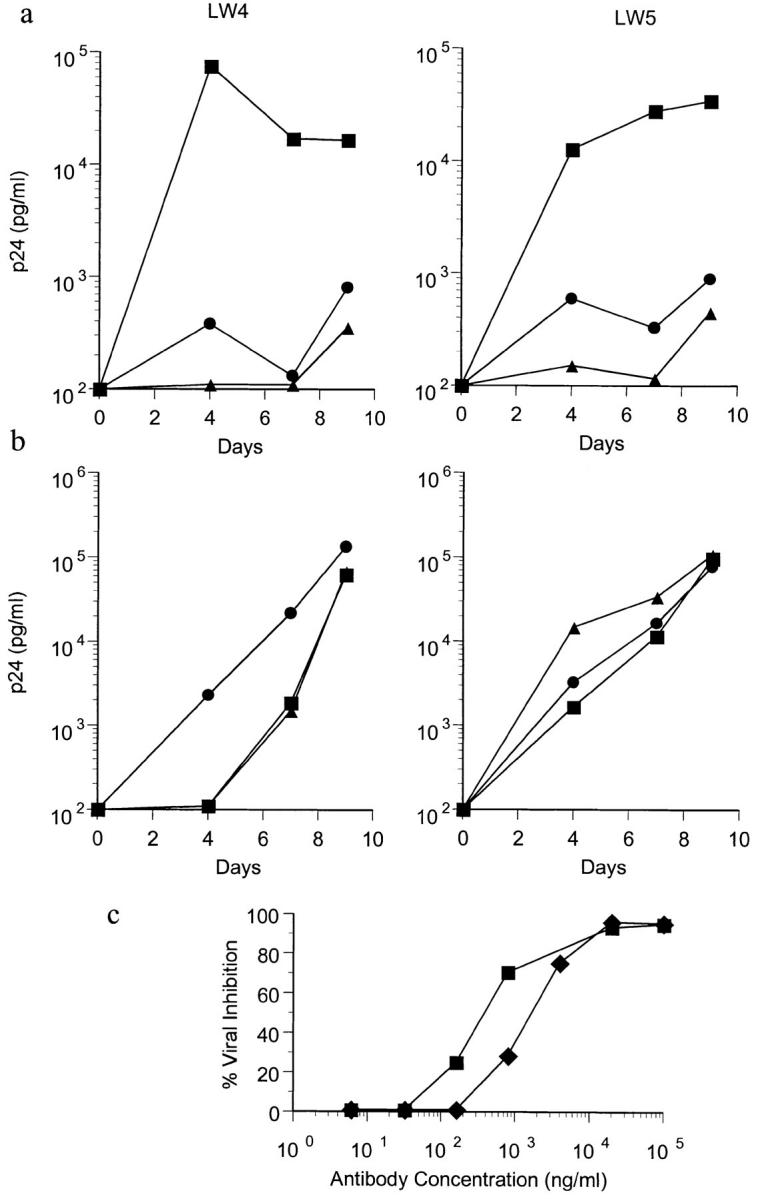
Inhibition of macrophage-tropic HIV-1 infection of PBMC by anti-CCR5 mAb. 7-d PHA-activated CD4+ cells from two CCR5 wild-type homozygotes (LW4 and LW5) were inoculated with 600 TCID of JR-CSF (a) or R3H (b) alone (▪) or in the presence of 100 μg/ml of CCR5 mAb 3A9 (•) or 200 ng each of recombinant RANTES, MIP-1α, and MIP-1β (▵). HIV-1 p24 production was measured over the course of 9 d. To determine the sensitivity of JR-CSF to inhibition by 3A9, the amount of viral inhibition was calculated when serial fivefold dilutions of mAb 3A9 were added to the PBMC at the time of virus inoculation (c). 50% inhibitory doses (ID50) on LW4 (▪) and LW5 (♦) PBMC were 0.5 and 2.3 μg/ml. 90% inhibitory doses (ID90) were 17.2 and 15.3 μg/ml.
The anti-CCR5 mAbs were also tested for their ability to inhibit the binding of 125I-MIP-1α to CCR5 transfectants, and also for their ability to block chemotaxis of CD3 blasts to MIP-1β. mAb 3A9, when used at 100 μg/ml, inhibited binding of 125I-MIP-1α to CCR5 transfectants by only ∼10%, compared with that obtained with 100 nM of cold chemokine, and similar results were obtained with the other anti-CCR5 mAbs. These results suggest that the antigenic epitope of human CCR5, recognized by this panel of mAbs, is not central for ligand binding. We were also unable to demonstrate mAb inhibition of T cell chemotaxis to MIP-1β with mAb 3A9 (not shown).
Discussion
The importance of CCR5 as a cofactor for macrophagetropic HIV-1 entry into cells led us to develop reagents that might block this entry. We also used these mAbs to examine the expression of CCR5 on human leukocytes, and in particular to document individual to individual differences in the levels of CCR5 expression on blood T cells.
On T cells, CCR5 was found to be expressed by a distinct subset of CD45RO+ memory T cells, most of which expressed high levels of CD26, and CD95 (Fas). This expression pattern explains the findings of some previous studies. CD45RO+ as well as CD26+ T cells are selectively lost during the first stages of HIV-1 infection (53, 54), and loss of T cell memory is a hallmark of HIV-1 infection (55). Moreover, activated and memory T cells carry most of the viral burden in HIV-1 infected individuals (53). CCR5 was also found to be expressed by activated T cells in vitro, and by lymphoblasts in lymph nodes. Replication of HIV-1 occurs predominantly in the activated population of CD4+ T cells (56), and the efficiency of HIV-1 infection is enhanced in the setting of an antigen-specific immune activation (57, 58). CCR5 was found to be absent from most transformed T cell lines, and these lines are known to express high levels of CXCR4, the T-tropic coreceptor (46, 59). The expression pattern of CCR5 also correlated with the chemotactic properties of T cells. RANTES is a chemoattractant for a subset of effector/memory (CD45RO+) T cells (21). We have found that MIP-1α and MIP-1β also selectively attract CD45RO+ T cells (18), although other groups have reported conflicting results on this topic (reviewed in reference 60). In migration assays, CD26hi T cells are the most responsive to CC chemokines (18, 19), are the most efficient at transendothelial migration, and are abundant within certain inflammatory lesions (61). These cells most likely represent a highly migratory, post-activation, effector type T cell.
A central question is why do primary HIV-1 isolates use CCR5 over other receptors, and what are the reasons for the emergence of T-tropic virus late in the disease course. An important feature of CCR5 is its high expression on effector/memory T cells. The loss of these cells, more than any other cell type, is what leads to the deterioration of immune responses. This may allow changes that would not normally happen in the face of a healthy immune response. It is possible that the gp120 of T-tropic HIV-1 is more easily neutralized by antibodies (62), or is more effectively combated by cytotoxic T cells, and this protection is lost in the later stages of disease following the loss of effector/memory T cells. Nevertheless other factors may also contribute to receptor useage during the course of infection. Chemokine receptor expression may change dramatically, and upregulation or downregulation of individual receptors may influence the types or numbers of cellular targets for infection. An analysis of individuals at various stages of HIV-1 infection may shed light on this question.
There was individual to individual variation in the expression of CCR5 on blood lymphocytes. Variation in the extent of MIP-1β binding to CCR5 on activated CD4+ T cells from different individuals has also been reported (63). The importance of CCR5 as an HIV-1 coreceptor suggests that variability in the expression of CCR5 within the CCR5 +/+ and +/Δ32 genotypes may have important consequences for HIV-1 transmission or AIDS pathogenesis. For instance, individuals with numerous CCR5hi cells at mucosal surfaces may be at greater risk of contracting HIV-1. Also, greater numbers of CCR5hi CD4+ cells in blood or tissues may lead to more rapid viral spreading, and quicker progression to AIDS. The apparent advantage that CCR5 +/Δ32 individuals have with respect to disease progression would support this proposition. The examination of a relatively small number of individuals indicated that levels of CCR5 expression correlate with macrophagetropic HIV-1 infectability, in vitro. Further experiments will be required to establish whether the same principle holds in vivo. The factors that influence CCR5 expression in vivo are currently unknown, but may relate to the degree of immune challenge or activation. To a certain extent, expression of CCR5 in blood relates simply to the percentage of effector/memory (CD26hi) T cells, but may also relate to other factors such as exposure to inflammatory cytokines. A variety of experiments using in vitro activation of T cells supports the notion that the efficiency of HIV-1 infection is enhanced in the setting of immune activation (57). In sub-Saharan Africa, the increased risk of acquiring HIV-1 infection on exposure to the virus, and the more rapid disease progression compared to that seen in the western world, is thought to result from a heightened level of antigenic activation in these individuals (64).
CCR5-deficient individuals are generally resistant to infection with HIV-1 (35–38), which has spurred efforts to develop inhibitors of HIV-1 binding to CCR5. A major aim of this study was to develop a mAb that could block macrophage-tropic HIV-1 infection of human T cells. Antibodies directed against the HIV-1 exterior glycoprotein, gp120, exhibit only very weak neutralizing activity against primary macrophage-tropic HIV-1 isolates and have been shown to enhance the entry of some primary isolates in vitro (65, 66). Chemokines themselves will inhibit HIV-1 binding, but they have potent agonist activity, and in some cases may enhance HIV-1 replication (67). Truncated chemokines can act as receptor antagonists, exemplified by a truncated form of RANTES (amino acids 9–68) that inhibits macrophage-tropic HIV-1 infection of CCR5 bearing cells (68), although only at very high concentrations. The mAbs described here were able to inhibit macrophagetropic HIV-1 infection of PBMC by >95%. These mAbs inhibited viral entry, yet interestingly were only weak inhibitors of MIP-1α binding. This is consistent with other studies showing that chemokines and HIV-1 interact with CCR5 at separate though potentially overlapping sites (69, 70). CCR5-specific mAbs may be of use for establishing that a CCR5 antagonist might contain viral infection and reduce viral load. However additional studies will be necessary to ascertain the ability of an antibody to inhibit multiple independent strains of macrophage-tropic HIV-1, and to be sure such an antibody does not accelerate development of the more cytopathic T-tropic strains of HIV-1. CCR5 antagonists would presumably be of most benefit during the early stages of infection, before the evolution of T-tropic, CXCR4 binding HIV-1 strains.
In conclusion, anti-CCR5 mAbs enabled the blocking of macrophage-tropic HIV-1 infection in vitro, and also provided data on the expression of this coreceptor on human leukocytes. These reagents should provide further interesting insights, particularly into the biology of CCR5 and the pathogenesis of AIDS.
Acknowledgments
We thank Doug Ringler, Craig Gerard, Eugene Butcher, and Mike Farzan for advice and assistance during the course of these experiments; Greg LaRosa, Paul Ponath, Shixin Qin, and Jim Campbell for supplying various L1.2 transfectants; Jim Hoxie for supplying the 12G5 mAb; Nathaniel Landau and Sunny Choe for providing additional CCR5 transfectants; Stanley Kang, Paul Myers, Heidi Heath, and Jason Humblias for technical assistance, Ken Ganley for immunohistochemistry; Maurice Gately and Antonio Lanzavecchia for providing recombinant human IL-2; and John Moore for manuscript review.
This work was supported by grants and contracts from the National Institutes of Health (AI-35522, AI41384, and AI-45218 and AI 24755). This work was made possible by gifts from the late William McCartyCooper, the G. Harold and Leila Y. Mathers Charitable Foundation, the Friends 10, and Douglas and Judi Krupp. R.A. Koup is an Elizabeth Glaser Scientist of the Pediatric AIDS Foundation.
Footnotes
1 Abbreviations used in this paper: MCP, monocyte chemotactic protein; MIP, macrophage inflammatory protein; MFI, mean fluorescence intensity; 7TMR, seven trans-membrane spanning receptor.
Some of the mAbs described here will be deposited with the National Institutes of Health AIDS Research and Reference Reagent Program (http: //www.niaid.nih.gov/reagent).
References
- 1.Baggiolini M, Dewald B, Moser B. IL-8 and related chemotactic cytokines-CXC and CC chemokines. Adv Immunol. 1994;55:97–179. [PubMed] [Google Scholar]
- 2.Murphy PM. The molecular biology of leukocyte chemoattractant receptors. Annu Rev Immunol. 1994;12:593–633. doi: 10.1146/annurev.iy.12.040194.003113. [DOI] [PubMed] [Google Scholar]
- 3.Schall TJ, Bacon KB. Chemokines, leukocyte trafficking, and inflammation. Curr Opin Immunol. 1994;6:865–873. doi: 10.1016/0952-7915(94)90006-x. [DOI] [PubMed] [Google Scholar]
- 4.Gerard C, Gerard NP. The pro-inflammatory seven-transmembrane segment receptors of the leukocyte. Curr Opin Immunol. 1994;6:140–145. doi: 10.1016/0952-7915(94)90045-0. [DOI] [PubMed] [Google Scholar]
- 5.Springer TA. Traffic signals for lymphocyte recirculation and leukocyte emigration: the multistep paradigm. Cell. 1994;76:301–314. doi: 10.1016/0092-8674(94)90337-9. [DOI] [PubMed] [Google Scholar]
- 6.Butcher EC. Leukocyte-endothelial cell recognition: three (or more) steps to specificity and diversity. Cell. 1991;67:1033–1036. doi: 10.1016/0092-8674(91)90279-8. [DOI] [PubMed] [Google Scholar]
- 7.Bargatze RF, Butcher EC. Rapid G proteinregulated activation event involved in lymphocyte binding to high endothelial venules. J Exp Med. 1993;178:367–372. doi: 10.1084/jem.178.1.367. [DOI] [PMC free article] [PubMed] [Google Scholar]
- 8.Strieter RM, Standiford TJ, Huffnagle GB, Colletti LM, Lukacs NW, Kunkel SL. “The good, the bad, and the ugly.” The role of chemokines in models of human disease. J Immunol. 1996;156:3583–3586. [PubMed] [Google Scholar]
- 9.Rand ML, Warren JS, Mansour MK, Newman W, Ringler DJ. Inhibition of T cell recruitment and cutaneous delayed-type hypersensitivity-induced inflammation with antibodies to monocyte chemoattractant protein-1. Am J Pathol. 1996;148:855–864. [PMC free article] [PubMed] [Google Scholar]
- 10.Cacalano G, Lee J, Kikly K, Ryan AM, Pitts-Meek S, Hultgren B, Wood WI, Moore MW. Neutrophil and B cell expansion in mice that lack the murine IL-8 receptor homolog. Science (Wash DC) 1994;265:682–684. doi: 10.1126/science.8036519. [DOI] [PubMed] [Google Scholar]
- 11.Cook DN, Beck MA, Coffman TM, Kirby SL, Sheridan JF, Pragnell IB, Smithies O. Requirement of MIP-1α for an inflammatory response to viral infection. Science (Wash DC) 1995;269:1583–1585. doi: 10.1126/science.7667639. [DOI] [PubMed] [Google Scholar]
- 12.Ponath PD, Qin S, Ringler DJ, Clark-Lewis I, Wang J, Kassam N, Smith H, Shi X, Gonzalo J-A, Newman W, et al. Cloning of the human eosinophil chemoattractant, eotaxin: expression, receptor binding and functional properties provide a mechanism for the selective recruitment of eosinophils. J Clin Invest. 1996;97:604–612. doi: 10.1172/JCI118456. [DOI] [PMC free article] [PubMed] [Google Scholar]
- 13.Ponath PD, Qin S, Post TW, Wang J, Wu L, Gerard NP, Newman W, Gerard C, Mackay CR. Molecular cloning and characterization of a human eotaxin receptor expressed selectively on eosinophils. J Exp Med. 1996;183:2437–2448. doi: 10.1084/jem.183.6.2437. [DOI] [PMC free article] [PubMed] [Google Scholar]
- 14.Heath H, Qin S, Rao P, Wu L, LaRosa G, Kassam N, Ponath PD, Mackay CR. Chemokine receptor usage by human eosinophils. The importance of CCR3 demonstrated using an antagonistic monoclonal antibody. J Clin Invest. 1997;99:178–184. doi: 10.1172/JCI119145. [DOI] [PMC free article] [PubMed] [Google Scholar]
- 15.Broaddus VC, Boylan AM, Hoeffel JM, Kim KJ, Sadick M, Chuntharapai A, Hebert CA. Neutralization of IL-8 inhibits neutrophil influx in a rabbit model of endotoxin-induced pleurisy. J Immunol. 1994;152:2960–2967. [PubMed] [Google Scholar]
- 16.Mulligan MS, Jones ML, Bolanowski MA, Baganoff MP, Deppeler CL, Meyers DM, Ryan US, Ward PA. Inhibition of lung inflammatory reactions in rats by an anti-human IL-8 antibody. J Immunol. 1993;150:5585–5595. [PubMed] [Google Scholar]
- 17.Sekido N, Mukaida N, Harada A, Nakanishi I, Watanabe Y, Matsushima K. Prevention of lung reperfusion injury in rabbits by a monoclonal antibody against interleukin-8. Nature (Lond) 1993;365:654–657. doi: 10.1038/365654a0. [DOI] [PubMed] [Google Scholar]
- 18.Qin S, LaRosa G, Campbell JJ, Smith-Heath H, Kassam N, Shi X, Zeng L, Butcher EC, Mackay CR. Expression of monocyte chemoattractant protein-1 and interleukin-8 receptors on subsets of T cells: correlation with transendothelial chemotactic potential. Eur J Immunol. 1996;26:640–647. doi: 10.1002/eji.1830260320. [DOI] [PubMed] [Google Scholar]
- 19.Carr MW, Roth SJ, Luther E, Rose SS, Springer TA. Monocyte chemoattractant protein 1 acts as a T-lymphocyte chemoattractant. Proc Natl Acad Sci USA. 1994;91:3652–3656. doi: 10.1073/pnas.91.9.3652. [DOI] [PMC free article] [PubMed] [Google Scholar]
- 20.Taub DD, Proost P, Murphy WJ, Anver M, Longo DL, van Damme J, Oppenheim JJ. Monocyte chemotactic protein-1 (MCP-1), -2, and -3 are chemotactic for human T lymphocytes. J Clin Invest. 1995;95:1370–1376. doi: 10.1172/JCI117788. [DOI] [PMC free article] [PubMed] [Google Scholar]
- 21.Schall TJ, Bacon K, Toy KJ, Goeddel DV. Selective attraction of monocytes and T lymphocytes of the memory phenotype by cytokine RANTES. Nature (Lond) 1990;347:669–671. doi: 10.1038/347669a0. [DOI] [PubMed] [Google Scholar]
- 22.Uguccioni M, D'Apuzzo M, Loetscher M, Dewald B, Baggiolini M. Actions of the chemotactic cytokines MCP-1, MCP-2, MCP-3, RANTES, MIP-1α and MIP-1β on human monocytes. Eur J Immunol. 1995;25:64–68. doi: 10.1002/eji.1830250113. [DOI] [PubMed] [Google Scholar]
- 23.Bleul CC, Fuhlbrigge RC, Casasnovas JM, Aiuti A, Springer TA. A highly efficacious lymphocyte chemoattractant, stromal cell-derived factor 1 (SDF-1) J Exp Med. 1996;184:1101–1110. doi: 10.1084/jem.184.3.1101. [DOI] [PMC free article] [PubMed] [Google Scholar]
- 24.Bleul CC, Farzan M, Choe H, Parolin C, Clark-Lewis I, Sodroski J, Springer TA. The lymphocyte chemoattractant SDF-1 is a ligand for LESTR/fusin and blocks HIV-1 entry. Nature (Lond) 1996;382:829–833. doi: 10.1038/382829a0. [DOI] [PubMed] [Google Scholar]
- 25.Oberlin E, Amara A, Bachelerie F, Bessia C, Virelizier J-L, Arenzana-Seisdedos F, Schwartz O, Heard J-M, Clark-Lewis I, Legler DF, et al. The CXC chemokine SDF-1 is the ligand for LESTR/fusin and prevents infection by T-cell-line-adapted HIV-1. Nature (Lond) 1996;382:833–835. doi: 10.1038/382833a0. [DOI] [PubMed] [Google Scholar]
- 26.Taub DD, Lloyd AR, Conlon K, Wang JM, Ortaldo JR, Harada A, Matsushima K, Kelvin DJ, Oppenheim JJ. Recombinant human interferon-inducible protein 10 is a chemoattractant for human monocytes and T lymphocytes and promotes T cell adhesion to endothelial cells. J Exp Med. 1993;177:1809–1814. doi: 10.1084/jem.177.6.1809. [DOI] [PMC free article] [PubMed] [Google Scholar]
- 27.Loetscher M, Gerber B, Loetscher P, Jones SA, Piali L, Clark-Lewis I, Baggiolini M, Moser B. Chemokine receptor specific for IP-10 and Mig: structure, function and expression in activated T-lymphocytes. J Exp Med. 1996;184:963–969. doi: 10.1084/jem.184.3.963. [DOI] [PMC free article] [PubMed] [Google Scholar]
- 28.Cocchi F, DeVico AL, Garzino-Demo A, Arya SK, Gallo RC, Lusso P. Identification of RANTES, MIP-1α, and MIP-1β as the major HIV-suppressive factors produced by CD8+ T cells. Science (Wash DC) 1995;270:1811–1815. doi: 10.1126/science.270.5243.1811. [DOI] [PubMed] [Google Scholar]
- 29.Feng Y, Broder CC, Kennedy PE, Berger EA. HIV-1 entry cofactor: functional cDNA cloning of a seven-transmembrane, G protein-coupled receptor. Science (Wash DC) 1996;272:872–877. doi: 10.1126/science.272.5263.872. [DOI] [PubMed] [Google Scholar]
- 30.Choe H, Farzan M, Sun Y, Sullivan N, Rollins B, Ponath PD, Wu L, Mackay CR, LaRosa G, Newman W, et al. The beta-chemokine receptors CCR3 and CCR5 facilitate infection by primary HIV-1 isolates. Cell. 1996;85:1135–1148. doi: 10.1016/s0092-8674(00)81313-6. [DOI] [PubMed] [Google Scholar]
- 31.Alkhatib G, Combadiere C, Broder CC, Feng Y, Kennedy PE, Murphy PM, Berger EA. CC CKR5: a RANTES, MIP-1alpha, MIP-1beta receptor as a fusion cofactor for macrophage-tropic HIV-1. Science (Wash DC) 1996;272:1955–1958. doi: 10.1126/science.272.5270.1955. [DOI] [PubMed] [Google Scholar]
- 32.Doranz BJ, Rucker J, Yi Y, Smyth RJ, Samson M, Peiper SC, Parmentier M, Collman RG, Doms RW. A dual-tropic primary HIV-1 isolate that uses fusin and the beta-chemokine receptors CKR-5, CKR-3, and CKR2b as fusion cofactors. Cell. 1996;85:1149–1158. doi: 10.1016/s0092-8674(00)81314-8. [DOI] [PubMed] [Google Scholar]
- 33.Deng H, Liu R, Ellmeier W, Choe S, Unutmaz D, Burkhart M, Di Marzio P, Marmon S, Sutton RE, Hill CM, et al. Identification of a major co-receptor for primary isolates of HIV-1. Nature (Lond) 1996;381:661–666. doi: 10.1038/381661a0. [DOI] [PubMed] [Google Scholar]
- 34.Dragic T, Litwin V, Allaway GP, Martin SR, Huang Y, Nagashima KA, Cayanan C, Maddon PJ, Koup RA, Moore JP, Paxton WA. HIV-1 entry into CD4+ cells is mediated by the chemokine receptor CC-CKR-5. Nature (Lond) 1996;381:667–673. doi: 10.1038/381667a0. [DOI] [PubMed] [Google Scholar]
- 35.Liu R, Paxton WA, Choe S, Ceradini D, Martin SR, Horuk R, MacDonald ME, Stuhlmann H, Koup RA, Landau NR. Homozygous defect in HIV-1 coreceptor accounts for resistance of some multiply-exposed individuals to HIV-1 infection. Cell. 1996;86:367–377. doi: 10.1016/s0092-8674(00)80110-5. [DOI] [PubMed] [Google Scholar]
- 36.Samson M, Libert F, Doranz BJ, Rucker J, Liesnard C, Farber CM, Saragosti S, Lapoumeroulie C, Cognaux J, Forceille C, et al. Resistance to HIV-1 infection in caucasian individuals bearing mutant alleles of the CCR-5 chemokine receptor gene. Nature (Lond) 1996;382:722–725. doi: 10.1038/382722a0. [DOI] [PubMed] [Google Scholar]
- 37.Dean M, Carrington M, Winkler C, Huttley GA, Smith MW, Allikmets R, Goedert JJ, Buchbinder SP, Vittinghoff E, Gomperts E, et al. Genetic restriction of HIV-1 infection and progression to AIDS by a deletion allele of the CKR5 structural gene. Science (Wash DC) 1996;273:1856–1862. doi: 10.1126/science.273.5283.1856. [DOI] [PubMed] [Google Scholar]
- 38.Huang Y, Paxton WA, Wolinsky SM, Neumann AU, Zhang L, He T, Kang S, Ceradini D, Jin Z, Yazdanbakhsh K, et al. The role of a mutant CCR5 allele in HIV-1 transmission and disease progression. Nature Med. 1996;2:1240–1243. doi: 10.1038/nm1196-1240. [DOI] [PubMed] [Google Scholar]
- 39.Paxton WA, Martin SR, Tse D, O'Brien TR, Skurnick J, VanDevanter NL, Padian N, Braun JF, Kotler DP, Wolinsky SM, Koup RA. Relative resistance to HIV-1 infection of CD4 lymphocytes from persons who remain uninfected despite multiple high-risk sexual exposure. Nature Med. 1996;2:412–417. doi: 10.1038/nm0496-412. [DOI] [PubMed] [Google Scholar]
- 40.Wu L, Ruffing N, Shi X, Newman W, Soler D, Mackay CR, Qin S. Discrete steps in binding and signaling of interleukin-8 with its receptor. J Biol Chem. 1996;271:31202–31209. doi: 10.1074/jbc.271.49.31202. [DOI] [PubMed] [Google Scholar]
- 41.Wu L, Gerard L, Wyatt R, Choe H, Parolin C, Ruffing N, Borsetti A, Cardoso AA, Desjardin E, Newman W, Gerard C, Sodroski J. CD4-induced interaction of primary HIV-1 gp120 glycoproteins with the chemokine receptor CCR-5. Nature (Lond) 1996;384:179–183. doi: 10.1038/384179a0. [DOI] [PubMed] [Google Scholar]
- 42.Campbell JJ, Qin S, Bacon KB, Mackay CR, Butcher EC. The biology of chemokine and classical chemoattractant receptors: differential requirements for adhesiontriggering versus chemotactic responses in lymphoid cells. J Cell Biol. 1996;134:255–266. doi: 10.1083/jcb.134.1.255. [DOI] [PMC free article] [PubMed] [Google Scholar]
- 43.Koyanagi Y, Miles S, Mitsuyasu RT, Merrill JE, Vinters HV, Chen ISY. Dual infection of the central nervous system by AIDS viruses with distinct cellular tropisms. Science (Wash DC) 1987;236:819–822. doi: 10.1126/science.3646751. [DOI] [PubMed] [Google Scholar]
- 44.Harrowe G, Cheng-Mayer C. Amino acid substitutions in the V3 loop are reponsible for adaptation to growth in transformed T-cell lines of a primary human immunodeficiency virus type 1. Virology. 1995;210:490–494. doi: 10.1006/viro.1995.1367. [DOI] [PubMed] [Google Scholar]
- 45.Coligan, J.E., A.M. Kruisbeek, D.H. Margulies, E.M. Shevach, and W. Strober. 1992. Current Protocols in Immunology. John Wiley and Sons, New York. p. 2.5.4
- 46.Endres MJ, Clapham PR, Marsh M, Ahuja M, Turner JD, McKnight A, Thomas JF, Stoebenau-Haggarty B, Choe S, Vance PJ, et al. CD4-independent infection by HIV-2 is mediated by fusin/CXCR4. Cell. 1996;87:745–756. doi: 10.1016/s0092-8674(00)81393-8. [DOI] [PubMed] [Google Scholar]
- 47.Silber A, Newman W, Reimann KA, Hendricks E, Walsh D, Ringler DJ. Kinetic expression of endothelial adhesion molecules and relationship to leukocyte recruitment in two cutaneous models of inflammation. Lab Invest. 1994;70:163–175. [PubMed] [Google Scholar]
- 48.Lusso P, Cocchi F, Balotta C, Markham PD, Louie A, Farci P, Pal R, Gallo RC, Reitz MS. Growth of macrophage-tropic and primary human immunodeficiency virus type 1 (HIV-1) isolates in a unique CD4+ T-cell clone (PM1): failure to downregulate CD4 and to interfere with cell-line-tropic HIV-1. J Virol. 1995;69:3712–3720. doi: 10.1128/jvi.69.6.3712-3720.1995. [DOI] [PMC free article] [PubMed] [Google Scholar]
- 49.Oravecz T, Roderiquez G, Koffi J, Wang J, Ditto M, Bou-Habib DC, Lusso P, Norcross MA. CD26 expression correlates with entry, replication and cytopathicity of monocytotropic HIV-1 strains in a T-cell line. Nature Med. 1995;1:919–926. doi: 10.1038/nm0995-919. [DOI] [PubMed] [Google Scholar]
- 50.Pantaleo G, Graziosi C, Demarest JF, Butini L, Montroni M, Fox CH, Orenstein JM, Kotler DP, Fauci AS. HIV infection is active and progressive in lymphoid tissue during the clinically latent stage of disease. Nature (Lond) 1993;362:355–358. doi: 10.1038/362355a0. [DOI] [PubMed] [Google Scholar]
- 51.Mackay CR. Immunological memory. Adv Immunol. 1993;53:217–265. doi: 10.1016/s0065-2776(08)60501-5. [DOI] [PubMed] [Google Scholar]
- 52.Loetscher P, Seitz M, Baggiolini M, Moser B. Interleukin-2 regulates CC chemokine receptor expression and chemotactic responsiveness in T lymphocytes. J Exp Med. 1996;184:569–577. doi: 10.1084/jem.184.2.569. [DOI] [PMC free article] [PubMed] [Google Scholar]
- 53.Schnittman SM, Lane HC, Greenhouse J, Justement JS, Baseler M, Fauci AS. Preferential infection of CD4+ memory T cells by human immunodeficiency virus type 1: evidence for a role in the selective T-cell functional defects observed in infected individuals. Proc Natl Acad Sci USA. 1990;87:6058–6062. doi: 10.1073/pnas.87.16.6058. [DOI] [PMC free article] [PubMed] [Google Scholar]
- 54.Vanham G, Kestens L, De Meester I, Vingerhoets J, Penne G, Vanhoof G, Scharpe S, Heyligen H, Bosmans E, Ceuppens JL, et al. Decreased expression of the memory marker CD26 on both CD4+ and CD8+ T lymphocytes of HIV-1 infected subjects. J Acquired Immune Defic Syndr. 1993;6:749–757. [PubMed] [Google Scholar]
- 55.Lane HC, Deeper JM, Green WC, Whalen G, Waldmann TA, Fauci AS. Qualitative analysis of immune function in patients with acquired immune deficiency syndrome. N Engl J Med. 1985;313:79–84. doi: 10.1056/NEJM198507113130204. [DOI] [PubMed] [Google Scholar]
- 56.Ho DD, Neumann AU, Perelson AS, Chen W, Leonard JM, Markowitz M. Rapid turnover of plasma virions and CD4 lymphocytes in HIV-1 infection. Nature (Lond) 1995;373:123–126. doi: 10.1038/373123a0. [DOI] [PubMed] [Google Scholar]
- 57.Weissman D, Barker TD, Fauci AS. The efficiency of acute infection of CD4+ T cells is markedly enhanced in the setting of antigen-specific immune activation. J Exp Med. 1996;183:687–692. doi: 10.1084/jem.183.2.687. [DOI] [PMC free article] [PubMed] [Google Scholar]
- 58.Stanley S, Ostrowski MA, Justement JS, Gantt K, Hedayati S, Mannix M, Roche K, Schwartzentruber DJ, Fox CH, Fauci AS. Effect of immunization with a common recall antigen on viral expression in patients infected with human immunodeficiency virus type 1. N Engl J Med. 1996;334:1222–1230. doi: 10.1056/NEJM199605093341903. [DOI] [PubMed] [Google Scholar]
- 59.Bleul CC, Wu L, Hoxie JA, Springer TA, Mackay CR. The chemokine receptors CXCR4 and CCR5 are differentially expressed and regulated on T cells. Proc Natl Acad Sci USA. 1997;94:1925–1930. doi: 10.1073/pnas.94.5.1925. [DOI] [PMC free article] [PubMed] [Google Scholar]
- 60.Mackay CR. Chemokine receptors and T cell chemotaxis. J Exp Med. 1996;184:799–802. doi: 10.1084/jem.184.3.799. [DOI] [PMC free article] [PubMed] [Google Scholar]
- 61.Stemme S, Holm J, Hansson GK. T lymphocytes in human atherosclerotic plaques are memory cells expressing CD45RO and the integrin VLA-1. Arterioscler Thromb. 1992;12:206–211. doi: 10.1161/01.atv.12.2.206. [DOI] [PubMed] [Google Scholar]
- 62.Moore JP, Cao Y, Qing L, Sattentau QJ, Pyati J, Koduri R, Robinson J, Barbas CF, Burton DR, Ho DD. Primary isolates of human immunodeficiency virus type 1 are relatively resistant to neutralization by monoclonal antibodies to gp120, and their neutralization is not predicted by studies with monomeric gp120. J Virol. 1995;69:101–109. doi: 10.1128/jvi.69.1.101-109.1995. [DOI] [PMC free article] [PubMed] [Google Scholar]
- 63.Moore, J.P. 1997. Coreceptors: implications for HIV pathogenesis and therapy. Science (Wash. DC). In press. [DOI] [PubMed]
- 64.Bentwich Z, Kalinkovich A, Weisman Z. Immune activation is a dominant factor in the pathogenesis of African AIDS. Immunol Today. 1995;16:187–191. doi: 10.1016/0167-5699(95)80119-7. [DOI] [PubMed] [Google Scholar]
- 65.Sullivan N, Sun Y, Li J, Hoffman W, Sodroski J. Replicative function and neutralization sensitivity of envelope glucoproteins from primary and T cell line-passaged human imunodeficiency virus type 1 isolates. J Virol. 1995;69:4413–4422. doi: 10.1128/jvi.69.7.4413-4422.1995. [DOI] [PMC free article] [PubMed] [Google Scholar]
- 66.Moore JP, Cao Y, Leu J, Qin L, Korber B, Ho DD. Inter- and intraclade neutralization of human immunodeficiency virus type 1: genetic clades do not correspond to neutralization serotypes but partially correspond to gp120 antigenic serotypes. J Virol. 1996;70:427–444. doi: 10.1128/jvi.70.1.427-444.1996. [DOI] [PMC free article] [PubMed] [Google Scholar]
- 67.Schmidtmayerova H, Sherry B, Bukrinsky M. Chemokines and HIV replication. Nature (Lond) 1996;382:767. doi: 10.1038/382767a0. [DOI] [PubMed] [Google Scholar]
- 68.Arenzana-Selsdedos F, Virellzier J, Rousset D, ClarkLewis I, Loetscher P, Moser M, Baggiolini M. HIV blocked by chemokine antagonist. Nature (Lond) 1996;383:400. doi: 10.1038/383400a0. [DOI] [PubMed] [Google Scholar]
- 69.Atchison RE, Gosling J, Monteclaro FS, Franci C, Digilio L, Charo IF, Goldsmith MA. Multiple extracellular elements of CCR5 and HIV-1 entry: dissociation from response to chemokines. Science (Wash DC) 1996;274:1924–1926. doi: 10.1126/science.274.5294.1924. [DOI] [PubMed] [Google Scholar]
- 70.Farzan, M., H. Choe, K.A. Martin, Y. Sun, M. Sidelko, C.R. Mackay, W. Newman, N.P. Gerard, J. Sodroski, and C. Gerard. 1997. MIP-1β-mediated signaling and HIV-1 entry are independent functions of the chemokine receptor CCR5. J. Biol. Chem. In press. [DOI] [PubMed]