T-type Ca2+ current as a trigger for Ca2+ release from the sarcoplasmic reticulum in guinea-pig ventricular myocytes (original) (raw)
Abstract
- We have investigated whether Ca2+ entry through T-type Ca2+ channels participates in triggering Ca2+ release from the sarcoplasmic reticulum (SR) in single guinea-pig ventricular myocytes (whole-cell voltage clamp, K5 fura-2 as [Ca2+]i indicator; all monovalent cations replaced by impermeant ions to record uncontaminated Ca2+ currents; T = 23 or 36 °C).
- T-type Ca2+ currents were elicited from a holding potential of -90 mV during steps to -50 to -20 mV. For steps to -50 mV, very small [Ca2+]i transients could be recorded with high loading of the SR (peak Δ[Ca2+]i, 67 ± 41 nM; n = 9).
- For steps to -40, -30 and -20 mV, we compared the amplitude of Ca2+ release for a holding potential of -50 mV with L-type Ca2+ current only to Ca2+ release for a holding potential of -90 mV with both T- and L-type Ca2+ current. Significantly more Ca2+ release was observed with T-type current present, and both the T-type current and the additional Ca2+ release were suppressed by 50 μM NiCl2.
- Ca2+ influx through T-type Ca2+ channels triggered less Ca2+ release than a comparable Ca2+ influx through L-type Ca2+ channels.
- Rapid block of T-type Ca2+ current during the action potential (50 μM NiCl2 during steady-state stimulation at 1 or 2 Hz) did not immediately reduce Ca2+ release, although a small decrease was observed after longer application.
- We conclude that T-type Ca2+ current can trigger Ca2+ release from the SR albeit less efficiently than L-type Ca2+ current. T-type current is most likely to provide only a small contribution to the trigger for Ca2+ release in normal conditions. These results support the hypothesis that L-type Ca2+ channels have a privileged role in excitation-contraction coupling.
The role of Ca2+ entry through the L-type Ca2+ channels as a trigger for Ca2+ release from the sarcoplasmic reticulum (SR) is well established (for review see e.g. Callewaert, 1992). Because the L-type Ca2+ channel or dihydropyrydine receptor is located close to the Ca2+ release channel (Wibo, Bravo & Godfraind, 1991; Carl et al. 1995) it has been proposed that one Ca2+ channel and associated release channels act as small units for release; activity of such small release units has been experimentally demonstrated (Cannell, Cheng & Lederer, 1995; Lopez-Lopez, Shacklock, Balke & Wier, 1995) and has been described in mathematical models (Stern, 1992; Wier, Egan, Lopez-Lopez & Balke, 1994). Additional trigger mechanisms have been proposed. Ca2+ entry via the Na+-Ca2+ exchanger can trigger Ca2+ release during very strong depolarizations (Nuss & Houser, 1992; Levi, Spitzer, Kohmoto & Bridge, 1994; Vornanen, Shepherd & Isenberg, 1994), although the efficiency is lower than for L-type Ca2+ current (_I_Ca,L; Sham, Cleeman & Morad, 1995; Adachi Akahane, Lu, Li, Frank, Philipson & Morad, 1997; Sipido, Maes & Van de Werf, 1997). Reverse mode Na+-Ca2+ exchange as a consequence of subsarcolemmal accumulation of Na+ during activation of the Na+ current has also been proposed to trigger release (Leblanc & Hume, 1990; Lipp & Niggli, 1994), but results to the contrary have been reported (Sham, Cleemann & Morad, 1992; Bouchard, Clark & Giles, 1993; Sipido, Carmeliet & Pappano, 1995; Cannell, Grantham, Main & Evans, 1996). Ca2+ entry seems to be a requirement for the triggering of Ca2+ release in cardiac muscle, and little evidence has been found for a charge-coupled release mechanism. In one report on contractions maintained in very low, i.e. 0.05 mm, [Ca2+]o and with activation of contraction in the apparent absence of _I_Ca,L, the existence of a pure voltage-dependent release mechanism has been proposed (Ferrier & Howlett, 1995); data supporting a similar hypothesis were presented recently by Hobai et al. (1997).
Another source of trans-sarcolemmal Ca2+ influx is T-type Ca2+ current (for review of T-type currents in cardiac cells, see Vassort & Alvarez, 1994). T-type current activates at a more negative potential than L-type current, requires a more negative holding potential, and typically has fast inactivation. The density is high in pacemaking and conducting tissues (Hagiwara, Irisawa & Kameyama, 1988; Tseng & Boyden, 1989; Zhou & Lipsius, 1994). In these cells T-type currents may contribute to pacemaker activity (Hagiwara et al. 1988; Doerr, Denger & Trautwein, 1989; Zhou & Lipsius, 1994), and block of T-type current is a potential target for anti-arrhythmic drugs (Cohen, Spires & Van Skiver, 1992). The role of T-type currents in ventricular cells is less clear. Macroscopic T-type Ca2+ currents are of much smaller amplitude and shorter duration than L-type Ca2+ currents, rendering the total Ca2+ influx via this pathway much smaller than for L-type current (Balke, Rose, Marban & Wier, 1992; Rose, Balke, Wier & Marban, 1992). This and the low density of T-type channels render them unlikely candidates to contribute to Ca2+ release. However, the single channel conductance in 10 mm Ca2+ of 4-5 pS compares with the single channel conductance of 6.9 pS for L-type channels in similar conditions, while the mean open time is longer (Balke et al. 1992; Rose et al. 1992). Since the distribution of T-type Ca2+ channels is unknown, it cannot be excluded that they could participate in triggering release if they are located close to Ca2+ release channels. In rabbit cardiac Purkinje cells, T-type Ca2+ current apparently contributed to shortening during depolarizing steps of low amplitude (Zhou & January, 1994). Also in cultured skeletal muscle cells, Ca2+ entry as well as Ca2+ release triggered by T-type Ca2+ current has been described (Garcia & Beam, 1994).
In the present study we have investigated whether T-type Ca2+ current could trigger Ca2+ release in guinea-pig ventricular myocytes. We have therefore examined Ca2+ release in conditions designed to exclude pathways for Ca2+ entry except T-type Ca2+ channels. Since the Ca2+ load of the sarcoplasmic reticulum can influence the release mechanism, we have studied Ca2+ release for different degrees of Ca2+ loading of the SR.
METHODS
Cell isolation
Single guinea-pig ventricular myocytes were isolated enzymatically as previously described (Sipido, Callewaert & Carmeliet, 1995_a_). Guinea-pigs of 250-300 g of either sex were killed by an overdose of pentobarbitone (120 mg i.p.). The heart was quickly removed, and the aorta cannulated. The heart was perfused retrogradely on a Langendorff apparatus with a Ca2+-free Tyrode solution for 7 min, followed by perfusion with collagenase (0.7 mg ml−1, Boehringer Mannheim, Germany) and protease XIV (0.8 mg ml−1, Sigma). The enzyme solution was washed out with a Tyrode solution containing 0.18 mm CaCl2. The tissue was dissociated and cells were resuspended in normal Tyrode solution and stored at room temperature. Cell isolation routinely yielded 40-60% of viable rod-shaped cells.
Voltage clamp and [Ca2+]i measurements
The experimental set-up was built around an inverted microscope (Nikon Diaphot). The whole-cell variant of the patch clamp technique was used. Pipettes were pulled from borosilicate glass and had resistances between 1.8 and 2.4 MΩ, when filled with 130 mm CsCl. Membrane currents were measured with a Axopatch 1D amplifier (Axon Instruments), and read into a PC for later analysis. The data acquisition program also controlled the command potential and various components of the [Ca2+]i measurement system (Fastlab software, Indec Systems, Sunnyvale, CA, USA).
The pipette solution contained 50 μM K5 fura-2 (Molecular Probes). The set-up for fluorescence measurement has been described before (Sipido et al. 1995_a_). The background-corrected ratio was calibrated to obtain [Ca2+]i, and calibration parameters were obtained from in vivo calibration. For some experiments [Ca2+]i was measured with a combination of 30 μM fluo-3 and 70 μM fura-red (both from Molecular Probes); this system and calibration procedures have also been described before (Lipp & Niggli, 1993; Sipido et al. 1997). With fluo-3 alone, the changes in fluorescence were normalized to baseline values (Lipp & Niggli, 1994).
To evaluate Ca2+ release, we measured [Ca2+]i at 20 ms after the depolarizing trigger pulse, or we calculated the peak derivative of the [Ca2+]i transient. This measurement will more closely reflect the flux of Ca2+ release than the peak [Ca2+]i value, since the flux is a function of the rate of rise of [Ca2+]i (Sipido & Wier, 1991; Wier et al. 1994). To calculate the derivative, a simultaneous smoothing of the signal was performed (Origin, Microcal Software Inc., Northampton, MA, USA). This method of smoothing is comparable to the method described and illustrated previously, and did not visibly distort the time course of the rising phase of the [Ca2+]i transient (Sipido & Wier, 1991).
Pooled results are given as means ±s.e.m.; Student's paired t test was performed to compare results obtained within the same cell; P <0.05 was considered significant.
Solutions
The control external solution contained (mm): 130 NaCl, 10 CsCl, 10 Hepes, 10 glucose, 0.5 MgCl2, 1.8 CaCl2; pH 7.40 (adjusted with NaOH). In order to isolate Ca2+ currents from other membrane currents, all monovalent cations were substituted with impermeant ones. The pipette solution contained (mm): 110 _N_-Methyl-d-glucamine chloride (NMDGCl), 20 TEACl, 10 Hepes, 0.5 MgCl2, 5 MgATP, 0.05 K5 fura-2; pH 7.20 (adjusted with TEAOH). The external solution contained (mm): 130 TEACl (or 130 NMDGCl), 10 Hepes, 10 glucose, 0.5 MgCl2, 5.4 CaCl2; pH 7.40 (adjusted with TEAOH). With these external and internal solutions, all monovalent cation currents were effectively blocked, i.e. K+ currents (_I_K), Na+ current (_I_Na), Na+-Ca2+ exchange current (_I_Na-Ca), and the non-specific cation current. Therefore the total membrane current represented almost exclusively Ca2+ current, both L-type and T-type, depending on the voltage protocol. External solution changes were performed with a fast perfusion system. From the block of the inward rectifier, _I_K1, at a holding potential of -50 mV by application of CsCl (10 mm) or BaCl2 (0.5 mm) we measured a solution exchange time of ∼2 s. The absence of Na+, and of Na+-Ca2+ exchange was confirmed by the following observations: disappearance of _I_Na, absence of voltage-dependent relaxation of [Ca2+]i and absence of voltage-dependent increase of [Ca2+]i at positive potentials. All experiments in Na+-free solutions were performed at 22-23°C.
For recording action potentials, a K+-based pipette solution was used (mm): 120 potassium aspartate, 20 KCl, 10 Hepes, 5 MgATP, 0.5 MgCl2, 10 NaCl, 0.03 fluo-3, and 0.07 fura-red; pH 7.20 (adjusted with KOH). The external solution for these experiments was a Tyrode solution (mm): 137 NaCl, 5.4 KCl, 10 Hepes, 10 glucose, 0.5 MgCl2, 1.8 CaCl2; pH 7.40 (adjusted with NaOH); these experiments were performed at 36°C.
RESULTS
Voltage dependence of T-type Ca2+ currents
The voltage dependence and amplitude of T-type currents was investigated by comparing the currents obtained during depolarizing steps from a holding voltage of -90 mV to steps from a holding voltage of -50 mV (Balke et al. 1992) (Fig. 1_A_, top). The steps were preceded by six conditioning steps from -90 to 0 mV, and were obtained after 20 s in Na+-free solutions. The difference current between records obtained at the two holding potentials is then the T-type Ca2+ current. A typical example is shown in Fig. 1_A_. The voltage dependence of the peak currents and of the T-type (difference) currents for five cells studied with this protocol is shown in Fig. 1_B_. From these results it can be seen that the largest currents are elicited at -30 mV, a potential at which a portion of L-type Ca2+ channels is also already activated. At -50 mV, the amplitude of T-type currents is small, but no L-type Ca2+ current is activated. We therefore first examined whether we could observe Ca2+ release triggered by T-type current at this potential.
Figure 1. Voltage dependence of T-type Ca2+ currents.
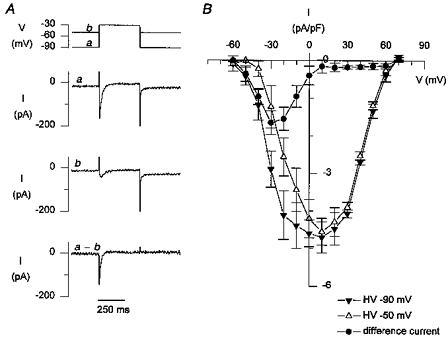
A, representative example of membrane currents during a test pulse to -30 mV from a holding voltage of -90 mV (a) or -50 mV (b); the difference current (_a_-b) is the T-type Ca2+ current. B, peak current-voltage relation for 6 cells (means ±s.e.m.).
Is Ca2+ release triggered by T-type Ca2+ current at -50 mV?
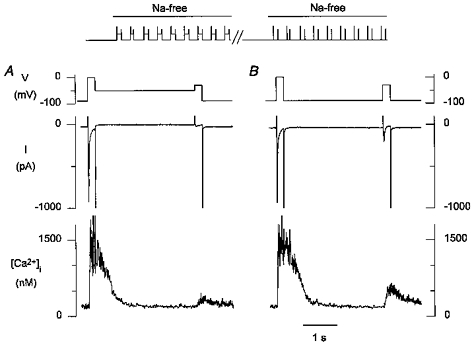
To examine whether Ca2+ release could be triggered by T-type Ca2+ current at -50 mV, we recorded [Ca2+]i transients during steps from -90 to -50 mV for different degrees of loading of the SR. After switching to Na+-free solution a double pulse protocol was started, consisting of a 210 ms step to 0 mV, activating L-type Ca2+ current, followed after 4 s by a step to -50 mV, activating T-type current; this protocol was repeated every 10 s (Fig. 2, top). Because of the near absence of Ca2+ efflux from the cell in Na+-free solutions, the repeated Ca2+ influx, predominantly via L-type channels, leads to progressive Ca2+ loading of the SR. Typical records obtained during such a protocol are shown in Fig. 2_A_-C. The progressive loading of the SR is evident from the increasing amplitude of Ca2+ release during the step to 0 mV. With a low loading of the SR, no [Ca2+]i transient is seen during the step to -50 mV; with high loading of the SR (Fig. 2_C_), a small [Ca2+]i transient is evoked during the step to -50 mV with an amplitude of ∼50 nM. In eight cells, the amplitude of the [Ca2+]i transient associated with the T-type current at -50 mV was 67 ± 41 nM. This small [Ca2+]i transient is most likely to represent Ca2+ release from the SR, and not just Ca2+ influx, since no increase in [Ca2+]i was observed during steps from -90 to -50 mV if 10 mm caffeine was added to the Na+-free solution to disable Ca2+ release (n = 2, results not shown). On returning to Na+-containing solutions, large inward Na+-Ca2+ exchange currents are evident, during as well as following the depolarizing steps, effectively reducing the Ca2+ load of the cell (Fig. 2_D_). During the step to -50 mV a Na+ current is activated which is now associated with a larger and more rapid [Ca2+]i transient of 120 nM. Despite reduced Ca2+ loading during subsequent steps, this _I_Na-associated [Ca2+]i transient remains present. Similar results were obtained in eight cells; the amplitude of the [Ca2+]i transient on return to normal Tyrode solution and activation of the Na+ current was 156 ± 62 nM.
Figure 2. T-type Ca2+ currents at -50 mV evoke a small Ca2+ release.
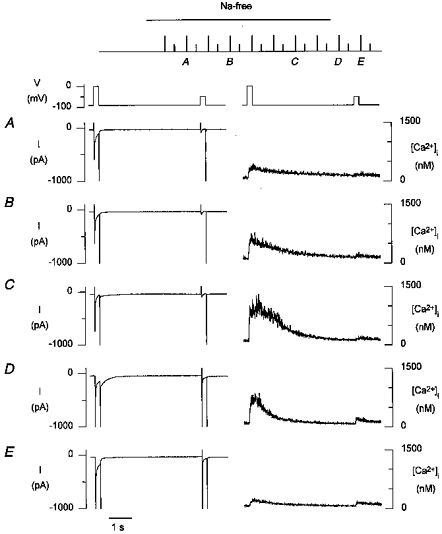
Top, after switching to Na+-free solutions, a double pulse protocol consisting of a 210 ms step from -90 to 0 mV, followed after 4 s by a 210 ms step to -50 mV was repeated every 10 s. Current and [Ca2+]i records at the indicated time points are shown on an expanded time scale below. _A_-C, in Na+-free solutions, with increasing Ca2+ load of the SR evident during the step to 0 mV. D and E, on returning to normal Tyrode solution.
Ca2+ release during maximally activated T-type Ca2+ currents
Larger T-type Ca2+ currents are typically activated at more positive potentials where activation, however, overlaps with that of L-type Ca2+ currents. Although ideally one would like to see Ca2+ release associated with T-type currents only, we were unable to examine Ca2+ release after block of L-type currents, because in those conditions (i.e. in the absence of Ca2+ influx via L-type channels and via Na+-Ca2+ exchange) the SR could not be properly loaded. We therefore compared Ca2+ release elicited by L-type current only with that elicited by both T- and L-type Ca2+ current. As for the previous experiments, a double pulse protocol consisting of a step to 0 mV followed by a test step to -30 mV was repeated every 10 s; the holding voltage between the two pulses was either -90 or -50 mV (Fig. 3, top). When comparing release at the step to -30 mV for both holding voltages, the amplitude of the [Ca2+]i transient during the steps to 0 mV was used to ensure that the SR Ca2+ load was comparable. A typical example is shown in Fig. 3. The L-type Ca2+ current at -30 mV is small (Fig. 3_A_), but from a holding voltage of -90 mV a robust T-type current is observed, and the [Ca2+]i transient associated with this holding voltage is notably larger than with L-type Ca2+ current only. In six cells the Δ[Ca2+]i at 20 ms after the depolarizing step was 147 ± 39 nM for L-type current only vs. 226 ± 39 nM for T- and L-type current (P < 0.05).
Figure 3. At -30 mV T-type Ca2+ current contributes to the trigger for Ca2+ release.
Top, after switching to Na+-free solutions, a double pulse protocol consisting of a 210 ms step from -90 to 0 mV, returning to a holding potential of -50 mV for 3 s, and followed by a 210 ms step to -30 mV was repeated every 10 s; the cell was then returned to the control external solution for at least 30 s. The protocol was repeated, but now the membrane potential between the pulses was -90 mV. A, from -50 mV a small [Ca2+]i transient is seen during the step to -30 mV with activation of the L-type current; the [Ca2+]i transient during the step from -90 to 0 mV indicates that the SR was well loaded. B, from -90 mV a much larger [Ca2+]i transient is seen during the step to -30 mV with activation of both T- and L-type currents; the [Ca2+]i transient during the step from -90 to 0 mV indicates that the SR was loaded to a similar extent as during the records obtained from -50 mV.
We investigated whether this increase in the [Ca2+]i transient was related to T-type current-triggered Ca2+ release, and not due to Ca2+ influx only, by comparing [Ca2+]i transients before and after disabling Ca2+ release with 10 mm caffeine; Fig. 4 (top) illustrates the experimental protocol. Figure 4_A_ shows the [Ca2+]i transients during a step from -50 to -30 mV (left panels), and during a step from -90 to -30 mV (middle panels), during the third double pulse protocol in Na+-free solutions. The right panel shows the difference current, and the difference [Ca2+]i transient. The latter has a rapid rising phase, indicative of Ca2+ release. After a 45 s rest in normal Tyrode solution, the cell was superfused with 10 mm caffeine to disable Ca2+ release from the SR. The double pulse protocols in Na+-free solution were subsequently repeated in the continued presence of caffeine. Membrane currents and [Ca2+]i transients of the third double pulse in Na+-free solution with caffeine are shown in Fig. 4_B_. At the third pulse in Na+-free solution, resting [Ca2+]i had already increased substantially, due to the lack of effective Ca2+ uptake into the SR. [Ca2+]i transients on depolarization were now related to Ca2+ influx only, and were slow and of low amplitude (Fig. 4, left and middle). The difference [Ca2+]i transient (Fig. 4, right), related to Ca2+ influx via the T-type Ca2+ channel, was also slow and of lower amplitude. Similar results were obtained in seven other cells studied with caffeine, and in three cells studied with ryanodine, and confirm that the increase in [Ca2+]i transient with T-type current indeed results from triggered release, and not from influx. It should be noted that the [Ca2+]i transient seen with caffeine was not representative of the contribution of Ca2+ influx to the [Ca2+]i transient in the absence of caffeine, since the absence of Ca2+ buffering by the SR greatly exaggerated the increase in [Ca2+]i due to Ca2+ influx (see also Sipido & Wier, 1991).
Figure 4. The increase in [Ca2+]i transient with T-type current is due to Ca2+ release from the SR, and not to Ca2+ entry.
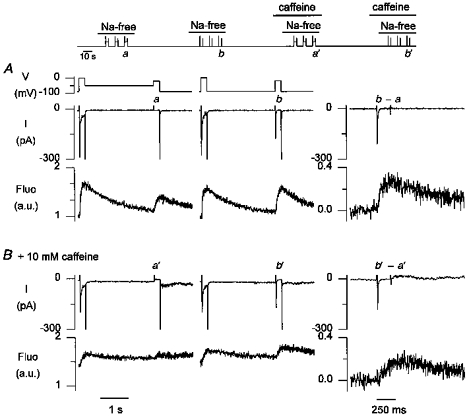
Top, records obtained in Na+-free solution are compared with those obtained after suppression of Ca2+ release from the SR with caffeine, but with similar duration and conditioning in Na+-free solution. A, membrane currents and [Ca2+]i transients, illustrated as the fluo-3 signal, normalized to baseline values, in arbitrary units (a.u.), during the third pulses in Na+-free solution. Traces marked a were obtained during a step from -50 to -30 mV, and those marked b during a step from -90 to -30 mV; the [Ca2+]i transients during the step to 0 mV are comparable indicating comparable loading of the SR. _b_-a is the additional current and Ca2+ release with a holding potential of -90 mV; note the difference in time scale as only the pulse to -30 mV is shown. B, membrane currents and [Ca2+]i transients, illustrated as the fluo-3 signal, normalized to baseline values in normal Tyrode solution, in arbitrary units (a.u.), during the third pulses in Na+-free solution but now in the presence of 10 mm caffeine. Traces marked _a_′ were obtained during a step from -50 to -30 mV, those marked _b_′ during a step from -90 to -30 mV. _b_′-_a_′ is the additional current and Ca2+ release with a holding potential of -90 mV; note the difference in time scale as only the pulse to -30 mV is shown.
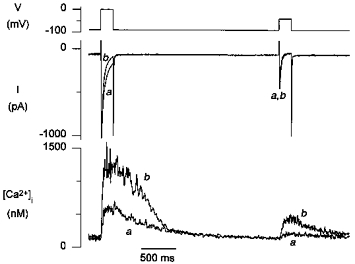
A T-type current-related triggered Ca2+ release is expected to increase with increasing Ca2+ loading of the SR. In Fig. 5, the amplitude of the additional [Ca2+]i transient related to T-type Ca2+ current is calculated as the difference between the [Ca2+]i transient from the holding voltage of -90 mV and the [Ca2+]i transient from the holding voltage at -50 mV for low (_b_-a) and high (_d_-c) levels of loading of the SR. Even with a small SR Ca2+ load, the small T-type current-associated [Ca2+]i transient had a rapid rising phase, indicative of triggered Ca2+ release. With the high SR Ca2+ load, the amplitude of this T-type current-associated transient increased. The observation that this larger transient was rapidly rising, in contrast to the transients seen with caffeine, is consistent with triggered Ca2+ release. This example illustrates that the amplitude of the additional, T-type current-associated Ca2+ release increases as the level of loading of the SR increases.
Figure 5. The increase in [Ca2+]i transient with T-type current is proportional to the SR Ca2+ load.
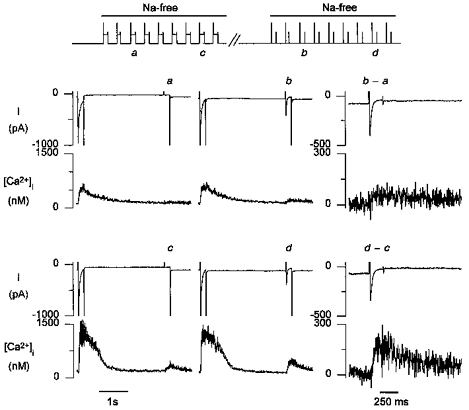
a and b, membrane currents and [Ca2+]i transients during a step to -40 mV with moderate loading of the SR, as obtained after 3 pulses in Na+-free solution; the increase in the [Ca2+]i transient from the holding voltage of -90 versus -50 mV is small. _b_-a is the additional current and Ca2+ release with a holding potential of -90 mV; only the pulse to -40 mV is shown on an expanded time scale. c and d are with higher loading of the SR, as evidenced from the large [Ca2+]i transient during the pulse to 0 mV. _d_-c, the difference in Ca2+ release for a holding voltage of -90 versus -50 mV is much larger with the higher SR load, despite comparable Ca2+ entry.
We checked that this additional Ca2+ release was indeed related to T-type current, and not to some remaining Na+ current. This current was recorded in the absence of [Na+]o and was therefore unlikely to be Na+ current; this was further confirmed by the fact that the current could not be suppressed by 100 μM TTX (n = 3, results not shown). We next examined its sensitivity to low concentrations of NiCl2, a known blocker of T-type Ca2+ channels (Hagiwara et al. 1988). The protocol was as described before, except that now for the holding voltage of -90 mV, the same protocol was repeated in the presence of 50 μM NiCl2. A typical example is shown in Fig. 6_A_. The left and middle panel are as in Fig. 3, again illustrating that Ca2+ release is larger with both T- and L-type currents than with L-type current alone; the test potential was -20 mV. The right panel illustrates that both the additional Ca2+ release and the T-type current were blocked by NiCl2, while L-type Ca2+ current was not affected. The pooled results of six cells in which NiCl2 was tested during steps to -20 mV are shown in Fig. 6_B_. These data illustrate that the difference in Ca2+ release for L-type Ca2+ current only versus L- and T-type current was significant, and that this additional release was suppressed after block of T-type Ca2+ current by NiCl2.
Figure 6. T-type Ca2+ current at -20 mV and the Ca2+ release it triggers are blocked by 50 μM NiCl2.
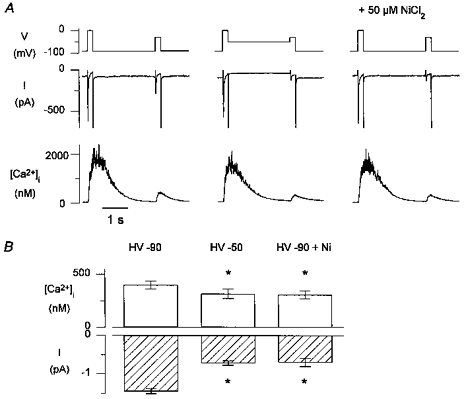
A, left, currents and [Ca2+]i transients with both T- and L-type current from -90 mV; middle, currents and [Ca2+]i transients with L-type current from -50 mV; right, currents and [Ca2+]i transients with L-type current only as T-type is suppressed by NiCl2. The records were obtained during repeated runs in Na+-free solutions as illustrated in Fig. 3 with interpulse voltages of -90 mV, -50 mV, or -90 mV with NiCl2; the pulse to 0 mV is shown to indicate that the degree of Ca2+ loading of the SR was comparable. B, pooled data of 6 cells tested at -20 mV. The peak inward current and the amplitude of the [Ca2+]i transient at 20 ms after the depolarizing step is significantly smaller with L-type current only, when T-type currents are suppressed either by the holding voltage (HV) of -50 mV, or with NiCl2. *P <0.05.
Relative efficiency of T-type current as the trigger for Ca2+ release
To examine the contribution of T-type current to the triggering of Ca2+ release, the protocol shown in Fig. 3 was tested for a range of different potentials in five cells. The pooled results are shown in Fig. 7. Figure 7_A_ shows the derivative of the [Ca2+]i transient as a parameter of Ca2+ release, and Fig. 7_B_ shows the mean peak inward currents. At -20 mV, Ca2+ release in the presence of both T-type and L-type current was significantly larger than for L-type current alone. Also at -30 mV, T-type currents almost doubled the Ca2+ influx, and a significantly larger Ca2+ release was seen. However, this increase in Ca2+ release appears to be small in relation to the increase in Ca2+ influx, and the increase in Ca2+ release seen when the L-type Ca2+ current was doubled by increasing the depolarization to -20 mV was much larger.
Figure 7. Contribution of T-type Ca2+ current to triggered Ca2+ release.
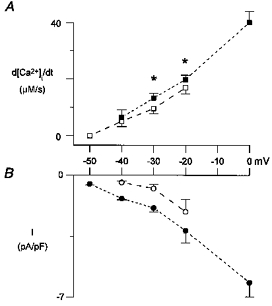
Pooled data of 5 cells, means ±s.e.m.A, the peak value of the derivative of the [Ca2+]i transient. ▪, a holding voltage of -90 mV with both T- and L-type currents activated; □, a holding voltage of -50 mV with L-type current only. B, peak inward currents. •, a holding voltage of -90 mV; ○, a holding voltage of -50 mV. For the data points at 0 mV, the contribution of T-type current is negligible. *P <0.05.
Similarly, at -50 mV the influx through T-type channels at the whole-cell level was comparable in amplitude to Ca2+ influx through L-type channels at -30 mV, and yet practically no release was seen (see also Fig. 2). These data suggest that although Ca2+ influx through T-type channels can contribute to the triggering of Ca2+ release, the efficiency of T-type current as a trigger is less than for L-type current. This is further illustrated by the example in Fig. 8, showing that at -40 mV, T-type current far exceeded L-type current at -30 mV, and yet release was significantly less. In addition, the Ca2+ released by T-type currents was small compared with what can be released by fully activated L-type currents (see Fig. 7 at 0 mV). The rise time of [Ca2+]i transients triggered by T-type Ca2+ current, as with the one illustrated in Fig. 7_A_, and the difference transients in Figs 4 and 5, was between 100 and 150 ms, while the rise time of [Ca2+]i transients triggered by L-type Ca2+ currrent at 0 mV typically was less than 50 ms.
Figure 8. L-type current is more efficient than T-type current as a trigger for release.
A, with predominantly T-type current activated during a step from -90 to -40 mV, a modest [Ca2+]i transient was evoked. B, in the same cell, L-type current of comparable peak amplitude evoked a larger [Ca2+]i transient.
These data suggest that when robust L-type currents are activated during the action potential, the contribution of T-type current to triggering of Ca2+ release will be small. We therefore further examined the contribution of T-type current to the trigger for release in more physiological conditions (Fig. 9).
Figure 9. Rapid block of T-type current does not immediately affect Ca2+ release during action potentials.
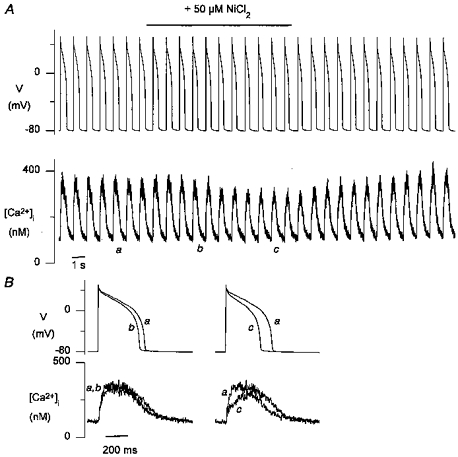
A, continuous record of action potentials and [Ca2+]i transients during 1 Hz stimulation; 50 μM NiCl2 was applied for 12 s during which a steady state was reached. B, action potentials and [Ca2+]i transients on expanded time scale, taken before (a), immediately after solution exchange (b), and at steady state (c).
With a potassium aspartate-based pipette solution, action potentials were recorded during steady-state stimulation at 1 or 2 Hz, at 36°C and in a normal Tyrode solution with 1.8 mm [Ca2+]o; 50 μM NiCl2 was rapidly applied for 12 s. Immediately after the solution exchange (2 s), a small decrease in action potential duration was seen; this did not affect Ca2+ release. Only with continued exposure did a small decrease in Ca2+ release occur and the action potential duration further decreased. These changes were reversible on washout. Similar results were obtained in four other cells during 2 Hz stimulation; the action potential duration at 50% depolarization was 227 ± 39 ms in control, 211 ± 40 ms immediately after switching to NiCl2, and 183 ± 36 ms in steady-state conditions (both P <0.05 vs. control); Δ[Ca2+]i at 20 ms was 206 ± 23 nM in control, 208 ± 20 nM immediately after switching to NiCl2 (n.s.), and 157 ± 19 nM in steady-state conditions (P < 0.05 vs. control).
Ca2+-dependent inactivation of T-type Ca2+ current?
In our experiments we also examined whether Ca2+ release affects the inactivation of T-type currents as described for L-type Ca2+ current (Sham et al. 1995; Sipido et al. 1995_a_).
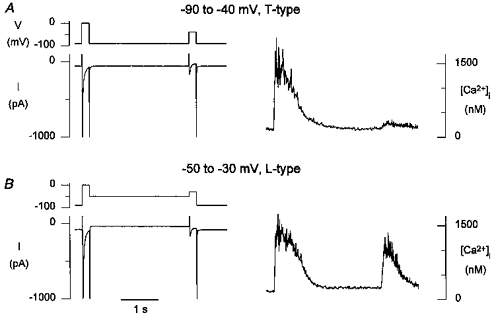
Figure 10 illustrates the time course of both L- and T-type currents during steps to 0 and -40 mV, respectively, for low and high loading states of the SR, obtained during a repeated double pulse protocol in Na+-free solutions, as illustrated in Fig. 2. While the inactivation of L-type current was much faster for the larger Ca2+ release, the time course of the T-type current was not affected. Similar results were obtained in eight other cells.
Figure 10. Ca2+-dependent inhibition of L-type, but not of T-type, Ca2+ current during Ca2+ release from the SR.
Voltage protocol and currents and [Ca2+]i transients during the 3rd (a) and 7th (b) pulses of a repeat protocol as shown in Fig. 3. With the larger Ca2+ release (b), the L-type Ca2+ current showed more inactivation, but the time course of the T-type current was not affected.
DISCUSSION
In the present study we have shown that Ca2+ entry through T-type Ca2+ channels can trigger Ca2+ release from the SR. However, T-type Ca2+ current appears to be less efficient than L-type Ca2+ current, and its contribution to the trigger for Ca2+ release during the action potential is likely to be small.
Properties of T-type Ca2+ current-related release
In our study we found that for a similar whole-cell Ca2+ influx, more Ca2+ release was triggered if the influx was through L-type channels than through T-type channels. This lower apparent efficiency is most likely to be related to a lower increase in local [Ca2+] near the release channel with T- than with L-type channels. Several factors may contribute to this. Conductance on the single channel level is less for T-type channels than for L-type channels; this factor may, however, not be that important since the current amplitude of the T-type channel when open at -20 mV is similar to the current amplitude of an L-type channel activated at 0 mV (Balke et al. 1992; Rose et al. 1992). Further, compared with L-type Ca2+ channels, T-type Ca2+ channels are less likely to reopen after a first activation, favouring a rapid decrease of local [Ca2+]. At present the localization of T-type Ca2+ channels is unknown, and it may therefore be that they are not as closely associated with the Ca2+ release channel as the dihydropyridine receptor/L-type Ca2+ channels (Carl et al. 1995).
Study of the localization of T-type channels has been hampered by the lack of specific toxins or drugs, precluding binding studies. Likewise, the molecular structure of the cardiac T-type channel has not yet been identified. A low-voltage activated Ca2+ channel resulted from expression in oocytes of the α1E-subunit identified in rat brain, making this a possible candidate for T-type Ca2+ channels (Soong, Stea, Hodson, Dubel, Vincent & Snutch, 1993). The lack of inactivation by permeating Ca2+ (Bean, 1985) as well as by Ca2+ release from the SR (Fig. 9) also distinguishes the cardiac T-type Ca2+ channel at the α-subunit level from cardiac L-type Ca2+ channels. Ca2+-dependent inactivation of L-type channels has been linked to the COOH terminal of the α1C-subunit, while it was shown that the α1E-subunit lacks Ca2+-dependent inactivation (de Leon et al. 1995). Recently it was also reported that the α1E-subunit was expressed in atrial cells, increasing the evidence for α1E as a possible candidate for T-type channels (Piedras-Renteria & Best, 1997). In addition to differences in the α-subunit, specific characteristics of the T-type Ca2+ channels could result from modulation by specific β or other subunits (Lacerda, Perez Reyes, Wei, Castellano & Brown, 1994).
Contribution of T-type Ca2+ current to the trigger for Ca2+ release
Previous studies of Ca2+ release associated with activation of the Na+ current, _I_Na, during depolarizing steps from -90 mV to -50 or -40 mV proposed that reverse mode Na+-Ca2+ exchange provided the trigger for this release (Leblanc & Hume, 1990; Lipp & Niggli, 1994), while other studies, including ours, have argued that spurious activation of L-type Ca2+ channels was responsible for the trigger (Sham et al. 1992; Bouchard et al. 1993; Sipido, Carmeliet & Pappano, 1995_b_; Cannell et al. 1996). Another possible hypothesis, based on the findings of these latter studies, was that activation of T-type Ca2+ channels was responsible for the release seen with _I_Na. The data presented in Fig. 2 indicate that the [Ca2+]i transient in the presence of _I_Na (Fig. 2_D_) is very different from the one associated with T-type current (Fig. 2_C_) at the same potential: it has a more rapidly rising phase indicating that more Ca2+ is released, and it remains present with less loading of the SR (Fig. 2_E_). Even if the voltage escape during _I_Na were to activate some T-type channels in addition to L-type channels, the contribution of T-type to this trigger would still be small (see e.g. at -20 mV in Fig. 7), rendering it unlikely that T-type currents are responsible for the _I_Na-associated release.
The contractions activated from negative holding potentials reported by Ferrier & Howlett (1995) could partially be explained by T-type channel activation, but only for those contractions activated in the potential range below 0 mV; their finding of contractions at more positive potentials, and of ryanodine-insensitive contractions from holding voltages of -40 mV cannot be further explained by the present study.
Several properties of T-type Ca2+ current as a trigger indicate that the contribution of T-type current to the triggering of Ca2+ release in physiological conditions is likely to be small. Compared with the amplitude of the L-type current and Ca2+ release which is normally activated during depolarization to values around 0 to +10 mV, the Ca2+ release associated with T-type currents is small. During the action potential, the amplitude of the Ca2+ influx via T-type Ca2+ channels will be much smaller than via L-type Ca2+ channels. Block of T-type current during action potential recording in physiological conditions showed no immediate but only a delayed decrease in Ca2+ release with maintained block. These data indicate that the effect is related to a secondary decrease in Ca2+ load of the SR, rather than to a decrease in trigger Ca2+, as the action potential shortening will promote loss of Ca2+ during the prolonged diastolic interval at negative membrane potentials. Such effects are not related to partial block of L-type current since we saw no change in L-type current with this dose of NiCl2 (Fig. 6), and since block of L-type Ca2+ channels in similar conditions immediately decreases Ca2+ release and induces loss of the action potential plateau (Sipido et al. 1995_b_). We cannot at present exclude the possibility that the low dose of NiCl2 also affected the Na+ current, but in previous experiments the effect of Na+ channel block was very different, with an immediate and pronounced decrease in the overshoot of the action potential, and an initial increase in Ca2+ release from the SR (Sipido et al. 1995_b_). The effects of the low dose of NiCl2 during action potentials strongly resemble the recently reported effects of mibefradil (Bénardeau & Ertel, 1997; Mangoni, Leuranguer, Bourinet, Nargeot & Richard, 1997). This new drug, which is still under investigation, was reported to have a high affinity for T-type channels in vascular smooth muscle cells, although partial block of L-type current was still observed (Mishra & Hermsmeyer, 1994). In cardiac cells, the block of T-type channels over L-type channels is most pronounced at negative holding potentials (Mangoni et al. 1997). The reduction of action potential duration induced by mibefradil is very similar to the reduction we have observed with 50 μM NiCl2 (Bénardeau & Ertel, 1997). Our results indicate that such a drug would not have the pronounced negative inotropic effects of typical L-type Ca2+ channel blockers.
While our results indicate that T-type current has a minor role in the triggering of Ca2+ release in normal ventricular myocytes, it may become more important in ventricular hypertrophy where an increase in T-type current was reported (Nuss & Houser, 1993). In addition stimulation of the channel by endothelin, ouabain, or Ca2+ (reviewed in Vassort & Alvarez, 1994) may enhance the contribution of T-type current to [Ca2+]i regulation. Normal pacemaker and conducting tissue also has a higher density of T-type Ca2+ channels. T-type currents have been implicated in diastolic depolarization (Hagiwara et al. 1988; Doerr et al. 1989; Zhou & Lipsius, 1994); if they contributed to Ca2+ release in these cells as reported for Purkinje cells (Zhou & January, 1994), they would also contribute indirectly to the electrical activity through activation of [Ca2+]i-dependent membrane currents in these cells.
In conclusion, T-type Ca2+ current is a potential trigger for Ca2+ release from the SR, but its contribution in normal ventricular myocytes is minor. As a trigger T-type Ca2+ current is less efficient than L-type Ca2+ current, as was also recently described for reverse mode Na+-Ca2+ exchange (Sham et al. 1995; Adachi Akahane et al. 1997; Sipido et al. 1997). These results further emphasize the unique role of L-type Ca2+ current in the control of Ca2+ release from the SR in ventricular myocardium.
Acknowledgments
K. R. Sipido is a Postdoctoral Researcher of the Fund for Scientific Research (FWO), Belgium. The work was supported by a grant from the Bekales Research Foundation.
References
- Adachi Akahane S, Lu L, Li Z, Frank J S, Philipson K D, Morad M. Calcium signaling in transgenic mice overexpressing cardiac Na+-Ca2+ exchanger. Journal of General Physiology. 1997;109:717–729. doi: 10.1085/jgp.109.6.717. 10.1085/jgp.109.6.717. [DOI] [PMC free article] [PubMed] [Google Scholar]
- Balke C W, Rose W C, Marban E, Wier W G. Macroscopic and unitary properties of physiological ion flux through T-type Ca2+ channels in guinea-pig heart cells. Journal of Physiology. 1992;456:247–265. doi: 10.1113/jphysiol.1992.sp019335. [DOI] [PMC free article] [PubMed] [Google Scholar]
- Bean B P. Two kinds of calcium channels in canine atrial cells. Differences in kinetics, selectivity, and pharmacology. Journal of General Physiology. 1985;86:1–30. doi: 10.1085/jgp.86.1.1. [DOI] [PMC free article] [PubMed] [Google Scholar]
- Bénardeau A, Ertel E A. Effects of mibefradil (Ro 40–5967) on the action potential of isolated ventricular myocytes. Biophysical Journal. 1997;72:A46. (abstract) [Google Scholar]
- Bouchard R A, Clark R B, Giles W R. Role of sodium-calcium exchange in activation of contraction in rat ventricle. Journal of Physiology. 1993;472:391–413. doi: 10.1113/jphysiol.1993.sp019953. [DOI] [PMC free article] [PubMed] [Google Scholar]
- Callewaert G. Excitation-contraction coupling in mammalian cardiac cells. Cardiovascular Research. 1992;26:923–932. doi: 10.1093/cvr/26.10.923. [DOI] [PubMed] [Google Scholar]
- Cannell M B, Cheng H, Lederer W J. The control of calcium release in heart muscle. Science. 1995;268:1045–1049. doi: 10.1126/science.7754384. [DOI] [PubMed] [Google Scholar]
- Cannell M B, Grantham C J, Main M J, Evans A M. The roles of the sodium and calcium current in triggering calcium release from the sarcoplasmic reticulum. Annals of the New York Academy of Sciences. 1996;779:443–450. doi: 10.1111/j.1749-6632.1996.tb44819.x. [DOI] [PubMed] [Google Scholar]
- Carl S L, Felix K, Caswell A H, Brandt N R, Ball W J J, Vaghy P L, Meissner G, Ferguson D G. Immunolocalization of sarcolemmal dihydropyridine receptor and sarcoplasmic reticular triadin and ryanodine receptor in rabbit ventricle and atrium. Journal of Cell Biology. 1995;129:672–682. doi: 10.1083/jcb.129.3.673. [DOI] [PMC free article] [PubMed] [Google Scholar]
- Cohen C J, Spires S, van Skiver D. Block of T-type Ca channels in guinea pig atrial cells by antiarrhythmic agents and Ca channel antagonists. Journal of General Physiology. 1992;100:703–728. doi: 10.1085/jgp.100.4.703. [DOI] [PMC free article] [PubMed] [Google Scholar]
- De Leon M, Wang Y, Jones L, Perez Reyes E, Wei X, Soong T W, Snutch T P, Yue D T. Essential Ca2+-binding motif for Ca2+-sensitive inactivation of L-type Ca2+ channels. Science. 1995;270:1502–1506. doi: 10.1126/science.270.5241.1502. [DOI] [PubMed] [Google Scholar]
- Doerr T, Denger R, Trautwein W. Calcium currents in single SA nodal cells of the rabbit heart studied with action potential clamp. Pflügers Archiv. 1989;413:599–603. doi: 10.1007/BF00581808. [DOI] [PubMed] [Google Scholar]
- Ferrier G R, Howlett S E. Contractions in guinea-pig ventricular myocytes triggered by a calcium-release mechanism separate from Na+ and L-currents. Journal of Physiology. 1995;484:107–122. doi: 10.1113/jphysiol.1995.sp020651. [DOI] [PMC free article] [PubMed] [Google Scholar]
- Garcia J, Beam K G. Calcium transients associated with the T type calcium current in myotubes. Journal of General Physiology. 1994;104:1113–1128. doi: 10.1085/jgp.104.6.1113. [DOI] [PMC free article] [PubMed] [Google Scholar]
- Hagiwara N, Irisawa H, Kameyama M. Contribution of two types of calcium currents to the pacemaker potentials of rabbit sino-atrial node cells. Journal of Physiology. 1988;395:233–253. doi: 10.1113/jphysiol.1988.sp016916. [DOI] [PMC free article] [PubMed] [Google Scholar]
- Hobai I A, Howarth C, Pabbathi V, Dalton G, Hancox J, Ferrier G R, Levi A J. ‘Voltage-activated Ca release’ in rabbit, rat, and guinea-pig cardiac myocytes, and modulation by internal cAMP. Pflügers Archiv. 1997;435:164–173. doi: 10.1007/s004240050496. [DOI] [PubMed] [Google Scholar]
- Lacerda A E, Perez Reyes E, Wei X, Castellano A, Brown A M. T-type and N-type calcium channels of Xenopus oocytes: evidence for specific interactions with beta subunits. Biophysical Journal. 1994;66:1833–1843. doi: 10.1016/S0006-3495(94)80977-4. [DOI] [PMC free article] [PubMed] [Google Scholar]
- Leblanc N, Hume J R. Sodium current-induced release of calcium from cardiac sarcoplasmic reticulum. Science. 1990;248:372–376. doi: 10.1126/science.2158146. [DOI] [PubMed] [Google Scholar]
- Levi A J, Spitzer K W, Kohmoto O, Bridge J H B. Depolarization-induced Ca entry via Na-Ca exchange triggers SR release in guinea pig cardiac myocytes. American Journal of Physiology. 1994;266:H1422–1433. doi: 10.1152/ajpheart.1994.266.4.H1422. [DOI] [PubMed] [Google Scholar]
- Lipp P, Niggli E. Ratiometric confocal Ca2+-measurements with visible wavelength indicators in isolated cardiac myocytes. Cell Calcium. 1993;14:359–372. doi: 10.1016/0143-4160(93)90040-d. [DOI] [PubMed] [Google Scholar]
- Lipp P, Niggli E. Sodium current-induced calcium signals in isolated guinea-pig ventricular myocytes. Journal of Physiology. 1994;474:439–446. doi: 10.1113/jphysiol.1994.sp020035. [DOI] [PMC free article] [PubMed] [Google Scholar]
- Lopez-Lopez J R, Shacklock P S, Balke C W, Wier W G. Local calcium transients triggered by single L-type calcium channel currents in cardiac cells. Science. 1995;268:1042–1045. doi: 10.1126/science.7754383. [DOI] [PubMed] [Google Scholar]
- Mangoni M, Leuranguer V, Bourinet E, Nargeot J, Richard S. Block of cardiac Ca2+ channels by the new Ca2+ antagonist Ro 40–5967: consequences on heart rate and cardiac output. Biophysical Journal. 1997;72:A256. (abstract) [Google Scholar]
- Mishra S K, Hermsmeyer K. Selective inhibition of T-type Ca2+ channels by Ro 40–5967. Circulation Research. 1994;75:144–148. doi: 10.1161/01.res.75.1.144. [DOI] [PubMed] [Google Scholar]
- Nuss H B, Houser S R. Sodium-calcium exchange-mediated contractions in feline ventricular myocytes. American Journal of Physiology. 1992;263:H1161–1169. doi: 10.1152/ajpheart.1992.263.4.H1161. [DOI] [PubMed] [Google Scholar]
- Nuss H B, Houser S R. T-type Ca2+ current is expressed in hypertrophied adult feline left ventricular myocytes. Circulation Research. 1993;73:777–782. doi: 10.1161/01.res.73.4.777. [DOI] [PubMed] [Google Scholar]
- Piedras-Renteria E S, Best P M. Detection of α1E-like mRNA in atrial tissue from juvenile and old rats. Biophysical Journal. 1997;72:A145. (abstract) [Google Scholar]
- Rose W C, Balke C W, Wier W G, Marban E. Macroscopic and unitary properties of physiological ion flux through L-type Ca2+ channels in guinea-pig heart cells. Journal of Physiology. 1992;456:267–284. doi: 10.1113/jphysiol.1992.sp019336. [DOI] [PMC free article] [PubMed] [Google Scholar]
- Sham J S K, Cleemann L, Morad M. Gating of the cardiac Ca2+ release channel: the role of Na+ current and Na+-Ca2+ exchange. Science. 1992;255:850–853. doi: 10.1126/science.1311127. [DOI] [PubMed] [Google Scholar]
- Sham J S K, Cleemann L, Morad M. Functional coupling of Ca2+ channels and ryanodine receptors in cardiac myocytes. Proceedings of the National Academy of Sciences of the USA. 1995;92:121–125. doi: 10.1073/pnas.92.1.121. [DOI] [PMC free article] [PubMed] [Google Scholar]
- Sipido K R, Callewaert G, Carmeliet E. Inhibition and rapid recovery of ICa during calcium release from the sarcoplasmic reticulum in guinea-pig ventricular myocytes. Circulation Research. 1995a;76:102–109. doi: 10.1161/01.res.76.1.102. [DOI] [PubMed] [Google Scholar]
- Sipido K R, Carmeliet E, Pappano A J. Na+ current and Ca2+ release from the sarcoplasmic reticulum during action potentials in guinea-pig ventricular myocytes. Journal of Physiology. 1995b;489:1–17. doi: 10.1113/jphysiol.1995.sp021025. [DOI] [PMC free article] [PubMed] [Google Scholar]
- Sipido K R, Maes M M, van De Werf F. Low efficiency of Ca2+ entry through the Na/Ca exchanger as trigger for Ca2+ release from the sarcoplasmic reticulum. Circulation Research. 1997;81:1043–1044. doi: 10.1161/01.res.81.6.1034. [DOI] [PubMed] [Google Scholar]
- Sipido K R, Wier W G. Flux of Ca2+ across the sarcoplasmic reticulum of guinea-pig cardiac cells during excitation-contraction coupling. Journal of Physiology. 1991;435:605–630. doi: 10.1113/jphysiol.1991.sp018528. [DOI] [PMC free article] [PubMed] [Google Scholar]
- Soong T W, Stea A, Hodson C D, Dubel S J, Vincent S R, Snutch T P. Structure and functional expression of a member of the low voltage-activated calcium channel family. Science. 1993;260:1133–1136. doi: 10.1126/science.8388125. [DOI] [PubMed] [Google Scholar]
- Stern M D. Theory of excitation-contraction coupling in cardiac muscle. Biophysical Journal. 1992;63:497–517. doi: 10.1016/S0006-3495(92)81615-6. [DOI] [PMC free article] [PubMed] [Google Scholar]
- Tseng G N, Boyden P A. Multiple types of Ca2+ currents in single canine Purkinje cells. Circulation Research. 1989;65:1735–1750. doi: 10.1161/01.res.65.6.1735. [DOI] [PubMed] [Google Scholar]
- Vassort G, Alvarez J. Cardiac T-type calcium current: pharmacology and roles in cardiac tissues. Journal of Cardiovascular Electrophysiology. 1994;5:376–393. doi: 10.1111/j.1540-8167.1994.tb01175.x. [DOI] [PubMed] [Google Scholar]
- Vornanen M, Shepherd N, Isenberg G. Tension-voltage relations of single myocytes reflect Ca release triggered by Na/Ca exchange at 35 degrees C but not 23 degrees C. American Journal of Physiology. 1994;267:C623–632. doi: 10.1152/ajpcell.1994.267.2.C623. [DOI] [PubMed] [Google Scholar]
- Wibo M, Bravo G, Godfraind T. Postnatal maturation of excitation-contraction coupling in rat ventricle in relation to the subcellular localization and surface density of 1,4-dihydropyridine and ryanodine receptors. Circulation Research. 1991;68:662–673. doi: 10.1161/01.res.68.3.662. [DOI] [PubMed] [Google Scholar]
- Wier W G, Egan T M, Lopez-Lopez J R, Balke C W. Local control of excitation-contraction coupling in rat heart cells. Journal of Physiology. 1994;474:463–471. doi: 10.1113/jphysiol.1994.sp020037. [DOI] [PMC free article] [PubMed] [Google Scholar]
- Zhou Z, January C T. T- and L-type calcium currents and excitation-contraction coupling in isolated cardiac Purkinje cells. Biophysical Journal. 1994;66:A95. doi: 10.1016/S0006-3495(98)77893-2. (abstract) [DOI] [PMC free article] [PubMed] [Google Scholar]
- Zhou Z, Lipsius S L. T-type calcium current in latent pacemaker cells isolated from cat right atrium. Journal of Molecular and Cellular Cardiology. 1994;26:1211–1219. doi: 10.1006/jmcc.1994.1139. [DOI] [PubMed] [Google Scholar]