A Statistical Method for Predicting Classical HLA Alleles from SNP Data (original) (raw)
Abstract
Genetic variation at classical HLA alleles is a crucial determinant of transplant success and susceptibility to a large number of infectious and autoimmune diseases. However, large-scale studies involving classical type I and type II HLA alleles might be limited by the cost of allele-typing technologies. Although recent studies have shown that some common HLA alleles can be tagged with small numbers of markers,1,2 SNP-based tagging does not offer a complete solution to predicting HLA alleles. We have developed a new statistical methodology to use SNP variation within the region to predict alleles at key class I (HLA-A, HLA-B, and HLA-C) and class II (HLA-DRB1, HLA-DQA1, and HLA-DQB1) loci. Our results indicate that a single panel of ∼100 SNPs typed across the region is sufficient for predicting both rare and common HLA alleles with up to 95% accuracy in both African and non-African populations. Furthermore, we show that HLA alleles can be successfully predicted by using previously genotyped SNPs that are within the MHC and that had not been chosen for their ability to predict HLA alleles, such as those included on genome-wide products. These results indicate that our methodology, combined with an extended database of reference haplotypes, will facilitate large-scale experiments, including disease-association studies and vaccine trials, in which detailed information about HLA type is valuable.
Introduction
The development of cheap and efficient methods for SNP genotyping has led to a revolution in the nature and scale of disease-association studies. However, in the MHC, in which variation at classical HLA alleles has been implicated in susceptibility to a wide range of infectious3 and autoimmune disease,4 interpretation of association can be problematic because of the complex relationship between SNP variation and variation at classical HLA alleles1 and structural variation. Direct typing of classical HLA alleles is costly and currently prohibitive for many large-scale studies for which such information would be valuable. These include disease-association studies, vaccine trials, and other epidemiological studies in which HLA type can be a potential causal or confounding factor. Furthermore, even when HLA typing is performed, this is often restricted to a few class I and class II loci. Although it is difficult to be exact about costs (because these depend on the required level of allelic resolution, methodology, and sample size), we estimate that, for a large study, HLA typing with intermediate-resolution methods at major class I and class II loci currently costs approximately the same as obtaining over 500,000 genotypes across the genome with a standard commercial array (Affymetrix GeneChip Mapping 500K Array Set).
Recent large-scale surveys of genetic variation within the extended human MHC have demonstrated that single-nucleotide polymorphisms (SNPs) and other putatively neutral markers within the region can show strong linkage disequilibrium to particular HLA alleles.1,2 Because SNPs are relatively inexpensive to genotype, SNP-based tagging offers an attractive alternative to conventional HLA typing when 100% accuracy in allele typing is not required (e.g., in testing for association or initial screening of a large database of potential donors). However, although these earlier studies indicated that some common HLA alleles might be efficiently tagged with one or two SNP markers, the conventional notion of tagging does not provide a general solution to accurate prediction of classical HLA variation. First, the majority of HLA alleles are rare, so “common” SNPs, or even combinations of two or three such SNPs, typically cannot provide the resolution needed to identify them. Second, many HLA alleles are found on multiple haplotype backgrounds,1 so that no single SNP or combination of SNPs can act as reliable proxies. Third, the large number of HLA alleles requires a large number of tags to be typed. Fourth, identification of tags in relatively small samples can lead to problems of overfitting (i.e., the tags will not transfer well to future studies).
However, the strong haplotype structure observed across the MHC region does lend itself to an alternative approach to predicting HLA types (see Figure 1A). Consider two chromosomes that are identical by descent (IBD) at a particular HLA locus through sharing a common ancestor 100 generations ago. We would expect identity by descent to extend 1cM either side of the HLA locus. In a region with an average recombination rate of 0.4 cM/Mb,1 we therefore would expect identity over 5 Mb. Such a large region of identity should be detectable through the use of SNPs genotyped across the region and not even particularly close to the HLA locus or chosen specifically for their ability to tag. Consequently, if two chromosomes show extensive SNP identity extending across an HLA locus, we would expect them to share the same HLA allele. Comparison of SNP data from individuals with unknown HLA types to a database of haplotypes from individuals with known HLA types can potentially provide an accurate approach for predicting the HLA types. Similar approaches have proved to be highly accurate in predicting missing data at untyped SNPs.5–8
Figure 1.
SNP-Based Imputation of Classical HLA Alleles
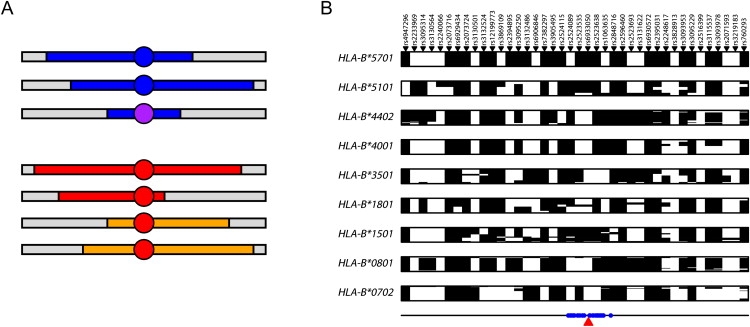
(A) Schematic representation of IBD-based imputation. In the upper section, two chromosomes carrying the same allele (blue circle) share extended similarity with a recent common ancestor (blue segments) and therefore also with one another. A second, but related, allele (purple circle—e.g., one that is identical at two-digit resolution) shares more limited and divergent, but nevertheless detectable, similarity. In the lower section, the same allele (red circle) sits on two distinct haplotype backgrounds. A conventional tagging approach will both fail to identify the more distant relatedness between alleles in the upper section and will fail to identify a single tag set in the lower section.
(B) SNP haplotypes for HLA-B alleles at four-digit resolution with five or more copies in the CEU training data at the 40 SNPs chosen for allele prediction with the Affymetrix array data for the 1958 birth cohort; each row represents a unique chromosome and the alleles at the SNPs are arbitrarily coded as black and white. Note that unlike a conventional tagging approach, there is typically no unique haplotype that defines the presence of an allele. rsIDs are indicated above and the location of prediction SNPs relative to HLA-B within the ∼4 Mb HLA region (defined here as the region from SNPs rs7754054 to rs769051) is shown below.
The importance of using an IBD-based methodology, as opposed to a conventional tagging approach, to predict HLA alleles is demonstrated in Figure 1B, which shows haplotypes for chromosomes carrying different HLA-B alleles in a sample of 180 chromosomes from a population of European ancestry.1 In a tagging approach, we would expect to see a “barcode” effect, with each allele being associated with a single tagging haplotype. Although this is predominantly the case for some alleles (e.g., HLA-B_∗_5701, HLA-B_∗_4001, and HLA-B_∗_0702), for others (e.g., HLA-B_∗_1801 and HLA-B_∗_1501) the allele lies on multiple haplotype backgrounds (in HLA-allele nomenclature, the first two digits indicate the serological group and the second two indicate the unique protein within that group). Conversely, very rarely do we observe different HLA alleles on the same SNP haplotype. Consequently, each allele can potentially be predicted from the combination of haplotype backgrounds on which it is found to occur. These haplotype backgrounds are known, in some cases, to differ between populations.1 Below, we describe a novel statistical methodology for predicting HLA alleles from a database of SNP haplotypes carrying known HLA alleles. We describe its performance on a set of previously published “training data” (90 individuals of European ancestry from Utah and 60 Yoruba from Ibadan in Nigeria) by using a cross-validation strategy to choose prediction SNPs and to estimate performance. We then validate the methodology by predicting HLA alleles in a set of over 900 individuals of UK origin and demonstrate accuracies approaching 95% at two-digit resolution across even the most polymorphic loci. Finally, we describe how to selectively enhance the existing database so as to give substantial improvements in prediction accuracy.
Method and Materials
DNA Samples and HLA Typing
Data used as the training set have been described previously.1 In brief, the individuals sampled are those of the HapMap Project (30 parent-offspring trios of Yoruba ancestry from Ibadan in Nigeria, YRI; 30 CEPH families of European ancestry from Utah, CEU; 45 unrelated Han Chinese from Beijing, CHB; and 45 unrelated individuals from Tokyo in Japan, JPT) and are augmented with 15 parent-offspring trios from the same population as the CEU. Over 7500 SNPs and deletion-insertion polymorphisms (DIPs) were typed across the extended human MHC (excluding the classical HLA genes themselves), of which 5754 passed QC in all populations surveyed. HLA typing was carried out with PCR-SSOP protocols at three class I loci (HLA-A, HLA-B, and HLA-C) and three class II loci (HLA-DRB1, HLA-DQA1, and HLA-DQB1). Haplotype information was reconstructed from genotype data with a combination of trio information and statistical methods.1 Missing data (at both SNPs and classical HLA alleles) were imputed during the phasing step. Haplotypes containing imputed HLA alleles are used in the training set to aid prediction, but we do not include them in measures of prediction accuracy. All data used are publicly available (see Web Resources). Because our approach relies on high-quality haplotype information in the training data, we focus exclusively on YRI and CEU.
The methodology was validated with genotype and HLA-allele information from the 1958 birth cohort study (see Web Resources). HLA alleles at HLA-A, HLA-B, HLA-DRB1, and HLA-DQB1 were obtained for ∼930 individuals of UK origin (numbers differ between loci) with DYNAL technologies from Invitrogen (a mixture of SSOP and SSP protocols; see Web Resources for details). Of these, 911 individuals had been successfully HLA typed at a minimum of two loci and also had genotype data available from the Wellcome Trust Case Control Consortium (WTCCC) project.6 Genotyping was performed with the Affymetrix 500K SNP array set and the Illumina human NS-12 nonsynonymous SNP genotyping beadchip augmented with ∼1500 additional SNPs specifically targeted to the MHC. Genotype calls from the image-intensity files for the Affymetrix data were made with the CHIAMO software developed within the WTCCC.6 Haplotypes were reconstructed (and missing genotypes imputed) from genotype data with an adaptation of existing statistical methodology9 to include haplotypes reconstructed from the augmented International HapMap Project data (see below).1,10 Prediction SNPs were selected in the training set from the overlap of the projects (578 SNPs for the Affymetrix array and 776 SNPs for the Illumina array across the 8 Mb extended HLA region). Where ambiguous, the strandedness of SNPs was estimated from a comparison of allele frequency and LD information. In analyses of validation data, prediction SNPs were only selected for four-digit prediction accuracy.
HLA-Allele Prediction
Our starting point is a training database consisting of SNP genotypes across the extended MHC and classical HLA alleles for n chromosomes. We assume that the haplotype phase for both SNP data and classical HLA types is known or estimated (for example, from a combination of pedigree data and statistical approaches). Furthermore, we assume that there is no missing SNP data in the database (because this has been inferred through a combination of pedigree information and statistical methods). We exclude from the database any chromosome for which the allele at a classical HLA locus of interest is missing. Uncertainty concerning phase and missing data can be accommodated by averaging predictions over multiple samples from the posterior distribution of phased data-complete chromosomes given a suitable model. However, here we consider the use of a single estimate.
We now observe SNP genotype data for an additional m individuals typed across the same region. Let l be the number of SNPs for which there is genotype information for both the training database and additional individuals. Our prediction method has three stages. In the first stage, we select, from among the l SNPs, a set of size lp that are optimal (in a way defined below) for predicting HLA alleles at a specified locus of interest within the training database chromosomes, by using a cross-validation procedure. In the second stage, haplotype phase and missing data are estimated for the l SNPs in the additional individuals. In the third stage, we made probabilistic statements about the allele carried by each of the 2_m_ additional chromosomes by comparing these, one at a time, with the database chromosomes at the selected lp SNPs.
The allele prediction algorithm for a single additional phased chromosome with no missing SNP data is central to the first and third stages. We therefore describe this part first. Considering a particular HLA locus, we group chromosomes in the database by the HLA allele they carry. This can be done at either the two-digit or four-digit level (or coarser, such as superfamily, or finer, such as six-digit). For each of the K alleles, we calculate an approximation to the probability (under the coalescent) of observing the SNP configuration at the prediction SNP set in the additional chromosome if it also carried the same HLA allele. This approximation, known informally as “Li and Stephens,” uses a hidden Markov model (HMM) formulation that allows efficient computation.11 Informally, the method assumes that if the additional chromosome carries a given HLA allele, it will look like an imperfect mosaic of those chromosomes that carry the same allele (the hidden state being which of those chromosomes in the database is the “parent” of the “daughter” additional chromosome at any given position). The degree of mosaicism is determined by the recombination rate and the number of chromosomes that carry the allele in the database. The degree of imperfection (mismatch in SNP haplotype) is determined by the mutation rate. For completeness, we include technical details of the algorithm in the next section.
The Prediction Algorithm
Let A be the set of all alleles at a given locus in the database and |A|=K. Suppose that there are na copies of allele a in the database. The training database consists of n known haplotypes in which the _j_th haplotype has the SNP information at l SNPs, cj={c1j,c2j,…,clj}, and the classical HLA allele aj. Each additional chromosome, i, (with unknown HLA allele) has SNP information hi={h1i,h2i,…,hli}. We require a fine-scale genetic map of the region (in Morgans), r={r0,r1,r2,…,rl}; we use that previously estimated from genetic variation data1 and set _r_0 = 0. We define the recombination probability ps=1−exp{−4Ne(rs+1−rs)/na} and then define transition probabilities from state j (indicating that it is the _j_th haplotype in the training database that is parental) at position s to state k at position s+1:
q(js,ks+1)={1−ps+ps/naj=kps/naj≠k},
where Ne is the effective population size (here assumed to be 15,000, although we found results to be largely insensitive to the value of this parameter within a factor of 2). We define the emission probabilities in terms of the “population mutation rate” for allele a
and the mismatch (or not) between the allele of the _j_th “parent” chromosome at SNP s, csj, and the allele of the _i_th additional “daughter” chromosome, hsi
e(hsi,csj)={nana+θa+12θana+θahsi=csj12θana+θahsi≠csj}.
To calculate the conditional probability of observing the additional haplotype, we sum over all possible paths through the potential parental chromosomes by using the forward algorithm. For each of the na database chromosomes, we initialize the forward algorithm:
The forward algorithm moves along the sequence such that at each SNP,
fsj=e(hsi,csj)∑k=1nafs−1k×q(ks−1,js).
The probability of observing the SNP configuration of the additional chromosome is given by
A similar calculation is made for each of the K alleles. The posterior probability that the additional chromosome carries allele a is given by Bayes rule, as follows:
Pr(a|hi)=Pr(a)π(hi|a)∑b∈APr(b)π(hi|b).
We set the prior probability of carrying an allele, Pr(a), to be 1/K, although weighting by frequency was also considered and performed similarly. The argument for weighting equally is that it guards against predictions being strongly influenced by biases of the allelic representation in the database. The allele prediction is determined by the group with the highest posterior probability. We also consider a scheme whereby we only make a prediction if the maximum posterior probability for any group is greater than or equal to some call threshold: 0≤t≤1. This approach guards against making predictions where there are much uncertainty about HLA alleles. Where there are multiple chromosomes with unknown alleles, predictions are made for each additional chromosome separately. We also make predictions for each locus separately. We now describe each of the steps of the algorithm in detail.
Stage 1: Selecting a Set of Prediction SNPs
We wish to select a set of SNPs, from among the l typed in both the database and additional chromosomes, with which to make predictions about alleles at untyped classical HLA loci. We use a leave-one-out cross-validation scheme within the training database combined with forward selection and backward elimination to select a set of SNPs. The measure we aim to select on is a function of the accuracy of predictions in the training set and the call rate (the fraction of chromosomes for which we make a prediction). Let t be the call threshold, let Icall be the indicator function
Icall(hi,t)={1ifmaxa∈A{Pr(a|hi)}≥t0otherwise},
and let Icorrect be another indicator function
Icorrect(hi,ai)={1ifargmaxa∈A{Pr(a|hi)}=ai0otherwise},
where ai is the known allele carried by the _i_th chromosome in the training set. Note that predictions are made excluding the chromosome in question from the training data (hence the name leave-one-out cross-validation). The quality of a prediction SNP set, s={s1,s2,…,slp}, is defined in terms of the distance from optimal performance (100% call rate and 100% accuracy). Here, we use the _l_1 norm:
Q(s)=(1−1n∑i=1nIcall(hi,t))+(1−∑i=1n[Icall(hi,t)×Icorrect(hi,ai)]∑i=1nIcall(hi,t)),
although other distances (e.g., Euclidean) were considered and performed similarly. The selection algorithm has the following steps:
- Initialize: Find the single SNP among the l genotyped with the lowest Q(s) value, and set it to s.
- Note the current prediction set s and its value, Q(s).
- Forward selection: Identify the set s′=s+si, where i=argminj{Q(s+sj)}, sj∉s. Note that we only consider SNPs within 500 kb of the HLA locus in question. If |s|>41 terminate.
- Backward elimination: Identify the set s″=s′−sj, in which j=argmink{Q(s′−sk)}, sk∈s. If s″=s, return s′ to step 2. Otherwise, return s″ to step 2.
By using this algorithm, we select 40 SNPs for each locus in each population. The prediction SNP set chosen is the smallest that achieves the best Q(s) score over the entire algorithm. Prediction sets are selected independently for each locus in each population. In the following, only a value of t = 0 was used in selecting the prediction set. Other values were considered, but the results did not seem highly sensitive to this parameter.
The problem of identifying suitable prediction SNPs is related to the well-studied issue of identifying tag SNPs (see, for example,12–16). Although exact solutions to tag selection are possible under restricted model assumptions,14 this is not possible for the generalized prediction algorithm used here. However, it is also important to note that because of the high LD across the MHC region, it is possible to identify a second or third prediction set of almost equal quality with little or no SNP overlap (data not shown). Such redundancy is useful because (1) not all SNPs can be typed on all platforms and (2) effective prediction SNP sets can be identified from among SNPs that were already genotyped and that were not specifically selected for predicting classical HLA alleles.
Stage 2: Phasing and Imputing Missing Data in the Additional Chromosomes
To reconstruct haplotypes from genotype data and estimate missing data, we use a modified version of the algorithm employed in the program PHASE17 in which the haplotypes present in the database are treated as “known” haplotypes. Two modifications are employed. First, additional data are treated on an individual-by-individual basis such that each additional individual is phased with only the known haplotypes. Second, as a result of this approach, we can use maximum likelihood (rather than MCMC) to estimate haplotypes for each additional genotype.
Stage 3: HLA-Allele Predictions
Having estimated haplotype phase and missing data for each of the additional 2_m_ chromosomes, we made probabilistic predictions at each HLA locus by using SNP information at the previously selected prediction set for each locus and the reference database. Predictions are made separately for each population: i.e., only the CEU haplotypes are used to predict additional CEU chromosomes.
We use two measures of success in assessing predictions: Sensitivity (or accuracy) is defined as the proportion of all predictions that are correct, and specificity is the proportion of times a given allele, when present, is correctly predicted. For genotype data, because we do not know the phase of the classical HLA alleles, slight modifications of these definitions are required. For each individual, i, we define hi={hi,1,hi,2} as the ordered pair of phased SNP haplotypes, ai={ai,1,ai,2} as the ordered pair of predicted alleles (for which alleles are predicted with the maximum posterior probability), and αi={αi,1,αi,2} as the unordered pair of known allelic types (with arbitrarily assigned labels 1 and 2). We define the following indicator functions:
Icall(hi,j,t)={1ifmaxa∈A{Pr(a|hi,j)}≥t0otherwise,
Icorrect(ai,j,αi)={1ifai,j∈αi0otherwise,
Ipredict(αi,j,ai)={1if(Icall(hi,1,t)=1ANDai,1=αi,j)OR(Icall(hi,2,t)=1ANDai,2=αi,j)0otherwise.
We then define sensitivity and specificity as
sensitivity(a)=∑i,j:ai,j=a[Icorrect(ai,j,αi)×Icall(hi,j,t)]∑i,j:ai,j=aIcall(hi,j,t),
specificity(a)=∑i,j:αi,j=aIpredict(αi,j,ai)na.
Note that sensitivity can also be defined irrespective of the allele being predicted.
Results
The statistical methodology we have developed utilizes a database of haplotypes with known HLA alleles to predict HLA alleles at additional haplotypes (or genotypes) with unknown HLA type. For the purposes of the results presented here the database consists of 300 haplotypes from individuals of European and Nigerian origin, though greater accuracy would be obtained with a larger and more widely sampled set of individuals. This methodology has two key features (see Material and Methods). First, in making predictions, we compare a set of SNPs typed on a chromosome of unknown HLA type to those in the database, by looking for extended similarity between a chromosome of unknown HLA type and one in the database and modeling the breakdown in similarity around an allele through meiotic crossing over by using a population genetic model and current knowledge about the fine-scale recombination-rate variation in the region.1,18 Chromosomes carrying a particular HLA allele are modeled as an imperfect mosaic of only those haplotypes that carry the same allele in the database, effectively stratifying haplotypes into “subpopulations” defined by the presence of a given HLA allele. Second, we attempt to maximize prediction accuracy by selecting a set of prediction SNPs from those typed in both the database and additional individuals that are maximally informative within the database about HLA alleles (i.e., that optimize prediction accuracy).
This novel approach has five key advantages. First, predictions can be made at either two-digit, four-digit, or potentially even greater resolution. Second, predictions come with associated probabilities that can be used to assess confidence in calls. Third, the method does not rely on identifying a single set of tag SNPs to be used in all experiments. One example of why this can be beneficial is that the method could be used to predict HLA alleles for individuals previously genotyped on a commercial genome-wide SNP panel. In addition, some SNPs cannot be successfully genotyped on specific platforms; hence, flexibility in SNP choice is a useful property. Fourth, by using the approach, we can identify a set of ∼100 SNPs that can be used for predicting HLA alleles at all loci and in any population. Finally, the approach both accommodates expansion of the existing database and suggests how to augment the database in a maximally informative manner.
To assess the potential of this approach, we have used data from a recent experiment1 aimed at characterizing SNP and class I and class II HLA-allele variation in 150 unrelated individuals of Nigerian (YRI) and European ancestry (CEU; see Material and Methods). To select SNPs for HLA-allele prediction, we use a leave-one-out cross-validation strategy in the training data (see Material and Methods), considering SNPs up to 500 kb away from the HLA locus in question (in either direction) as potentially informative. Optimized prediction accuracies in the training set are shown in Table 1 for four-digit HLA-allele resolution. By excluding HLA alleles that only occur once in the training data (referred to as singletons), we obtain consistently high accuracy in prediction with a typical accuracy of 90%–100%. Accuracy is typically higher in CEU than YRI, particularly for HLA-B. Performance also differs between loci and is predominantly driven by allelic diversity. HLA-B and HLA-DRB1 typically show lower accuracy (and have the highest number of alleles), whereas accuracy at HLA-A, HLA-C, HLA-DQA1, and HLA-DQB1 is never lower than 94%. Full details of sensitivity and specificity by locus and allele are in Tables S1–S4 available online.
Table 1.
Accuracy in Predicting HLA Alleles in the Training Data
| Locus | Accuracy at Four-Digit Resolutiona (%) (Call Rate %) | Accuracy at Two-Digit Resolutiona (%) (Call Rate %) | ||||||
|---|---|---|---|---|---|---|---|---|
| CTb = 0.0 | CT = 0.9 | CT = 0.0 | CT = 0.9 | CT = 0.0 | CT = 0.9 | CT = 0.0 | CT = 0.9 | |
| YRI | YRI | CEU | CEU | YRI | YRI | CEU | CEU | |
| HLA-A | 96 | 98 (91) | 98 | 99 (92) | 96 | 95 (100) | 96 | 99 (93) |
| HLA-C | 97 | 97 (100) | 98 | 96 (100) | 98 | 97 (100) | 99 | 96 (100) |
| HLA-B | 91 | 100 (62) | 96 | 95 (99) | 88 | 100 (65) | 97 | 96 (100) |
| HLA-DRB1 | 92 | 90 (100) | 91 | 89 (99) | 94 | 99 (88) | 97 | 95 (100) |
| HLA-DQA1 | 94 | 94 (100) | 99 | 99 (100) | 96 | 96 (100) | 99 | 98 (100) |
| HLA-DQB1 | 98 | 100 (98) | 99 | 99 (100) | 100 | 100 (100) | 99 | 99 (100) |
The main limitation of the database used here is that many alleles are only represented once or a few times. For example, at HLA-B, 42 different alleles distinct at four-digit resolution are observed across the database of 300 haplotypes, of which 14 are only observed once (across both populations). More generally, alleles represented fewer than five times in the database collectively account for ∼15% of the sample. For such rare alleles, however, it might be possible to predict HLA type to two-digit rather than four-digit resolution. We therefore repeated the predictions of HLA alleles to two-digit resolution (Table 1 and Tables S1–S4). Across all loci, only three alleles are observed as singletons at two-digit resolution, and prediction accuracy is generally increased by a few percent over four-digit accuracy.
For a small fraction of chromosomes, there is some uncertainty in the predicted allele. This arises when the chromosome carries a SNP configuration that is similar to two or more chromosomes carrying different HLA alleles or when the SNP configuration is unlike any previously seen. We therefore also considered accuracy when predictions were only made if the maximum posterior probability was more than 0.9 (Table 1). Setting such a threshold has little effect on most loci except for HLA-B and HLA-DRB1, in which call rates are reduced, but accuracy is increased. This is particularly true for HLA-B in YRI, in which accuracy is increased by 10%. These results indicate that it is possible to provide useful measures of the quality of allele predictions (see also below). One use for such measures is to identify individuals for which there is ambiguity in prediction (for example which fail to meet the 90% probability call threshold) and to use conventional HLA typing technologies for such individuals.
Optimized accuracy in the training set is likely to be an overestimate of true accuracy. To validate the methodology, we obtained SNP information from 911 individuals of UK origin from the 1958 birth cohort for which a subset of class I and class II HLA types were also available. These individuals had been genotyped as part of the Wellcome Trust Case Control Consortium project.6 We predicted HLA alleles at the typed loci by using the CEU data alone and SNPs selected for performance in the training data from the overlap of the projects. Note that these SNPs represent only 10%–15% of those typed in the training data. Results for the two SNP sets are shown in Table 2 and Figure 2. With a call threshold of 0.9, accuracy at the two-digit level is consistently greater than 95% for the Illumina array and greater than 94% for the Affymetrix array. Accuracy at four-digit resolution varies across loci but is consistently greater than 90%, except for HLA-DRB1 for the Affymetrix data. However, call rates can be low for such a high call threshold. With a call threshold of 0.5, call rates are greater than 80% for all loci, two-digit accuracy is greater than 90% for all loci (apart from HLA-B with the Affymetrix data), and four-digit accuracy is greater than 85% except for HLA-DRB1. The method also appears to be well calibrated (Figure 3); for example, there is a 60%–70% chance of a call being correct if the maximum posterior probability for the call is in the range from 0.6–0.7. A full breakdown of prediction sensitivity and specificity by allele at four-digit and two-digit resolution for the validation data is available in Tables S5–S8.
Table 2.
Prediction Accuracy in 1958 Birth Cohort Data
| Locus | Data | Number of SNPs Selected | Number of Haplotypesa | Accuracy at Four-Digit Resolution (%) and Call Rate (%) | Accuracy at Two-Digit Resolution (%) and Call Rate (%) | ||||
|---|---|---|---|---|---|---|---|---|---|
| CT = 0 | CT = 0.5 | CT = 0.9 | CT = 0 | CT = 0.5 | CT = 0.9 | ||||
| HLA-A | Illumina | 19 | 876/1792 | 91 | 93 (97) | 94 (87) | 95 | 96 (98) | 96 (91) |
| Affymetrix | 10 | 89 | 91 (93) | 97 (58) | 93 | 94 (94) | 95 (29) | ||
| HLA-B | Illumina | 17 | 1630/1708 | 81 | 87 (81) | 94 (49) | 85 | 90 (81) | 95 (49) |
| Affymetrix | 40 | 82 | 85 (88) | 93 (66) | 84 | 87 (89) | 94 (65) | ||
| HLA-DRB1 | Illumina | 18 | 834/1798 | 73 | 77 (87) | 92 (27) | 88 | 90 (88) | 97 (33) |
| Affymetrix | 34 | 72 | 76 (88) | 83 (51) | 86 | 90 (88) | 95 (55) | ||
| HLA-DQB1 | Illumina | 18 | 1088/1774 | 87 | 88 (95) | 92 (71) | 93 | 94 (96) | 96 (75) |
| Affymetrix | 22 | 77 | 80 (88) | 93 (29) | 90 | 91 (89) | 97 (31) |
Figure 2.
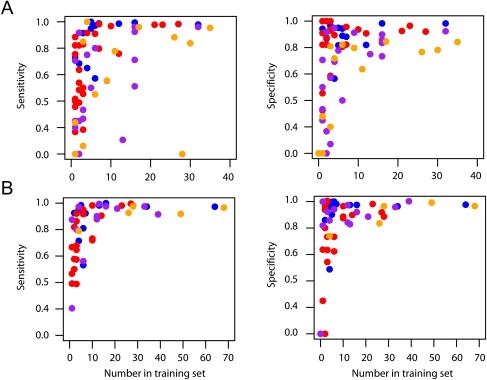
The Relationship between the Number of Times an Allele Appears in the Database and the Sensitivity and Specificity of Predictions
The relationship between the numbers of times an allele appears in the database and the sensitivity and specificity of predictions. Results are shown for (A) four-digit and (B) two-digit resolution for the Illumina data predictions only. Sensitivity is the proportion of cases in which a predicted allele is present in an individual. Specificity is the proportion of cases in which an allele present in an individual has been correctly predicted. Each allele is represented, and colors indicate the locus (HLA-A, blue; HLA-B, red; HLA-DRB1, purple; and HLA-DQB1, orange). Note that two four-digit alleles stand out as having many copies in the database and low sensitivity. It appears these alleles have only been typed to two-digit resolution in the 1958 birth cohort data, and so accuracy cannot be accurately determined.
Figure 3.
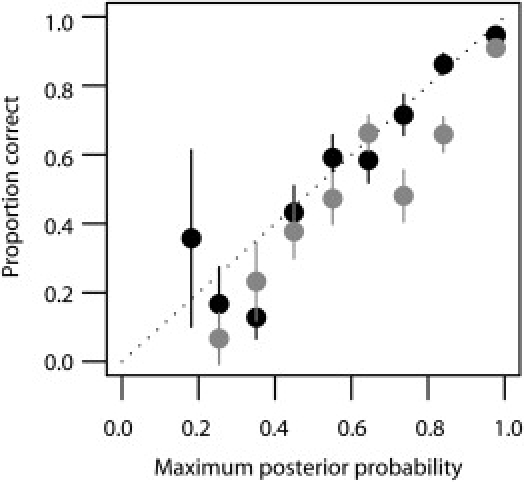
Calibration of Call Probabilities in the 58 Birth Cohort Data at Four-Digit Resolution
Accuracy estimates (±2 SE) are shown for the predictions made with the Affymetrix array (gray) and the Illumina (black) array. The slightly higher accuracy of the Illumina data is primarily due to the higher density of SNPs from which to choose accurate prediction sets, particularly within the vicinity of HLA-DQB1.
Discussion
Our results indicate that, for the two populations analyzed here, a limited database of individuals typed at both classical HLA loci and SNPs across the MHC region, combined with the novel statistical method presented here, can be used to predict allelic status to two- and four-digit resolution at class I and class II HLA genes with up to and greater than 95% accuracy. For some applications, such as the choice of transplant donors, higher levels of accuracy in HLA-allele prediction are required. However, for many applications, such as testing for disease association, screening large databases for potential transplant donors, or obtaining HLA alleles as covariates in vaccine trials, a small decrease in accuracy is more than compensated for by the resulting potential for reduced costs and hence increased sample sizes. Such accuracy is perhaps unexpected given the very substantial diversity and age of HLA alleles. However, although haplotype diversity is likely to lead to difficulties with a conventional tagging approach, the diversity lends itself directly to the IBD-based approach described here.
We envisage two major uses for this approach. First, we can predict HLA alleles from already-collected SNP genotype data within the MHC, such as that obtained from commercial genome-wide association study SNP panels. Second, we can identify prediction sets of 100–200 SNPs that can be used on either population (CEU or YRI and potentially additional populations too) that give four-digit-resolution accuracy in the training data of greater than 90% at each locus. Although the choice of exactly which SNPs will most probably depend on technical details of the genotyping platform, we list a minimal prediction set of 106 SNPs in Table S9. Note, however, that we would not advocate use of a minimal SNP set for practical use (redundancy is important to guard against SNP-assay failures).
There are, however, clear limitations in using a database of only 150 individuals to predict HLA alleles for any population. It is therefore important to determine how large a database and how broad a geographical representation is needed to enable high accuracy prediction (>95%) for any individual from any population of interest. Our results indicate that having ten copies of an allele in the database is generally sufficient to provide high accuracy (Figure 2). Currently, there are 2169 unique class I and class II HLA alleles identified at the protein level (four-digit resolution),19 indicating that a database of 22,000 individuals would be sufficient to include at least ten copies of each. However, many fewer individuals need be sampled to reach high coverage because each individual genotyped carries multiple alleles, and many alleles are at extremely low frequency (much less than 1%). In practice, we estimate that a database of fewer than 2000 carefully chosen individuals would be sufficient to represent the majority of HLA diversity worldwide. We have also found that information on haplotype phase from trio data is extremely valuable for reconstructing the haplotype backgrounds on which HLA alleles lie. However, it is also known that using a database of known haplotypes (such as we have already) greatly aids statistical approaches to haplotype estimation.17 Consequently, although future sampling would benefit from pedigree-based collections, it should also be possible to incorporate data from unrelated individuals.
Finally, it is important to acknowledge the limitations of SNP-based methods. Two important features stand out. First, although very rarely, we do observe chromosomes that have nearly identical SNP patterns, yet carry different HLA alleles, perhaps because of recurrent mutation or gene conversion (although it also is impossible to rule out errors in HLA typing). Second, as discussed above, rare alleles might be absent from the database. Consequently, SNP-based prediction is likely to lead to an underestimation of heterozygosity, which is important for donor matching and perhaps also for studies of selection. However, although SNP-based methods will never attain the accuracy of sequence-based typing, they can provide a high-throughput, low-cost HLA-typing approach that is useful in many experimental and clinical settings.
Supplemental Data
Nine tables are available at http://www.ajhg.org/cgi/content/full/82/1/48/DC1/.
Supplemental Data
Document S1. Nine Tables
Web Resources
The URLs for data presented herein are as follows:
- InflammGen, http://www.inflammgen.org
- Human Chromosome 6 Project Overview, http://www.sanger.ac.uk/HGP/Chr6
- Genetic information from the British 1958 birth cohort, http://www.b58cgene.sgul.ac.uk
- HLA typing protocols for the 1958 birth cohort data, http://www-gene.cimr.cam.ac.uk/todd/public_data/HLA/HLA.shtml
Acknowledgments
The authors thank Neil Walker, Helen Stevens, and colleagues at the Juvenile Diabetes Research Foundation and Wellcome Trust Diabetes and Inflammation Laboratory for providing HLA types. We acknowledge use of genotype data from the British 1958 birth cohort DNA collection, funded by the Medical Research Council grant G0000934 and the Wellcome Trust grant 068545/Z/02. The authors also thank Jonathan Marchini, Niall Cardin, and David Squire for helpful discussions and The Wellcome Trust, National Institutes of Health, Engineering and Physical Sciences Research Council, and the Wolfson Foundation for research support.
References
- 1.de Bakker P.I., McVean G., Sabeti P.C., Miretti M.M., Green T., Marchini J., Ke X., Monsuur A.J., Whittaker P., Delgado M. A high-resolution HLA and SNP haplotype map for disease association studies in the extended human MHC. Nat. Genet. 2006;38:1166–1172. doi: 10.1038/ng1885. [DOI] [PMC free article] [PubMed] [Google Scholar]
- 2.Malkki M., Single R., Carrington M., Thomson G., Petersdorf E. MHC microsatellite diversity and linkage disequilibrium among common HLA-A, HLA-B, DRB1 haplotypes: Implications for unrelated donor hematopoietic transplantation and disease association studies. Tissue Antigens. 2005;66:114–124. doi: 10.1111/j.1399-0039.2005.00453.x. [DOI] [PubMed] [Google Scholar]
- 3.Cooke G.S., Hill A.V. Genetics of susceptibility to human infectious disease. Nat. Rev. Genet. 2001;2:967–977. doi: 10.1038/35103577. [DOI] [PubMed] [Google Scholar]
- 4.Gregersen P.K., Behrens T.W. Genetics of autoimmune diseases–disorders of immune homeostasis. Nat. Rev. Genet. 2006;7:917–928. doi: 10.1038/nrg1944. [DOI] [PubMed] [Google Scholar]
- 5.Burdick J.T., Chen W.M., Abecasis G.R., Cheung V.G. In silico method for inferring genotypes in pedigrees. Nat. Genet. 2006;38:1002–1004. doi: 10.1038/ng1863. [DOI] [PMC free article] [PubMed] [Google Scholar]
- 6.The Wellcome Trust Case Control Consortium Genome-wide association study of 14,000 cases of seven common diseases and 3,000 shared controls. Nature. 2007;447:661–668. doi: 10.1038/nature05911. [DOI] [PMC free article] [PubMed] [Google Scholar]
- 7.Marchini J., Howie B., Myers S., McVean G., Donnelly P. A new multipoint method for genome-wide association studies via imputation of genotypes. Nat. Genet. 2007;39:906–913. doi: 10.1038/ng2088. [DOI] [PubMed] [Google Scholar]
- 8.Servin B., Stephens M. Imputation-based analysis of association studies: Candidate regions and quantitative traits. PLoS Genet. 2007;3:e114. doi: 10.1371/journal.pgen.0030114. [DOI] [PMC free article] [PubMed] [Google Scholar]
- 9.Scheet P., Stephens M. A fast and flexible statistical model for large-scale population genotype data: Applications to inferring missing genotypes and haplotypic phase. Am. J. Hum. Genet. 2006;78:629–644. doi: 10.1086/502802. [DOI] [PMC free article] [PubMed] [Google Scholar]
- 10.The International HapMap Consortium A haplotype map of the human genome. Nature. 2005;437:1299–1320. doi: 10.1038/nature04226. [DOI] [PMC free article] [PubMed] [Google Scholar]
- 11.Li N., Stephens M. Modeling linkage disequilibrium and identifying recombination hotspots using single-nucleotide polymorphism data. Genetics. 2003;165:2213–2233. doi: 10.1093/genetics/165.4.2213. [DOI] [PMC free article] [PubMed] [Google Scholar]
- 12.Eyheramendy S., Marchini J., McVean G., Myers S., Donnelly P. A model-based approach to capture genetic variation for future association studies. Genome Res. 2007;17:88–95. doi: 10.1101/gr.5675406. [DOI] [PMC free article] [PubMed] [Google Scholar]
- 13.Carlson C.S., Eberle M.A., Rieder M.J., Yi Q., Kruglyak L., Nickerson D.A. Selecting a maximally informative set of single-nucleotide polymorphisms for association analyses using linkage disequilibrium. Am. J. Hum. Genet. 2004;74:106–120. doi: 10.1086/381000. [DOI] [PMC free article] [PubMed] [Google Scholar]
- 14.Halperin E., Kimmel G., Shamir R. Tag SNP selection in genotype data for maximizing SNP prediction accuracy. Bioinformatics. 2005;21(Suppl 1):i195–i203. doi: 10.1093/bioinformatics/bti1021. [DOI] [PubMed] [Google Scholar]
- 15.Zhang K., Deng M., Chen T., Waterman M.S., Sun F. A dynamic programming algorithm for haplotype block partitioning. Proc. Natl. Acad. Sci. USA. 2002;99:7335–7339. doi: 10.1073/pnas.102186799. [DOI] [PMC free article] [PubMed] [Google Scholar]
- 16.de Bakker P.I., Yelensky R., Pe'er I., Gabriel S.B., Daly M.J., Altshuler D. Efficiency and power in genetic association studies. Nat. Genet. 2005;37:1217–1223. doi: 10.1038/ng1669. [DOI] [PubMed] [Google Scholar]
- 17.Stephens M., Scheet P. Accounting for decay of linkage disequilibrium in haplotype inference and missing-data imputation. Am. J. Hum. Genet. 2005;76:449–462. doi: 10.1086/428594. [DOI] [PMC free article] [PubMed] [Google Scholar]
- 18.Myers S., Bottolo L., Freeman C., McVean G., Donnelly P. A fine-scale map of recombination rates and hotspots across the human genome. Science. 2005;310:321–324. doi: 10.1126/science.1117196. [DOI] [PubMed] [Google Scholar]
- 19.Robinson J., Waller M.J., Parham P., de Groot N., Bontrop R., Kennedy L.J., Stoehr P., Marsh S.G. IMGT/HLA and IMGT/MHC: Sequence databases for the study of the major histocompatibility complex. Nucleic Acids Res. 2003;31:311–314. doi: 10.1093/nar/gkg070. [DOI] [PMC free article] [PubMed] [Google Scholar]
Associated Data
This section collects any data citations, data availability statements, or supplementary materials included in this article.
Supplementary Materials
Document S1. Nine Tables