Activation of human primary motor cortex during action observation: A neuromagnetic study (original) (raw)
Abstract
The monkey premotor cortex contains neurons that discharge during action execution and during observation of actions made by others. Transcranial magnetic stimulation experiments suggest that a similar observation/execution matching system also is present in humans. We recorded neuromagnetic oscillatory activity of the human precentral cortex from 10 healthy volunteers while (i) they had no task to perform, (ii) they were manipulating a small object, and (iii) they were observing another individual performing the same task. The left and right median nerves were stimulated alternately (interstimulus interval, 1.5 s) at intensities exceeding motor threshold, and the poststimulus rebound of the rolandic 15- to 25-Hz activity was quantified. In agreement with previous studies, the rebound was strongly suppressed bilaterally during object manipulation. Most interestingly, the rebound also was significantly diminished during action observation (31–46% of the suppression during object manipulation). Control experiments, in which subjects were instructed to observe stationary or moving stimuli, confirmed the specificity of the suppression effect. Because the recorded 15- to 25-Hz activity is known to originate mainly in the precentral motor cortex, we concluded that the human primary motor cortex is activated during observation as well as execution of motor tasks. These findings have implications for a better understanding of the machinery underlying action recognition in humans.
The ventral premotor cortex of the monkey (area F5) contains a specific set of neurons that discharge both when the monkey performs hand actions and when it observes another individual, monkey or human, making a similar action (“mirror neurons,” refs. 1–3). This system that matches action observation and execution might play an important role in action imitation and action understanding (2–5).
Evidence in favor of the existence of a similar action observation/execution matching system in humans was provided by a transcranial magnetic stimulation (TMS) study, which showed that responses recorded from the hand muscles significantly increase when the subject observes another individual making hand or arm actions (6). However, the TMS technique does not allow the localization of the anatomical level of the effect. Positron emission tomography (PET) experiments showed an activation of the inferior frontal gyrus, mostly area 45, during action observation (7–9). However, because this activation did not overlap with that detected during action execution, these data did not unequivocally support the existence of an action observation/execution matching system in humans.
The aim of the present study was to establish whether the observation of hand movements may influence the activity of the precentral motor cortex in humans. As indicators of motor cortex activity we used rhythmic neuromagnetic oscillations of a frequency of around 20 Hz. Several lines of evidence indicate that this activity originates mainly in the precentral motor cortex (10). First, oscillatory activity of about 25 Hz has been recorded intraoperatively from the anterior wall of the human central sulcus (11). Second, the ≈20-Hz component of the rolandic magnetoencephalographic (MEG) rhythm originates slightly more anteriorly than the ≈10-Hz component, thereby agreeing with origin of this rhythm in the primary motor cortex (12). Finally, recent MEG experiments have shown significant coherence between the ≈20-Hz cortical MEG activity and the oscillatory modulation of motor unit firing in an isometrically contracting muscle (13, 14), thereby emphasizing the close connection of the ≈20-Hz activity to functions of the primary motor cortex.
The level of the ≈20-Hz activity enhances bilaterally within 500 ms after a median nerve (MN) stimulation (12, 15), and this highly repeatable and robust rebound can be used as an indicator of the state of the precentral motor cortex. It has been proposed that the rebound is associated with increased inhibition in the motor cortex (12). This hypothesis is supported by recent TMS data demonstrating decreased cortical excitability during that time period (16). Consequently, the suppression of the rebound likely reflects increased excitability of the motor cortex, either because of disinhibition or because of increased excitatory input. For example, the rebound is abolished when the subject manipulates an object during the MN stimulation (12, 15), and it is significantly diminished during motor imagery of manipulation movements (17), thereby implying involvement of the precentral motor cortex in the motor imagery process.
METHODS
The experiments were carried out on 10 normal subjects in a magnetically shielded room. Because of an absence of reactive rolandic rhythms, two subjects were discarded from the analysis. The present results, therefore, are based on eight subjects (four females, four males; age range, 25–36 years, mean = 30). Informed consent was obtained from each subject after full explanation of the experiment.
The left and right median nerves (LMN, RMN) were stimulated alternately at the wrists with 0.2-ms constant-current pulses once every 1.5 s, with stimulus intensities (7–13 mA in different subjects, median = 9 mA) exceeding the motor threshold.
Conditions.
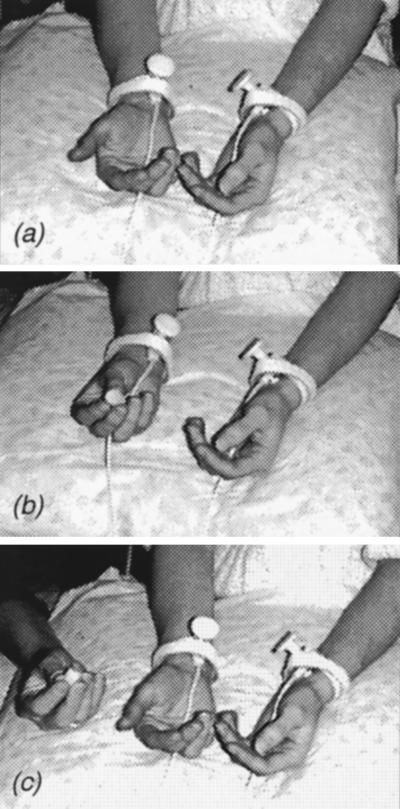
The signals were recorded (i) when the subjects rested relaxed with no task to perform, (ii) when they manipulated a small object with their right hand, and (iii) when they viewed one of the experimenters making similar movements with her right hand on the subject’s right side (see Fig. 1). The same order was used for all subjects, and at the end of the session, condition (i) was repeated to assess the signal replicability. Moreover, spontaneous cortical activity without median nerve stimuli was recorded for 1 min with the subject keeping the eyes open and for 1 min with eyes closed.
Figure 1.
Schematic presentation of the experimental condition. During the experiment the subject was sitting beneath the magnetometer and both median nerves were stimulated alternately. (a) Resting condition: the subject has no task. (b) Acting condition: the subject manipulates a small object with her right hand. (c) Action viewing: the subject views another person performing similar manipulations.
Five subjects, who had all participated in the main experiment, were tested in an additional session in which they were instructed to watch attentively (i) light-emitting diodes (LEDs) changing in color randomly from time to time and (ii) a display with a dot moving randomly within a virtual rectangle, 13 cm × 14 cm in size, and randomly changing its direction once every 2 s. The display was either in front of the subject (distance about 1 m) or close to his/her right hand; the subject was instructed to observe attentively the dot movement and to find out any systematic features in the pattern. During a further control session, all previous conditions were repeated for each subject, but now, surface electromyograms also were recorded from the right first interosseus, thenar, and forearm extensor muscles.
Recording.
Cortical magnetic signals were recorded with a 122-channel SQUID neurogradiometer Neuromag-122 (Neuromag; Helsinki) (18), which houses figure-eight-shaped flux transformers. In this way, the two orthogonal, tangential magnetic field gradients were obtained simultaneously at 61 recording sites. Such planar gradiometers measure the largest signals just above local source currents. The recording passband was 0.03–190 Hz, and the signals were digitized at 597 Hz. For evoked responses, the analysis period started 100 ms before the stimulus and lasted for 500 ms. About 90 artifact-free single responses were averaged on-line separately for each stimulus. The ongoing spontaneous activity was recorded continuously and stored on an optical disk for off-line analysis.
Data Analysis.
Sources of evoked and oscillatory signals were modeled as single current dipoles during clearly dipolar field patterns. For dipole identification, the head was assumed to be a sphere, the dimensions of which were found on the basis of the MRI of the subject’s head. MRIs were available for seven subjects. The two coordinate systems (MEG and MRI) were aligned by applying markers in MR imaging and by identifying these landmarks by a three-dimensional digitizer (Isotrak 3S10002, Polhemus Navigation Sciences, Colchester, VT) before MEG recordings. Amplitude spectra of the spontaneous activity were calculated from the resting conditions (eyes open and closed with no stimuli). The reactivity of the rolandic ≈20-Hz activity, supposed to be generated in the precentral motor cortex, then was quantified by first filtering the signals through 14–30 Hz (typically 15–25) depending on the individual frequency maxima. The filtered signals were rectified by calculating their absolute values and finally averaged time-locked to the MN stimuli. This “temporal spectral evolution” (TSE) analysis (12) reveals time-locked changes in the level of the rhythmic activity. The 7- to 15-Hz activity, which originates mainly in the postcentral somatosensory cortex, was quantified in the same manner, whereas no attempt was made to analyze the low-amplitude frequencies above 30 Hz. The electromyograms were rectified and their background levels were compared among the conditions.
RESULTS
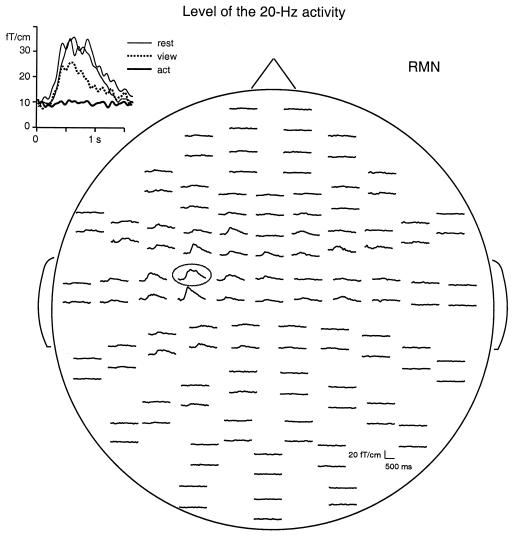
Fig. 2 illustrates the results of one subject. During the resting condition the ≈20-Hz activity level in the rolandic region increased immediately after RMN stimulation and reached its maximum about 500 ms after the stimulus. The Inset in Fig. 2 shows that the rebound was abolished during object manipulation and strongly diminished and shortened during action-viewing condition. The rebound was highly consistent during repeated measurements (the first and the last recording of the session): the individual amplitude differences between the two replications were, on average, 7% across the eight subjects.
Figure 2.
Level of the 15- to 27-Hz activity of subject SS as a function of time, recorded with the 122-channel neurogradiometer during the resting condition. Signals are shown from the time of RMN stimuli to 1,450 ms afterward. The head is viewed from the top. The upper and lower traces of each signal pair refer to the latitudinal and longitudinal gradients, respectively. Inset shows signals from the left rolandic region enlarged and responses from all conditions superimposed.
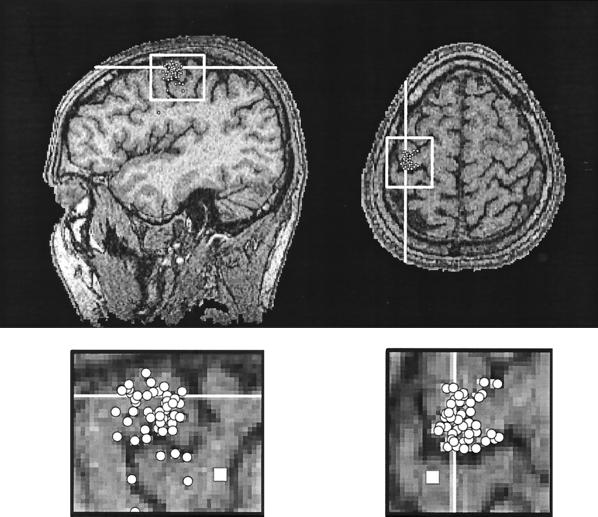
Fig. 3 shows that the sources of the 20-Hz activity are clustered into the cortex just anterior to the central sulcus, in line with earlier observations that the ≈20-Hz rebound is generated predominantly in the posterior part of the precentral cortex (12, 15, 17). In drawing these conclusions we have also taken into account the following facts. First, the MEG picks up signals mainly from fissural cortex (19), and thus the apparent source locations on the gyri probably reflect inaccuracies of modeling the sources of the noisy unaveraged MEG signals. Second, the source of the 20-ms somatosensory response, indicated by the squares in the enlarged Insets (Fig. 3), is posterior to the 20-Hz source cluster, a finding further supporting generation of the ≈20 Hz oscillatory activity in the precentral gyrus. Third, the hand area of the primary motor cortex is mostly buried in the fissural cortex.
Figure 3.
Source locations of the 20-Hz activity in the left hemisphere of subject SS. The dots illustrate single, equivalent current dipoles used to model the field pattern during single cycles of the 20-Hz oscillation. The clusters are enlarged below and illustrate a clear concentration of sources to the precentral motor cortex, just anterior to the central sulcus. The squares illustrate the source of the 20-ms response to right median nerve stimulation.
To quantify task effects on the rebound, the TSE curves over the hand regions of both hemispheres were integrated from 500 to 1,500 ms after median nerve stimuli, separately for LMN and RMN. During the manipulation condition, the 20-Hz rebounds were suppressed by 14.4 ± 2.8 fT/cm and 8.9 ± 2.1 fT/cm in the left and right hemisphere for RMN stimuli; the corresponding values were 9.4 ± 2.1 fT/cm and 11.6 ± 1.8 fT/cm for LMN stimuli, respectively. All these suppressions were statistically highly significant (P < 0.001; two-tailed t test for paired differences).
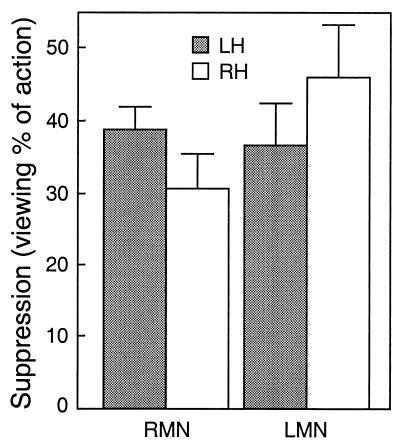
Fig. 4 illustrates the mean decreases of the ≈20-Hz rebounds, relative to the suppressions during object manipulation that can be considered to reflect the maximum action-related effect in each individual. The decreases during action viewing varied from 31 to 46% (P < 0.005) of the suppressions during manipulation and did not differ significantly between the LMN vs. RMN stimuli nor between the hemispheres. The rebound of the 7- to 15-Hz activity also was dampened during action viewing (relative changes 60–88% of the suppressions of the ≈20-Hz activity), but the suppressions were statistically significant only in the left hemisphere for LMN stimuli.
Figure 4.
Suppression of the 20-Hz rebound, calculated as a percentage of individual suppressions during object manipulation (mean + SEM of eight subjects).
During the control experiments (carried out in five of the eight subjects) the rebounds did not differ from the resting condition when the subject attentively viewed the color-changing LEDs. During viewing of the moving dot, however, the rebounds were decreased in all subjects; the decrease was, on average, 16–22% of that during manipulation (screen far and close, respectively). Both of these suppressions were statistically significantly smaller than those observed during action viewing (P = 0.021 and P = 0.042, respectively).
When these subjects manipulated the objects, the surface electromyogram showed, on average, 6.5 times stronger (P = 0.03) background activity in the first interosseus muscle, 2.8 times stronger (P = 0.03) activity in the thenar muscles, and practically no change in the forearm extensors compared with the resting condition. None of these muscles showed any increase of activity during action viewing, in accord with previous observations [Fadiga _et al._ (6)].
DISCUSSION
The present results show that the activity of the precentral motor cortex is significantly modified when the subject observes another individual manipulating objects. The effect is similar, but weaker in intensity, to that seen in the motor cortex when a subject executes the same action. Control experiments indicate that the observed changes cannot be explained by changes in the level of attention. Although no changes occurred during the attention-requiring observation of light spots, during viewing of the moving dot the motor cortex reacted similarly as during action observation, but to a significantly smaller extent.
We propose that the activation of motor cortex when a subject observes an action is related to the “mirror” phenomenon recently described in the monkey premotor cortex (2, 3). In area F5, a sector of the premotor cortex, neurons were found that discharge both when the monkey actively performs an action and when it observes a similar action made by another individual; action observation does not appear to influence the activity of the precentral motor neurons (F1). This discrepancy between the monkey and the present human data, however, may be only apparent since the conclusion that the monkey F1 neurons are not activated by action observation is based on action potential recordings whereas the present MEG recordings reflect changes in the synchrony of motor cortex neurons, which can be related to changes in cortical excitability (see Introduction), even at a level that is not associated with changes in the output firing of these neurons. Postsynaptic activation of F1 neurons is not only possible, but, given the strict anatomical connection between premotor and motor cortex (19–21), very likely.
Thus, our data are in line with the existence of an action observation/execution matching system in the human brain, involving the primary motor cortex, and similar to that found in monkeys. Because we focused only on changes of intrinsic brain rhythms generated in rather restricted areas of the sensorimotor cortex, our data do not exclude activation of the human homologue of the monkey F5 cortex or even some other motor-related brain areas, which do not have prominent intrinsic rhythms. The human homologue of the monkey F5 cortex is supposed to be situated in the Broca’s region in the inferior frontal lobe and thus significantly lateral to the present source clusters (for discussion, see ref. 22). Of course, minor contribution from some premotor areas to the 20-Hz oscillations cannot be excluded at present.
The conclusion of the existence of an action execution/observation matching system in humans is in accord with a recent TMS study showing that in humans the responses recorded from hand and arm muscles are facilitated during the observation of movements involving those muscles (6). Because TMS was applied over the precentral cortex, it was not possible in that study to distinguish whether the effect took place at the spinal or at the cortical level. The present results indicate that the activation of the motor cortex should play a role in the action-viewing-related facilitation of the TMS responses.
PET experiments carried out in normal human subjects during action observation have shown activation of the inferior frontal gyrus, the inferior parietal lobe, and a region within the superior temporal sulcus, but not of the precentral cortex (7, 8). The latter result could be due to a lack of sensitivity of PET method and the strict criteria used in the statistical parametric mapping analysis. On the other hand, the differential sensitivities of the techniques to variations in the degree of neuronal synchrony may in part explain the observed differences: neuronal synchrony, and thereby MEG signals, may change without too robust changes in the energy consumption and PET signals (23).
Schnitzler et al. (17) have shown that a mere motor imagery of exploratory finger movements produces a suppression of the motor-cortex 20-Hz rebound; the suppression was about 60% of that during real object manipulation and thus about 50% stronger than the change in the present study during action observation. The involvement of the precentral motor cortex in motor imagery also has been confirmed by functional magnetic resonance studies (24, 25). The postcentral somatosensory cortex also showed action-viewing-related suppression but to a smaller degree and less consistently than the motor cortex. We have recently observed modulations of the postcentral ≈10-Hz rhythm time-locked to changes of ocular dominance during binocular viewing (26), implying that the primary somatosensory cortex might be involved in a highly automatic circuitry that mediates visuomotor actions.
Although we instructed our subjects to view only the actions, we cannot rule out the possibility that they also used motor imagery during the action-viewing condition. However, if this was the case, the motor imagery component probably was negligible since the electromyograms did not show any increase of sustained muscle activity during action viewing, in contrast to the small but significant increase of electromyographic activity during active motor imagery (17).
Finally, the presence of the ≈20-Hz rebound effect during both action observation and motor imagery, as well as its robustness, suggests that it can be employed for studying disorders of the action-representation system in neurological and psychiatric patients.
Acknowledgments
We thank Ms. Mia Illman for expert help during the recordings and data analysis and Mr. Kimmo Uutela for help in the control experiment. This study was supported by the Academy of Finland, Human Frontiers Science Program, and by the Sigrid Jusélius Foundation.
ABBREVIATIONS
MEG
magnetoencephalography or magnetoencephalographic
MN
median nerve
LMN and RMN
left and right MN, respectively
TMS
transcranial magnetic stimulation
PET
positron emission tomography
References
- 1.Di Pellegrino G, Fadiga L, Fogassi L, Gallese V, Rizzolatti G. Exp Brain Res. 1992;91:176–180. doi: 10.1007/BF00230027. [DOI] [PubMed] [Google Scholar]
- 2.Gallese V, Fadiga L, Fogassi L, Rizzolatti G. Brain. 1996;119:593–609. doi: 10.1093/brain/119.2.593. [DOI] [PubMed] [Google Scholar]
- 3.Rizzolatti G, Fadiga L, Gallese V, Fogassi L. Cognit Brain Res. 1996;3:131–141. doi: 10.1016/0926-6410(95)00038-0. [DOI] [PubMed] [Google Scholar]
- 4.Jeannerod M. Behav Brain Sci. 1994;17:187–245. [Google Scholar]
- 5.Carey D, Perrett D, Oram M W. In: Handbook of Neuropsychology. Boller F, Grafman J, editors. New York: Elsevier; 1997. pp. 111–129. [Google Scholar]
- 6.Fadiga L, Fogassi L, Pavesi G, Rizzolatti G. J Neurophysiol. 1995;73:2608–2611. doi: 10.1152/jn.1995.73.6.2608. [DOI] [PubMed] [Google Scholar]
- 7.Rizzolatti G, Fadiga L, Matelli M, Bettinardi V, Paulesu E, Perani D, Fazio F. Exp Brain Res. 1996;111:246–252. doi: 10.1007/BF00227301. [DOI] [PubMed] [Google Scholar]
- 8.Grafton S T, Arbib M A, Fadiga L, Rizzolatti G. Exp Brain Res. 1996;112:103–111. doi: 10.1007/BF00227183. [DOI] [PubMed] [Google Scholar]
- 9.Decety J, Grèzes J, Costes N, Perani D, Jeannerod M, Procyk E, Grassi F, Fazio F. Brain. 1997;120:1763–1777. doi: 10.1093/brain/120.10.1763. [DOI] [PubMed] [Google Scholar]
- 10.Hari R, Salmelin R. Trends Neurosci. 1997;20:44–49. doi: 10.1016/S0166-2236(96)10065-5. [DOI] [PubMed] [Google Scholar]
- 11.Jasper H, Penfield W. Arch Psych Zeitschr Neurol. 1949;183:163–174. [Google Scholar]
- 12.Salmelin R, Hari R. Neuroscience. 1994;60:537–550. doi: 10.1016/0306-4522(94)90263-1. [DOI] [PubMed] [Google Scholar]
- 13.Conway B, Halliday D, Farmer S, Shahani U, Maas P, Weir A, Rosenberg J. J Physiol (London) 1995;489:917–924. doi: 10.1113/jphysiol.1995.sp021104. [DOI] [PMC free article] [PubMed] [Google Scholar]
- 14.Salenius S, Portin K, Kajola M, Salmelin R, Hari R. J Neurophysiol. 1997;77:3401–3405. doi: 10.1152/jn.1997.77.6.3401. [DOI] [PubMed] [Google Scholar]
- 15.Salenius S, Schnitzler A, Salmelin R, Jousmäki V, Hari R. NeuroImage. 1997;5:221–228. doi: 10.1006/nimg.1997.0261. [DOI] [PubMed] [Google Scholar]
- 16.Chen R, Corwell B, Cohen L G, Hallett M. Muscle Nerve. 1998;21:1585. (abstr.). [Google Scholar]
- 17.Schnitzler A, Salenius S, Salmelin R, Jousmäki V, Hari R. NeuroImage. 1997;6:201–208. doi: 10.1006/nimg.1997.0286. [DOI] [PubMed] [Google Scholar]
- 18.Ahonen A I, Hämäläinen M S, Kajola M J, Knuutila J E T, Laine P P, Lounasmaa O V, Parkkonen L T, Simola J T, Tesche C D. Physica Scripta. 1993;T:49. , 198–205. [Google Scholar]
- 19.Matelli M, Camarda R M, Glickstein M, Rizzolatti G. J Comp Neurol. 1986;251:281–298. doi: 10.1002/cne.902510302. [DOI] [PubMed] [Google Scholar]
- 20.Matsumura M, Kubota K. Neurosci Lett. 1976;11:241–246. doi: 10.1016/0304-3940(79)90001-6. [DOI] [PubMed] [Google Scholar]
- 21.Muakkassa K F, Strick P. Brain Res. 1979;177:176–182. doi: 10.1016/0006-8993(79)90928-4. [DOI] [PubMed] [Google Scholar]
- 22.Rizzolatti G, Arbib M. Trends Neurosci. 1998;21:188–194. doi: 10.1016/s0166-2236(98)01260-0. [DOI] [PubMed] [Google Scholar]
- 23.Hari R. In: Visualization of Information Processing in the Human Brain: Recent Advances in MEG and Functional MRI. Hashimoto I, Okada Y, Ogawa S, editors. New York: Elsevier; 1996. , Electroencephalogr. Clin. Neurophysiol. Suppl., pp. 47–54. [Google Scholar]
- 24.Porro C A, Francescato M P, Cettolo V, Diamond M E, Baraldi P, Zuiani C, Bazzocchi M, di Prampero P E. J Neurosci. 1996;16:7688–7698. doi: 10.1523/JNEUROSCI.16-23-07688.1996. [DOI] [PMC free article] [PubMed] [Google Scholar]
- 25.Roth M, Decety J, Raybaudi M, Massarelli R, Delon-Martin C, Segebarth C, Morand S, Gemignani A, Décorps M, Jeannerod M. NeuroReport. 1996;7:1280–1284. doi: 10.1097/00001756-199605170-00012. [DOI] [PubMed] [Google Scholar]
- 26.Vanni, S., Portin, K., Virsu, V. & Hari, R. (1998) Neuroscience, in press. [DOI] [PubMed]


