Differential chromatin marking of introns and expressed exons by H3K36me3 (original) (raw)
. Author manuscript; available in PMC: 2009 Sep 1.
Published in final edited form as: Nat Genet. 2009 Feb 1;41(3):376–381. doi: 10.1038/ng.322
Abstract
Variation in patterns of methylations of histone tails reflects and modulates chromatin structure and function1-3. To provide a framework for the analysis of chromatin function in C. elegans, we generated a genome-wide map of histone H3 tail methylations. We find that C. elegans genes show similarities in distributions of histone modifications to those of other organisms, with H3K4me3 near transcription start sites, H3K36me3 in the body of genes, and H3K9me3 enriched on silent genes. Unexpectedly, we also observe a striking novel pattern: exons are preferentially marked with H3K36me3 relative to introns. H3K36me3 exon marking is dependent on transcription and its level is lower in alternatively spliced exons, supporting a splicing related marking mechanism. We further show that the difference in H3K36me3 marking between exons and introns is evolutionarily conserved in human and mouse. We propose that H3K36me3 exon marking in chromatin provides a dynamic link between transcription and splicing.
Chromatin regulation has been studied in a variety of systems, but most extensively in unicellular yeasts and mammalian cells. C. elegans has many features that make it well-suited as an alternative system for studies of chromatin regulation. Of particular note are its well-annotated genome, the ease of RNAi, and the rich resource of chromatin mutants for loss of function studies4-7. Importantly, C. elegans has a complement of chromatin factors very similar to that of humans, in contrast to yeast8 and allows investigations of chromatin function in a multicellular organism9,10. Because modifications to histone tails are correlated with and can regulate chromatin structure1-3, we decided to map their positions genome-wide, to provide a framework for chromatin studies in C. elegans.
To generate an initial map of the distributions of histone methylations across the C. elegans genome, we used chromatin immunoprecipitation (ChIP) followed by microarray hybridization to determine the genome-wide association of trimethylation of lysine 4, lysine 9 and lysine 36 of histone H3 (H3K4me3, H3K9me3, and H3K36me3). We prepared chromatin extracts from highly synchronized triplicate wild-type third larval stage worms and carried out chromatin immunoprecipitations using commercial antibodies (see Methods). Immunoprecipitated DNA was amplified and hybridized to 2.1 million feature full genome tiling microarrays (Nimblegen). Pairwise comparisons of same antibody ChIPs showed strong correlation between replicate data (supplementary table 1), and the three replicates showed similar enrichment patterns across different genomic regions (Fig. 1a, b). To correct for differences in nucleosome occupancy, we subtracted the H3 mean ChIP signal from those of H3K4me3, H3K9me3, and H3K36me3 (see Methods). To investigate relationships between transcription and different histone modifications, we generated four sets of genes: (1) top10: those in the top 10% of expression level in our samples, determined by gene expression profiling. (2) bottom10: those in the bottom 10% of expression level. (3) ubiq: genes annotated or expected to be actively transcribed in all nuclei. (4) serp: serpentine receptor genes, most of which are thought to encode chemosensory receptors transcribed in only a few neurons and thus to be transcriptionally inactive in most nuclei11.
Figure 1. Patterns of histone methylations across C. elegans genes.
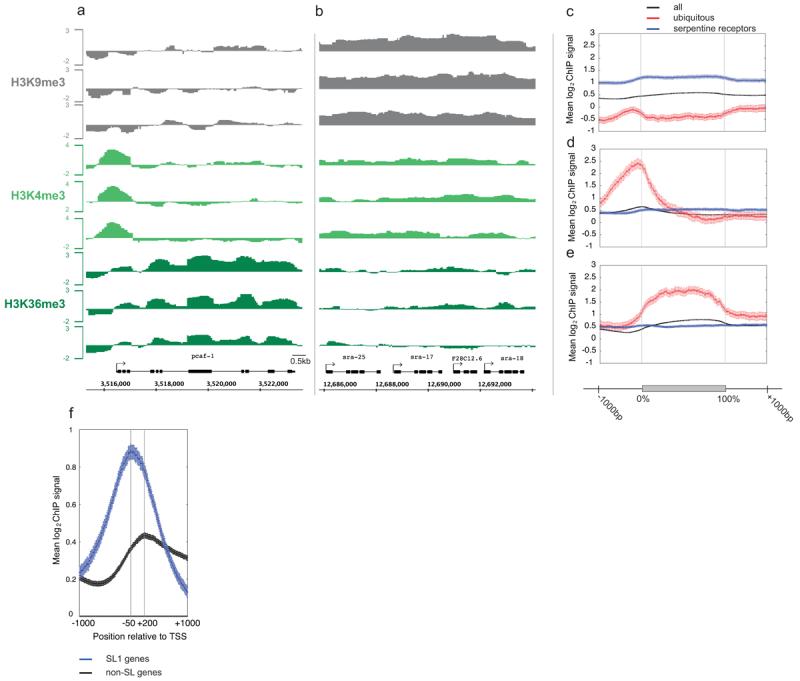
(a, b). Mean log2 ChIP signal of normalized triplicate samples across a genomic region containing (a) an actively transcribed gene and (b) a cluster of transcriptionally repressed genes. (c) H3K9me3, (d) H3K4me3, and (e) H3K36me3 mean log2 ChIP signals across all genes (black), ubiq genes (red) and serp genes (blue) aligned at the first and last nucleotides (0% and 100%) and extended with 1kb upstream and downstream sequence. (f) H3K4me3 mean log2 ChIP signals from −1000 to +1000 relative to TSSs (transcript start sites; defined as the first known nucleotide in the mature transcript, not including trans-spliced leaders). Blue, SL1 genes; black, genes not annotated to contain spliced leaders.
To gain initial insight into gene regions enriched for different modifications, we plotted mean log2 ChIP signals across all genes. We aligned genes at the first and last nucleotides of the annotated transcripts and extended these regions with 1kb upstream and 1kb downstream of genomic DNA (Fig. 1c-e). We call the first base of annotated transcript the TSS (transcript start site). Similar to other organisms12-16 we observed a peak of H3K4me3 enrichment near the TSS that correlates with transcriptional activity (Fig. 1d and Supp Fig 1). Highly transcribed genes (ubiq and top10) show strong 5′ enrichment of H3K4me3, but inactive genes (serp and bottom10) show no enrichment.
In C. elegans, many genes are trans-spliced at their 5′ ends to a 21bp leader sequence17. In these cases, the transcription start sites are not known because the 5′ end of the primary transcript is spliced off and degraded. In addition, some groups of genes are transcribed in operons, with trans-splicing separating transcripts from different genes. Spliced leader SL1 is found on genes adjacent to promoters and SL2 generally occurs on downstream operon genes not adjacent to promoters. To investigate the relationship between H3K4me3 and the transcription start site, we separated genes into SL1 genes and those not annotated to contain SL1 or SL2. We find a peak of H3K4me3 200bp downstream of the presumed TSS (the first annotated base) for non-SL1 annotated genes (Fig. 1f). In contrast, the peak of H3K4me3 for SL1 genes occurs 50bp upstream of the first annotated base. The H3K4me3 peak position suggests that the transcription start site for SL1 genes is on average 250bp upstream of the trans-splice site. Peaks of H3K4me3 should prove a useful guide for identifying promoters of SL1 and non-SL1 genes.
We next looked at the genome-wide distribution of H3K9me3. This modification is generally associated with repressed chromatin1-3. In mammalian cells, H3K9me3 is enriched in repressed constitutive heterochromatin, repetitive DNA, DNA transposons, and other repetitive elements18,19. Studies on small gene sets also detected H3K9me3 in the bodies of actively transcribed genes20,21, but this does not appear to be a general property based on genome-wide studies22,23. In C. elegans chromatin, we find that H3K9me3 is highly enriched across inactive genes, covering promoters, transcribed regions, and 3′ regions (blue line in Fig. 1c and Supplementary Fig. 1). In contrast, active genes show very low H3K9me3 signals (red line in Fig. 1c and Supplementary Fig. 1). Regions with clustered inactive genes often displayed continuous H3K9me3 enrichment across and between genes (Fig. 1b).
In yeast and mammalian chromatin, there is a well-documented association of H3K36me3 with transcribed regions1-3. The Set2 histone methytransferase that catalyzes this modification is associated with elongating RNA polymerase II, and the modification is made co-transcriptionally24-26. There is evidence that one function of H3K36me3 in the gene body is to prevent aberrant transcription initiation27,28. We find that C. elegans genes also show high levels of H3K36me3 in gene bodies. The level of H3K36me3 is low at the 5′ end, increases to a plateau, and then decreases at the 3′ end (Fig. 1e, Supplementary Fig. 1).
We observed that H3K36me3 signals often showed discrete peaks and troughs in the gene bodies, with peaks correlating with exonic regions (Fig. 1a). To explore whether this was a genome-wide phenomenon, we plotted H3K36me3 signals across aligned intron/exon and exon/intron boundaries. This showed a striking enrichment of H3K36me3 in exon regions compared to introns (Fig. 2a-c, Supplementary Fig. 2a; Supplementary Fig. 3). In contrast, neither H3K4me3 nor H3K9me3 showed exon enrichments (Fig. 2d-i, Supplementary Fig. 2b,c; Supplementary Fig. 3). H3K36me3 exon enrichment is not due to GC bias as exon signals are higher than those of introns across the whole range of %GC (Fig. 2j). We observed high and level H3K36me3 signals across exons of different lengths and lower signal across introns (Fig. 2b, c; Supplementary Fig. 3).
Figure 2. H3K36me3 is enriched across C. elegans exonic chromatin.
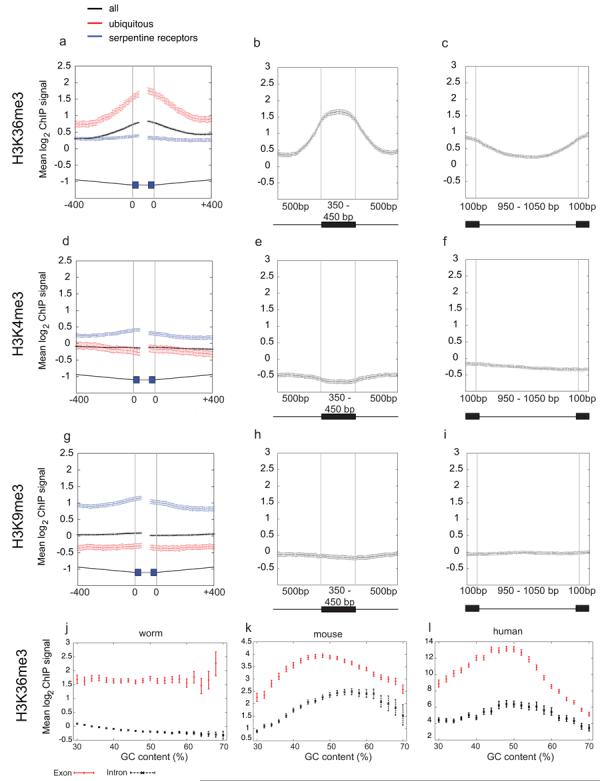
Mean log2 ChIP signals for (a-c) H3K36me3 (d-f) H3K4me3 and (g-i) H3K9me3. (a, d, g) plot signals across intron/exon and exon/intron boundaries where introns are at least 400bp and exons at least 80bp, excluding first and last exons. Black, exons of all genes; red, ubiq genes; blue, serp genes. In the gene model, thin grey lines represent 400bp of intron sequence, black boxes 40bp of exon sequence, and thick grey lines the centres of exons that vary in length. (b, e, h) mean log2 ChIP signals across exons of length 350-450bp flanked on both sides by introns of >=500bp. (c, f, i) mean log2 ChIP signals across introns of length 950-1050bp. In diagrams below plots, black boxes represent exons and black lines introns. Exon enrichment of H3K36me3 relative to a neighboring intron was confirmed by qPCR of non-amplified ChIP material in 8/8 cases tested (not shown). (j,k,l) H3K36me3 signals for exons and introns according to GC content. In C. elegans (j), mouse (k), and human (l), exon signals are higher than those of introns at every % GC implicating that enrichment of H3K36me3 on exons is not due to GC bias.
We next asked whether H3K36me3 exon marking was dependent on transcription or instead is a constitutive feature of exons. We found that the highly expressed ubiq and top10 genes show a higher level of exon marking relative to all genes whereas bottom10 and serp genes show low or no marking, respectively (Fig 2a, Supplementary Fig. 2a). We conclude that exon marking is transcription associated.
Because chromatin marking of exonic sequence with H3K36me3 depends on transcription and transcribed exons are spliced into mature transcripts, we wondered whether marking was related to the process of splicing. If so, then chromatin encoding exons that are constitutively included in transcripts would be expected to have a higher level of H3K36me3 than alternatively spliced exons. To address this possibility, we assembled a set of exon trios where an alternative exon is flanked by two constitutive exons and compared H3K36me3 levels in the three exons; the alternative and constitutive exons have similar GC contents (Fig. 3g). We also compared these trios to a control set of length matched trios where all three exons are constitutively included. We find that alternative exons have significantly reduced H3K36me3 exon signals relative to their constitutive neighbours and to the matched control exons (Fig. 3a). In contrast, there is no difference between the sets of trios in levels of H3K4me3 or H3K9me3 (Fig. 3b, c). The reduction in H3K36me3 signal in alternative exons indicates that exon marking is related to splicing.
Figure 3. Alternative exons have lower H3K36me3 signal than constitutive exons.

(a-e) Mean log2 ChIP signal of each C. elegans trio exon (a-c) or the average tag count for each mouse trio exon (d, e) is shown for the indicated histone modification. (f) Cartoon of alternative and constitutive trios of exons used in the analysis; colours correspond to data bars in (a-e). Exon sizes in alternative and constitutive sets were length matched. In (a) and (d) the alternative central exons (red) have significantly lower H3K36me3 signal than their matched constitutive central exons or than their constitutive neighbours (p<0.01). The matched central exons do not show reduced H3K36me3 relative to their neighbours. There is also no significant difference in signals for the alternative exons compared to the matched exons for other histone modifications. The higher signals for exon 1 in (b) and (e) are due to closer proximity to the TSS. For C. elegans trios, n=54, and for mouse n=190. Bars are 95% confidence intervals. (g, h) Cumulative GC content of constitutive and alternative exons in the alternative trios. (g) C. elegans (h) mouse. Alternative exons are similar in GC content to constitutive exons.
Although profiles of H3K36me3 have been extensively mapped in other organisms, exon marking has not been observed before. To ask whether this phenomenon is specific to C. elegans or alternatively might be widespread, we analysed genome-wide data for mapping of H3K36me3 in mouse and human chromatin22,23. These mapping data were generated by massively parallel sequencing rather than microarrays providing a platform control. Similar to the C. elegans data, we find a strong enrichment of H3K36me3 in both mouse and human exons relative to introns (Fig. 4a-c, g-i). In contrast, we find essentially level signals for H3K4me3 (Fig. 4d-f, j-l). As a further control we examined H3K27me1, found across active gene bodies like H3K36me322, and found similar signals in exons and introns. (Fig. 4m-o). As in C. elegans, H3K36me3 exon enrichment is not due to GC bias (Fig. 2k,l). The H3K36me3 signal in long exons increases to a plateau, similar to the pattern in C. elegans exons (Supplementary Fig 3). Across shorter exons more typical of human genes, H3K36me3 signal increases from 5′ to 3′ ends, resulting in an apparent peak near the 5′ splice site of the next intron (Fig. 4b). The lower H3K36me3 signals in introns increase near both the 5′ and 3′splice sites (Fig. 4c, i).
Figure 4. H3K36me3 is enriched across human and mouse exonic chromatin.

Average tag counts of middle exons after ChIP of (a) H3K36me3 (d) H3K4me3 from mouse MEF chromatin23 or (g) H3K36me3 (j) H3K4me3 (m) H3K27me1 from human CD4+ T cell chromatin22 across intron/exon and exon/intron boundaries where introns are at least 500bp and exons at least 200bp. In the gene model, thin grey lines represent 500bp intron sequence, black boxes 100bp exon sequence, and thick grey lines the centres of exons that vary in length. Mean ChIP tag counts across exons (b, e, h, k, n) or introns (c, f, i, l, o) for (b, c) mouse H3K36me3 (e, f) mouse H3K4me3 (h, i) human H3K36me3 (k, l) human H3K4me3 (n, o) human H3K27me1. Exons of length 350-450bp and introns of length 5-6kb were used, excluding the first 2kb of the gene to eliminate promoter specific signals. In diagrams below plots, black boxes represent exons and black lines introns.
The above analysis demonstrated that H3K36me3 exon marking is conserved in human and mouse. To explore whether marking in mammalian chromatin is likely to be related to splicing as it is in C. elegans, we used the mouse data23 to ask whether alternative exons show reduced H3K36me3 signals relative to constitutive exons. Indeed, we found that mouse alternative exons have significantly lower H3K36me3 signals but no difference in levels of H3K4me3 (Fig. 3d, e). The GC contents of the alternative exons are also similar to those of the constitutive exons (Fig. 3h). We conclude that H3K36me3 marking of expressed exons is conserved.
What could be the function of H3K36me3 exon marking? Because constitutively expressed exons have higher marking than alternatively included ones, marking has a relationship with cis-splicing. There is increasing evidence that a significant amount of splicing occurs co-transcriptionally rather than post-transcriptionally, making interactions between chromatin and the splicing machinery plausible29,30. Indeed, although to our knowledge marking of exons in chromatin has not been observed previously, there are recent reports of chromatin factors having roles in splicing. For example, the H3K4me3 binding protein CHD1 is associated with the splicesome and required for high splicing efficiency31. In addition, splicing factors have been reported to associate with both chromatin and the RNA polymerase II complex29,30. An attractive possibility is that marked exons in chromatin provide a mechanism to facilitate efficient splicing. For example, marked exons might aid recruitment of splicing factors to chromatin.
A second possibility is that the splicing machinery could regulate directly or indirectly K36 methyltransferases on the travelling RNA polymerase complex. If so, the composition of the travelling RNA polymerase complex might differ in exonic and intronic regions. For example, engagement in splicing reactions might reduce binding of splicing factors to Pol II. If these factors compete with or inhibit the H3K36me3 methyltransferase, this could result in regional differences in H3K36me3 on chromatin.
It is also known that the rate of RNA polymerase procession can vary over the gene and that changes in processivity can affect inclusion of alternative exons32,33. It would be interesting to investigate whether H3K36me3 affects processivity, which in turn could affect splicing. H3K36me3 is known to prevent spurious transcription initiation27,28, so it could have a general inhibitory influence on Pol II complex activity.
Materials and methods
Extract preparation
Triplicate samples of synchronized mid-L3 larvae were prepared by growing starved L1s in liquid culture at 20°C. Larvae were cleaned by sucrose flotation and flash frozen in liquid nitrogen. Frozen worms were ground to a fine powder and fixed in 1% formaldehyde/PBS for 10 minutes, quenched with 0.125uM glycine, and then washed 3X in PBS with protease inhibitors. The pellet was resuspended in 1ml of FA buffer (50mM HEPES/KOH pH7.5, 1mM EDTA, 1% Triton X-100, 0.1% sodium deoxyholate, 150mM NaCl with protease inhibitors) per 4ml of ground worm powder. Extract was sonicated to a size range of 200-1000bp using a Diagenode Bioruptor at high setting for 14 pulses, each lasting 30 seconds followed by a 1 minute pause. The extract was spun for 10 minutes at 16000g at 4°C, and the soluble fraction was flash frozen in liquid nitrogen and stored at −80°C until use.
Chromatin immunoprecipitation and expression profiling
Each ChIP was prepared in 500ul of FA buffer containing 1% sarkosyl. The following antibodies and extract amounts were used: anti-H3 (3ug abcam 1791 with 300ug extract); anti-H3K4me3 (5ul Active Motif AR0169 serum with 300ug extract); anti-H3K36me3 (3ug abcam ab9050 with 1mg extract); anti-H3K9me3 (3ug Upstate 07-442 with 1mg extract). Additionally 10% of extract was saved as a reference. After overnight rotation at 4°C, 40ul of blocked and washed magnetic protein A dynabeads (Invitrogen) were added and the incubation continued for 2 additional hours. Beads were washed at room temperature 2 times for 5 minutes in FA buffer, once in FA with 500mM NaCl for 10 minutes, once in FA with 1M NaCl for 5 minutes, once in TEL buffer (0.25M LiCl, 1% NP-40, 1% sodium deoxyholate, 1mM EDTA, 10mM Tris-HCl, pH 8.0) 10 minutes and two times in TE pH 8.0 for 5 minutes. DNA was eluted twice with 57 μl elution buffer (1% SDS in TE with 250mM NaCl) at 65°C, 15 minutes each time. Eluted DNA was incubated with 20 μg of RNase for 30 minutes at 37°C and then with 20 μg of Proteinase K for 1hour at 55°C. Input DNA was also diluted in 114ul elution buffer and treated with ChIP samples. Crosslinks were reversed overnight at 65°C. DNA was purified on Qiagen PCR purification columns and one third was used for LM-PCR amplification34. Two rounds of 20 cycle amplification were carried out; 100ng of the first round was used for the second round. 6.5 μg of each amplified DNA was used for hybridization to NimbleGen 2.1 million feature full genome tiled C. elegans microarrays (Roche). MA2C software35 was used to normalize chromatin immunoprecipitation microarray data and average replicates using the robust mean variance method where C=2. Concordance between ChIP replicates was assessed by calculating an overall Pearson correlation coefficient for every probe in each pairwise combination of same antibody ChIP (Supplementary Table 1). To correct for differences in nucleosome density, H3 normalized log ratios were subtracted from those of the modified histones (H3K4me3, H3K9me3, and H3K36me3). Total RNA was prepared from a small fraction of worms from each replicate sample and used for microarray expression profiling on Affymetrix C. elegans GeneChip arrays. The expression profiling datasets are available from ArrayExpress (accession number E-TABM-598) and the chromatin immunoprecipitation datasets from the modENCODE Data Coordination Center (http://www.modencode.org/Stein.shtml).
Data sets, genomic features and gene lists
We extracted genomic features from Wormbase36 release WS170, and from human and mouse Ensembl databases using custom Java scripts. We used mouse MEF ChIP seq data from23 and human CD4+ T cell ChIP seq data from22. The C. elegans ubiq gene set contains genes annotated as ubiquitously expressed in Wormbase and genes expected to be expressed in most or all cells: ribosomal protein genes, nuclear pore proteins, protein degradation machinery, basal transcription factors, and core translation factors. The serpentine receptor set contains confirmed or partially confirmed genes of the following classes: sra, srab, srb, srbc, srd, sre, srg, srh, sri, srj, srm, srn, srr, srsx, srt, sru, srv, srw, srx, srz, str sra, srab, srb, srbc, srd, sre, srg, srh, sri, srj, srm, srn, srr, srsx, srt, sru, srv, srw, srx, srz, str. Most encode chemosensory receptors expressed in only a few neurons and so are expected to be transcriptionally inactive in most nuclei11. To generate the top10 and bottom10 gene sets, we ranked all genes by mean expression array signal intensity across the three replicates, then took the top and bottom deciles (1841 genes each) to represent genes with high and low expression levels. The genes in these four sets are listed in Supplementary Table 2.
Visualizing signals across different gene features
In Figures 2, 4 and Supplementary Figure 2, intron/exon and exon/intron pairs were each aligned at the splice junctions. For C. elegans, we selected pairs where the intron was at least 400bp long and the exon at least 80bp long, and excluded first or last exons. For human and mouse, minimum intron length was 500bp and exon length 200bp. Isolated transcript start sites (TSSs) were used in Figure 1f, defined as the first base of an annotated transcript with no other transcript starts within 1kb. A subset of isolated TSSs were marked as SL1 or SL2 sites if they corresponded exactly with an “SL1_acceptor_site” or “SL2_acceptor_site” feature in Wormbase36. The remaining TSSs were marked as presumed non-trans-spliced starts.
To visualize the level of each histone modification across whole C. elegans gene regions, gene starts, intron, exons, and intron/exon junctions, we first collected normalized ChIP data around the relevant features. We then took samples at 10bp intervals across the resulting landscape model, collected all ChIP data mapping to each sampling point, and calculated 95% confidence intervals on likely values of the mean ChIP signal by bootstrapping. This procedure was repeated for subsets of genes (ubiq, serp, top10, bottom10).
To investigate possible technical effects in ChIP-chip data, we selected 50bp microarray probes which either overlapped exons or fell entirely within introns, and subdivided these depending on the number of G and C bases within the probe sequence. We then calculated the mean ChIP signal for both exonic and intronic probes in each G+C bin. ChIP-seq data was handled similarly, except that we considered arbitrary 50bp windows around each sampling point in the ChIP-seq dataset.
Analysis of alternatively-spliced exons
We collected all possible alternatively spliced exon trios: that is, groups of three successive exons from a gene with multiple annotated transcripts where the first and last exons are constitutively included in all annotated transcripts, but the central exon is only included in a subset of transcripts. For comparison, we also collected length-matched constitutively-spliced trios (i.e. three successive exons that are always included). Specifically, we required that the Cartesian difference between the three lengths of the alternatively-spliced trio and its matching constitutively-spliced trio to be <= 5bp. Some alternatively spliced trios were discarded at this point since a matching constitutive trio could not be found. We calculated the GC content of probes within trios (as described above) and confirmed that alternatively-spliced exons in this dataset do not have substantively different sequence composition. We only considered trios where genes showed significant H3K36me3 (for _C. elegans_, mean signal across all exons >=0.5; for mouse trios where at least one exon has non-zero tag counts and alternative exon minimum length of 100bp). We then collected mean histone modification log2 ratios (elegans) or the ratio of tag counts (mouse) across all exons in all trios. We normalized scores within each trio by subtracting the trio-wide mean from each exons score. Finally, we calculated 95% confidence intervals on the mean score at each of the three exons by bootstrapping. Where differences were observed, their significance was assessed by finding the difference in the means of the two sets of of log2 ratios, then bootstrapping to determine how frequently such a difference might be observed by chance.
Supplementary Material
Supplementary Figures
Supplementary Table 1
Supplementary Table 2
Acknowledgements
We thank all the members of our modENCODE consortium for help and advice, and especially the Lieb lab for help with ChIP protocol development and the Strome lab for discussions about H3K36me3. We are very grateful to Heather Holster for expert microarray processing at NimbleGen Systems. This work was supported by National Human Genome Research Institute modENCODE grant 1-U01-HG004270-01 to JA and XSL, by a Wellcome Trust Senior Research Fellowship (054523) and Cambridge Newton Trust funding to JA, by a Gates Foundation studentship to PK, and by a Wellcome Trust Research Career Development Fellowship (083563) to TD.
References
- 1.Berger SL. The complex language of chromatin regulation during transcription. Nature. 2007;447:407–12. doi: 10.1038/nature05915. [DOI] [PubMed] [Google Scholar]
- 2.Kouzarides T. Chromatin modifications and their function. Cell. 2007;128:693–705. doi: 10.1016/j.cell.2007.02.005. [DOI] [PubMed] [Google Scholar]
- 3.Shilatifard A. Chromatin modifications by methylation and ubiquitination: implications in the regulation of gene expression. Annu Rev Biochem. 2006;75:243–69. doi: 10.1146/annurev.biochem.75.103004.142422. [DOI] [PubMed] [Google Scholar]
- 4.Consortium C.e.S. Genome sequence of the nematode C. elegans: a platform for investigating biology. The C. elegans Sequencing Consortium. Science. 1998;282:2012–8. doi: 10.1126/science.282.5396.2012. [DOI] [PubMed] [Google Scholar]
- 5.Fire A, et al. Potent and specific genetic interference by double-stranded RNA in Caenorhabditis elegans. Nature. 1998;391:806–11. doi: 10.1038/35888. [DOI] [PubMed] [Google Scholar]
- 6.Kamath RS, et al. Systematic functional analysis of the Caenorhabditis elegans genome using RNAi. Nature. 2003;421:231–7. doi: 10.1038/nature01278. [DOI] [PubMed] [Google Scholar]
- 7.Timmons L, Fire A. Specific interference by ingested dsRNA. Nature. 1998;395:854. doi: 10.1038/27579. [DOI] [PubMed] [Google Scholar]
- 8.Cui M, Han M. Roles of chromatin factors in C. elegans development. WormBook. 2007:1–16. doi: 10.1895/wormbook.1.139.1. [DOI] [PMC free article] [PubMed] [Google Scholar]
- 9.Ercan S, et al. X chromosome repression by localization of the C. elegans dosage compensation machinery to sites of transcription initiation. Nat Genet. 2007;39:403–8. doi: 10.1038/ng1983. [DOI] [PMC free article] [PubMed] [Google Scholar]
- 10.Whittle CM, et al. The genomic distribution and function of histone variant HTZ-1 during C. elegans embryogenesis. PLoS Genet. 2008;4:e1000187. doi: 10.1371/journal.pgen.1000187. [DOI] [PMC free article] [PubMed] [Google Scholar]
- 11.Bargmann CI. Chemosensation in C. elegans. WormBook. 2006:1–29. doi: 10.1895/wormbook.1.123.1. [DOI] [PMC free article] [PubMed] [Google Scholar]
- 12.Schneider R, et al. Histone H3 lysine 4 methylation patterns in higher eukaryotic genes. Nat Cell Biol. 2004;6:73–7. doi: 10.1038/ncb1076. [DOI] [PubMed] [Google Scholar]
- 13.Bernstein BE, et al. Genomic maps and comparative analysis of histone modifications in human and mouse. Cell. 2005;120:169–81. doi: 10.1016/j.cell.2005.01.001. [DOI] [PubMed] [Google Scholar]
- 14.Ng HH, Robert F, Young RA, Struhl K. Targeted recruitment of Set1 histone methylase by elongating Pol II provides a localized mark and memory of recent transcriptional activity. Mol Cell. 2003;11:709–19. doi: 10.1016/s1097-2765(03)00092-3. [DOI] [PubMed] [Google Scholar]
- 15.Pokholok DK, et al. Genome-wide map of nucleosome acetylation and methylation in yeast. Cell. 2005;122:517–27. doi: 10.1016/j.cell.2005.06.026. [DOI] [PubMed] [Google Scholar]
- 16.Liu CL, et al. Single-nucleosome mapping of histone modifications in S. cerevisiae. PLoS Biol. 2005;3:e328. doi: 10.1371/journal.pbio.0030328. [DOI] [PMC free article] [PubMed] [Google Scholar]
- 17.Blumenthal T. Trans-splicing and operons. WormBook. 2005:1–9. doi: 10.1895/wormbook.1.5.1. [DOI] [PubMed] [Google Scholar]
- 18.Peters AH, et al. Partitioning and plasticity of repressive histone methylation states in mammalian chromatin. Mol Cell. 2003;12:1577–89. doi: 10.1016/s1097-2765(03)00477-5. [DOI] [PubMed] [Google Scholar]
- 19.Schotta G, et al. A silencing pathway to induce H3-K9 and H4-K20 trimethylation at constitutive heterochromatin. Genes Dev. 2004;18:1251–62. doi: 10.1101/gad.300704. [DOI] [PMC free article] [PubMed] [Google Scholar]
- 20.Brinkman AB, et al. Histone modification patterns associated with the human X chromosome. EMBO Rep. 2006;7:628–34. doi: 10.1038/sj.embor.7400686. [DOI] [PMC free article] [PubMed] [Google Scholar]
- 21.Vakoc CR, Mandat SA, Olenchock BA, Blobel GA. Histone H3 lysine 9 methylation and HP1gamma are associated with transcription elongation through mammalian chromatin. Mol Cell. 2005;19:381–91. doi: 10.1016/j.molcel.2005.06.011. [DOI] [PubMed] [Google Scholar]
- 22.Barski A, et al. High-resolution profiling of histone methylations in the human genome. Cell. 2007;129:823–37. doi: 10.1016/j.cell.2007.05.009. [DOI] [PubMed] [Google Scholar]
- 23.Mikkelsen TS, et al. Genome-wide maps of chromatin state in pluripotent and lineage-committed cells. Nature. 2007;448:553–60. doi: 10.1038/nature06008. [DOI] [PMC free article] [PubMed] [Google Scholar]
- 24.Krogan NJ, et al. Methylation of histone H3 by Set2 in Saccharomyces cerevisiae is linked to transcriptional elongation by RNA polymerase II. Mol Cell Biol. 2003;23:4207–18. doi: 10.1128/MCB.23.12.4207-4218.2003. [DOI] [PMC free article] [PubMed] [Google Scholar]
- 25.Li J, Moazed D, Gygi SP. Association of the histone methyltransferase Set2 with RNA polymerase II plays a role in transcription elongation. J Biol Chem. 2002;277:49383–8. doi: 10.1074/jbc.M209294200. [DOI] [PubMed] [Google Scholar]
- 26.Schaft D, et al. The histone 3 lysine 36 methyltransferase, SET2, is involved in transcriptional elongation. Nucleic Acids Res. 2003;31:2475–82. doi: 10.1093/nar/gkg372. [DOI] [PMC free article] [PubMed] [Google Scholar]
- 27.Carrozza MJ, et al. Histone H3 methylation by Set2 directs deacetylation of coding regions by Rpd3S to suppress spurious intragenic transcription. Cell. 2005;123:581–92. doi: 10.1016/j.cell.2005.10.023. [DOI] [PubMed] [Google Scholar]
- 28.Keogh MC, et al. Cotranscriptional set2 methylation of histone H3 lysine 36 recruits a repressive Rpd3 complex. Cell. 2005;123:593–605. doi: 10.1016/j.cell.2005.10.025. [DOI] [PubMed] [Google Scholar]
- 29.Allemand E, Batsche E, Muchardt C. Splicing, transcription, and chromatin: a menage a trois. Curr Opin Genet Dev. 2008;18:145–51. doi: 10.1016/j.gde.2008.01.006. [DOI] [PubMed] [Google Scholar]
- 30.Kornblihtt AR, de la Mata M, Fededa JP, Munoz MJ, Nogues G. Multiple links between transcription and splicing. Rna. 2004;10:1489–98. doi: 10.1261/rna.7100104. [DOI] [PMC free article] [PubMed] [Google Scholar]
- 31.Sims RJ, 3rd, et al. Recognition of trimethylated histone H3 lysine 4 facilitates the recruitment of transcription postinitiation factors and pre-mRNA splicing. Mol Cell. 2007;28:665–76. doi: 10.1016/j.molcel.2007.11.010. [DOI] [PMC free article] [PubMed] [Google Scholar]
- 32.de la Mata M, et al. A slow RNA polymerase II affects alternative splicing in vivo. Mol Cell. 2003;12:525–32. doi: 10.1016/j.molcel.2003.08.001. [DOI] [PubMed] [Google Scholar]
- 33.Howe KJ, Kane CM, Ares M., Jr. Perturbation of transcription elongation influences the fidelity of internal exon inclusion in Saccharomyces cerevisiae. Rna. 2003;9:993–1006. doi: 10.1261/rna.5390803. [DOI] [PMC free article] [PubMed] [Google Scholar]
- 34.Ren B, et al. Genome-wide location and function of DNA binding proteins. Science. 2000;290:2306–9. doi: 10.1126/science.290.5500.2306. [DOI] [PubMed] [Google Scholar]
- 35.Song JS, et al. Model-based analysis of two-color arrays (MA2C) Genome Biol. 2007;8:R178. doi: 10.1186/gb-2007-8-8-r178. [DOI] [PMC free article] [PubMed] [Google Scholar]
- 36.Rogers A, et al. WormBase 2007. Nucleic Acids Res. 2008;36:D612–7. doi: 10.1093/nar/gkm975. [DOI] [PMC free article] [PubMed] [Google Scholar]
Associated Data
This section collects any data citations, data availability statements, or supplementary materials included in this article.
Supplementary Materials
Supplementary Figures
Supplementary Table 1
Supplementary Table 2