Paired-End Mapping Reveals Extensive Structural Variation in the Human Genome (original) (raw)
. Author manuscript; available in PMC: 2009 Apr 29.
Published in final edited form as: Science. 2007 Sep 27;318(5849):420–426. doi: 10.1126/science.1149504
Abstract
Structural variation of the genome involves kilobase- to megabase-sized deletions, duplications, insertions, inversions, and complex combinations of rearrangements. We introduce high-throughput and massive paired-end mapping (PEM), a large-scale genome-sequencing method to identify structural variants (SVs) ~3 kilobases (kb) or larger that combines the rescue and capture of paired ends of 3-kb fragments, massive 454 sequencing, and a computational approach to map DNA reads onto a reference genome. PEM was used to map SVs in an African and in a putatively European individual and identified shared and divergent SVs relative to the reference genome. Overall, we fine-mapped more than 1000 SVs and documented that the number of SVs among humans is much larger than initially hypothesized; many of the SVs potentially affect gene function. The breakpoint junction sequences of more than 200 SVs were determined with a novel pooling strategy and computational analysis. Our analysis provided insights into the mechanisms of SV formation in humans.
Structural variation of large segments (>50 kb) of the human genome was recently found to be widespread in healthy individuals (1-4), with ~4000 affected genomic loci currently listed in the Database of Genomic Variants (DGV) (2). Structural variants (SVs) may have a more significant impact on phenotypic variation than single-nucleotide polymorphisms (SNPs) (4, 5). SVs have been implicated in gene expression variation (5), female fertility (6), susceptibility to HIV infection (7), systemic autoimmunity (8), and genomic disorders such as Williams-Beuren syndrome and velocardiofacial syndrome (9, 10). Thus, understanding the full extent of structural variation is important for understanding phenotypic variation and genetic disease in humans.
Previous methods for detecting SVs used comparative genome hybridization—array-CGH, which involves DNA microarrays and detects copy-number variants, or CNVs (4) and fosmid paired-end sequencing (FPES) (3)—at relatively low resolution (>50 kb for array-CGH, >8 kb for FPES). Note that these methods map SVs below the resolution where breakpoints can be detected (for array-CGH) or are laborious (for FPES). Consequently, breakpoint junction sequences of a limited number of SVs and/or CNVs have been reported (2, 3, 11). Methods for comprehensively detecting SVs of <10 kb, which may encompass most variants, and for mapping breakpoints are lacking; thus, how SVs affect genes and the mechanisms by which SVs form are not known.
Development of paired-end mapping for detecting SVs
In order to identify SVs more accurately, we developed paired-end mapping (PEM), which involves the preparation and isolation of paired ends of 3-kb fragments (12), and their massive sequencing with 454 technology (Fig. 1) (13). The large number of paired-end reads was optimally mapped to the human genome computationally (12). Structural rearrangements were identified as significant differences between the fragments identified by the paired-end reads and the corresponding regions of the reference sequence. Five different signatures (i to v) were used to predict SVs (12) (Fig. 1B). (i) Deletions relative to the reference genome were identified by paired ends spanning a genomic region in the reference genome longer than a specified cutoff (Fig. 1). (ii) Simple insertions relative to the reference genome were predicted with paired ends that spanned a region shorter than a cutoff. (iii) Mated insertions contained sequences connected to a distal locus on the basis of their paired ends. (iv) Inversions were detected through a relative orientation different from the reference genome. (v) Unmated insertions contained sequences connected to a distal locus; one of the two expected breakpoints remained undetected. Unless stated otherwise, we treated insertions and deletions as “SV indels,” because a deletion in one individual corresponds to an insertion in the other. These events can be distinguished with additional analyses (see below).
Fig. 1.

(A) Flow chart illustrating PEM. (i) Genomic DNA was sheared to yield DNA fragments ~3 kb; (ii) biotinylated hairpin adapters were ligated to the fragment ends; (iii) fragments were circularized (iv) and randomly sheared; (v) linker (+) fragments were isolated; (vi) the library was subjected to 454 sequencing (13). (vii) Paired ends were analyzed computationally to determine (viii) the distribution of “paired-end spans” (shown for a single 454 sequencing pool). (B) Types of SVs. Deletions were predicted from paired-end spans larger than a specified cutoff D; simple insertions had a span < cutoff I; inversions are seen when ends map to the genome at different relative orientations; other types of insertions (defined in the text as mated and unmated) were detected with evidence of sequence integration from a distal locus.
For all rearrangement types (i to v), we required that SVs were supported by at least two independent paired-end reads to eliminate false-positives that may arise from rare chimerical constructs that can form during the ligation reaction (12). This approach identifies deletions, inversions, mated insertions, and unmated insertions that are ~3 kb or larger, as well as simple insertions 2 to 3 kb in size. From two or more paired-end sequences per SV, we obtained an average breakpoint resolution of 644 base pairs (bp) (12), a range that facilitates the validation of SVs by polymerase chain reaction (PCR).
PEM detection of SVs in the human genome
We applied PEM to map SVs in the genomes of two individuals: a female (NA15510) in which 297 SV events had been mapped with FPES (12) and a second female (NA18505; Yoruba, Ibadan, from Nigeria) previously analyzed in the international HapMap project (14). The ancestry of NA15510 is unknown, however, the individual appears to be of European descent as described below. We sequenced over 10 million (NA15510) and 21 million (NA18505) paired ends, yielding effective coverages of 2.1- and 4.3-fold relative to the six billion–base pair diploid genome (12) to identify ~62% and 93% of the SVs, respectively (12). We identified 1175 SV indels (853 deletions, 322 insertions, i.e., 39 simple, 82 mated, 201 unmated) and 122 inversions, for a total of 1297 SV events (Table 1 and tables S1 and S2). For 20% of these events, only one out of two expected breakpoint junctions were identified (particularly in the European sample, which lacks saturation). Extrapolating to full coverage, we predict 761 and 887 SV events relative to the reference genome for NA15510 and NA18505, respectively, at this level of resolution. SVs were distributed throughout the genome with a number of hotspots (Fig. 2), such as an 8-megabase (Mb) region at 22q11.2 containing 13 SVs and an 18-Mb region at 7q11 containing 29 SVs. Both regions are involved in relatively frequent genomic disorders (velocardiofacial syndrome and Williams-Beuren syndrome, respectively), and SVs in healthy individuals at those loci were previously observed at lower resolution [e.g., (2)].
Table 1.
Validation of SVs identified by PEM. Array-CGH experiments were scored for indels in NA15510 not shared with NA18505. An additional 88 SV breakpoint junctions were deduced from the Celera assembly (table S1). Totals are underlined. Genomewide estimates of SVs are 761 for NA15510 and 887 for NA18505.
| Total SVs | Intersection with SVs/CNVs in DGV | SVs confirmed by Celera assembly | Array-CGH | Fiber-Fish (no. of validated inversions indicated) | PCR spanning breakpoint junctions | SV events with sequenced breakpoint junctions | |
|---|---|---|---|---|---|---|---|
| Female of presumably European ancestry (NA15510) | |||||||
| SVs detected by PEM | 472 | 278 | 104 | 31 | 2 | 157 | 52 |
| SV indels | 422 | 249 | 95 | 31 | 132 | 51 | |
| Inversions | 50 | 29 | 9 | 2 | 25 | 1 | |
| Female of African ancestry (NA18505) | |||||||
| SVs detected by PEM | 825 | 495 | 103 | 2 | 354 | 61 | |
| SV indels | 753 | 454 | 97 | 328 | 59 | ||
| Inversions | 72 | 41 | 6 | 2 | 26 | 2 |
Fig. 2.
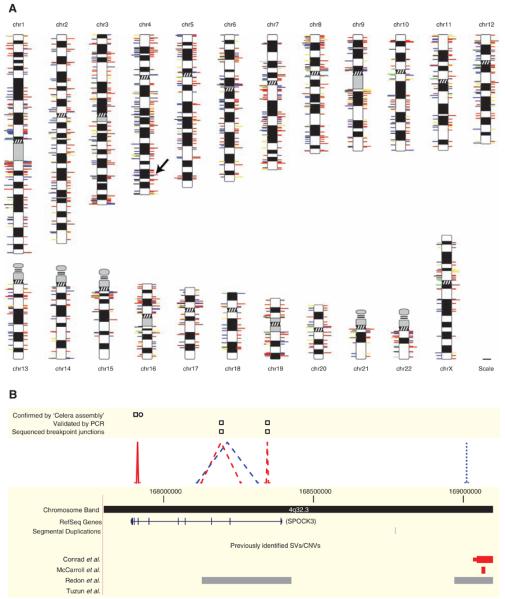
SVs identified in two humans. (A) SVs mapped onto chromosomal ideograms (12). Right side: Red, deletion; blue, insertion; and yellow, inversion. Double length indicates SVs observed in both individuals. Left side: Log-scale size of an event (events ≥1 Mb are drawn at same length, corresponding to the maximum length of a line); unmated insertions [i.e., events lacking a predicted breakpoint and thus size information (12)] and simple insertions (12) are depicted with 1-kb lines; line colors indicate repetitive sequences in ±3-kb window of the predicted breakpoint junction (12): red, SDs; blue, LINEs; yellow, LTRs; green, satellites; black, two or more repetitive elements with equal frequency; gray, no repeat association. The arrow indicates the region in (B). A high-resolution image of this figure is available as fig. S1. (B) Amplified view of chromosome 4 region. SVs in NA18505 are indicated with dashed lines (validation: squares); NA15510, dotted lines (validation: circle). SVs shared between individuals are solid lines. Colors are as in (A).
We compared the SVs identified in NA15510 to those in NA18505 and found that nearly half (45%) of the predicted SVs were shared between them (table S3): that is, 43% of the deletions, 52% of the insertions, and 43% of the inversions (12). Thus, a considerable fraction of the SVevents occur commonly in the population and are presumably ancient. It is also possible that “common” SVs are due to errors in the human reference sequence. However, this is likely to be rare, as 18 of 19 cases we tested by PCR contained the reference sequence in one or more DNA samples. Thus, many of the detected events are bona fide SVs and likely to occur commonly in humans.
We were able to confirm 41% of all deletion and inversion events predicted in (3) for NA15510. Because only 62% of NA15510 is covered in our study, extrapolation to full coverage predicts that PEM would identify ~65% of all SVs predicted in (3), including 70% of the deletions. False-positives may account for some of the discrepancies between studies, although 83 and 97% of predicted events were confirmed by (3) and us, respectively (see below). It is also possible that these two studies have different, conservative thresholds [see (3) and (12)], reducing the identification of true events. Regardless, PEM identified an additional 407 SVs (377 SV indels, 30 inversions) in NA15510 not previously detected, including many events <8 kb and also larger variants. Similarly, more SVs were detected in NA18505 than those previously identified at lower resolution (4), with an additional 813 SVs identified and fine-mapped.
The majority of SVs detected by PEM were small (Fig. 3). About 65% of all SVs were <10 kb and 30% were <5 kb; however, 15% of all predicted SVs were larger than 100 kb and events up to megabase level in size were predicted; size distributions were similar for NA15510 and NA18505. In addition, the size and extent of SVs found indicates that healthy individuals differ by several megabases of nucleotide sequence (Fig. 3B and table S1). We analyzed the fraction of heterozygous and homozygous SVs by PCR analysis (for both NA15510 and NA18505), and we searched for the allele represented in the human reference genome with paired-end sequences [for NA18505 (12)]. Our results confirmed a previous study (3) and revealed that 23% and 15 to 20% of the SVs in NA15510 and NA18505, respectively, are homozygous (12).
Fig. 3.

SV size distribution, sequence coverage, genes, and distribution of gene categories. (A) Size distribution of SVs (NA15510 and NA18505 combined). Arrow indicates the lower size cutoff for deletions. (B) Cumulative number of base pairs affected by SVs in relation to SV size (NA18505 only). (C) Solid line indicates cumulative number of RefSeq genes intersecting with SVs in relation to SV size (NA18505 only). Dashed line, randomly shuffled SV locations within the local genomic context (±50-kb window) exhibit an increase in gene overlap. (D) Enrichment or depletion of GO (annotation level 3) biological processes for genes intersecting with SVs (NA15510 and NA18505 combined). Annotations represented by <10 genes are designated “other” and are gray. **Significant enrichment in genes belonging to a category (P < 1_e_−14)(12); *significant depletion (P < 0.001).
SV validation
To validate PEM-SVs, we performed PCR analysis on 40 randomly chosen samples with five sets of primers spanning predicted breakpoint junctions (12). Of 34 SVs that could be scored, 33 (97%) yielded a single, clear PCR band at the expected size range (12). SVs were also confirmed and validated with five additional approaches: (i) comparison with SVs in DGV (2), (ii) comparison with an alternative human genome assembly (“Celera assembly”), (iii) DNA microarray–based high-resolution comparative genome hybridization (array-CGH) (15, 16), (iv) fiber-based, fluorescence in situ hybridization (fiber-FISH), and (v) a one-pass PCR assay spanning SV breakpoint junctions.
We found that 59 and 60%, respectively, of NA15510 and NA18505 SVs intersected with SVs represented in DGV (Table 1); the figures increase to 91 and 90%, respectively, for variants in the range 50 to 500 kb (12). Because the resolution of most SVs in DGV is low (>50 kb) (17), it is unclear whether the overlapping variants correspond to the same event. Comparison with the Celera assembly confirmed 104 (22%) and 103 (12%) of the NA15510 and NA18505 SVs, respectively (12). A higher fraction of events is probably shared with the Celera assembly, as many (>200) SV regions aligned poorly or coincided with gaps in the Celera assembly and were thus excluded from this analysis (12). The observation that a higher fraction of SVs is shared between NA15510 and the Celera assembly (which is primarily derived from a donor of European ancestry) indicates that NA15510 is of European origin.
Array-CGH experiments compared NA15510 DNA to NA18505 DNA with a set of eight oligonucleotide tiling arrays covering nonrepetitive regions of the genome. Of 48 NA15510-specific indels represented by at least 10 probes on the array [our detection limit (12)], 31 (65%) were validated by array-CGH (see Fig. 4 and table S1). The imperfect overlap may be because either some NA15510 SVs intersect with SVs in NA18505 and thus may not yield good array signals and/or array-CGH misses a portion of true-positive events (4).
Fig. 4.

Validation of SVs. (A) A 170-kb deletion detected with both array-CGH and PEM. (B) PCR products validating SVs as originally predicted from NA18505 (lane 2). Lanes 1 to 4 use DNAs from NA15510, NA18505, NA11997 (HapMap CEU, cell lines derived from 30 trios of European descent), and NA18614 (HapMap CHB, Han Chinese from Beijing), respectively. Primer sequences can be found in table S6. (C) Fiber-FISH validation of heterozygous inversions in NA18505. The inversion in the upper panel was independently validated in NA15510. Alternating patterns of fluorescent labels from adjacent probes indicate genomic rearrangement.
For four inversions, not reported previously in DGV (2), we performed fiber-FISH on stretched DNA and located PEM-identified inversion breakpoints at the correct position for three (Fig. 4 and table S1). We were unable to detect the fourth inversion, presumably because its size (≤4 kb) is below our detection limit for fiber-FISH.
In order to validate SVs for downstream sequence analyses, we further analyzed 261 SVs predicted in NA15510 and 616 predicted in NA18505 in a one-pass PCR test, focusing primarily on SVs not represented in the Celera assembly. For 249 SVs, DNA from a total of four individuals was analyzed (Fig. 4): NA15510, NA18505, NA11997 (European ancestry), and NA18614 (Asian). As a result, 58% of the predicted SVs were validated by PCR in one or more individuals, including the sample in which the SV was originally identified. For the tests performed on all four individuals, 89% shared SVs among two or more individuals and 48% shared SVs in all four individuals. We also examined segregation patterns of five SVs in parent-offspring trios and observed Mendelian segregation patterns of SVs in nine meioses (12). Thus, their presence in multiple individuals and their Mendelian segregation patterns indicate that the majority of SVs are genetically stable and unlikely to have formed de novo or in the cultured cells that were analyzed (4). Altogether, 551 unique SVs were validated by array-CGH, fiber-FISH, the Celera assembly, and/or PCR (table S1).
Overlap of SVs with genes and functional elements
We compared the locations of predicted SVs smaller than 100 kb [for which assigned sizes had high confidence (12)] with annotated genes and functional elements. We found that many (17%) of the SVs in both individuals may directly affect gene function by removing exons or fusing annotated protein-coding genes (40 RefSeq genes), by being positioned in introns (243 genes), or by altering gene copy number or orientation (32 genes). The fraction of SVs affecting genes is slightly less than that expected by chance (Fig. 3C), which suggests selective constraint against SVs (4). We also analyzed protein-coding genes by their gene ontology (GO) functional classes. Consistent with previous observations (1-4), we found genes involved in organismal physiological processes (e.g., immunity, and cell-cell signaling; both with P < 1_e_−14; hypergeometric test; Bonferroni correction) to be enriched with SVs (12), whereas genes involved in cellular physiological processes were depleted (P < 0.001) (Fig. 3D). Genes encoding proteins involved in interactions with the environment such as immune response, perception of smell, and perception of chemical stimuli were particularly likely to harbor SVs (12). Retrovirus- and transposition-related proteins also contain more SVs than expected by chance.
Genomewide analysis of SVs and associated breakpoints
To study SV formation, we determined the sequences surrounding breakpoint junctions with a new high-throughput approach (12). PCR products containing breakpoints were pooled and sequenced with 454 technology (13), and contigs were assembled (Fig. 5A). Breakpoints for a nonredundant set of 114 SVs were deduced with either a high-quality contig or at least two separate 454 reads (table S1). This method was most successful for SVs with breakpoints in regions that either have non-identical DNA sequences or share short (<200-bp) identity at the junctions. The sequence data also allowed us to identify 344 putative SNPs located adjacent to the sequenced SVs (12), which may serve as future predictors for the SVs (table S4).
Fig. 5.

Sequencing and analysis of SV breakpoint junctions. (A) PCR fragments spanning SVs were pooled and sequenced; breakpoints were determined from assembled contigs or ≥2 sequencing reads. (B) Representative sequenced SVs shown in relation to previous SV and/or CNV assignments [earlier SV and CNV assignments often extend outside of the depicted regions (3, 4)]. From top to bottom: SVs resulting from NHEJ, L1 retrotransposition, HERVK (retrovirus) insertion, (nonallelic) homologous recombination, gap closure (blue, insertions; red, deletions; orange, sequence gap; and yellow, inversions). Note that some SVs affect annotated genes. (C) Example breakpoint sequences (12). Upper case and green letters are for unaltered sequence; lower case for SV indel; solid arrows show microhomologies (indicative of NHEJ), duplication of target sequences (at retrotransposon or retrovirus insertion sites), and long stretches of sequence identity (12) (indicative of homologous recombination). Note that the fourth sequence (from top to bottom) shows an OR gene fusion in the main reading frame (breakpoints occurred in the long stretch of sequence identity).
The 114 sequenced SVs included events confirmed by the Celera assembly. Manual inspection of sequence alignments in 14 cases indicated that all 14 corresponded to the same SVs evident in the Celera assembly (12). We therefore included in our analyses an additional 88 (nonredundant) SVs confirmed by the Celera assembly for which breakpoints could be assigned with high confidence, which yielded a total of 202 SVs identified by PEM with determined breakpoint junctions (188 SV indels and 14 inversions). The types of events observed from sequenced SVs were similar to those deduced from the Celera assembly.
We initially examined the association of breakpoint junctions with elements in the human genome. Several studies [e.g., see (10)] have suggested an association of SVs with segmental duplications (SDs); following the analysis scheme in (18), we find that 28 of 202 SVs have at least one breakpoint that directly intersects an SD [~2.6-fold enrichment over the genomic background, _P_ < 0.0001 from permutations (12)]. Furthermore, many SVs occurred in short to medium-sized repetitive elements [30 for Alu SINEs (short interspersed nuclear elements), 74 for L1 LINEs (long interspersed nuclear elements), 3 for L2 LINEs, and 30 for LTRs (long terminal repeats)]. Out of the latter, L1 elements are significantly enriched (with P < 0.01), whereas L2 elements appear significantly depleted (P < 0.0001). Finally, Alu elements are not significantly enriched near SVs, despite previous reports (19).
Mechanisms of SV formation and effects on genes
Detailed manual analysis of the breakpoint junctions of SV indels revealed likely mechanisms as to how most SVs arose (see Fig. 5, B and C) and, in most cases, allowed us to distinguish insertion and deletion events. For example, entire L1 elements with poly(A) tails near the breakpoint junctions are inferred to be insertion events; recombination between homologous regions resulting in sequence loss indicates deletions. Insertion and deletion events can be further confirmed by comparison with other primate sequences (12).
Most SV indels originated from nonhomologous end-joining (NHEJ) (56%) and retrotransposition events (30%). NHEJ (20), in which breakpoint junctions were flanked by nonhomologous regions [except for short stretches of identical sequence (“microhomology”), typically <5 bp, that flank the junction] was prevalent even among large SVs (Fig. 4A and table S1) and in regions with large SDs. Most (90% of) retrotransposition events were due to L1 elements, although a small fraction (8%) corresponded to SVA [a composite element that was derived from three other repeats: short interspersed nuclear element-R, VNTR (variable number of tandem repeats), and _Alu_] elements (21). We also observed one instance of retroposition by an endogenous retrovirus, despite conflicting reports suggesting that these are not active or move infrequently in humans (21). Our finding indicates that these elements have been mobile in relatively recent human history (22). DNA transposition events (21) were not observed.
SVs have been found to be associated with duplicated regions, which suggests that many form by nonallelic homologous recombination (NAHR). Even though SVs and SDs are strongly associated, relatively few events (14% of all SV indels) are likely mediated by NAHR [recognizable through homologous regions flanking the breakpoint junctions (12)]. NAHR was rare even for large SVs as only 2 of 21 SV indels >20 kb in size originated from NAHR. Of these, 18 were formed through NHEJ, and for one, the mechanism was not assigned. NAHR events were located in: (i) highly repetitive elements: L1 elements (four cases), LTR elements (five cases), SINEs (six cases) and simple sequences (two cases), and (ii) high complexity regions: SDs (five cases) and unique DNA (five cases). As an interesting example of the latter, we observed a fusion involving the protein-coding regions of two olfactory-receptor (OR) genes, OR51A4 and OR51A2, resulting in a new gene predicted to encode a protein identical to OR51A4, with upstream regions from OR51A2 (Fig. 5, B and C). OR51A4 and OR51A2 are found in the rhesus monkey; their presence confirms that the “ancestral” region contains both genes and that SV formation involved a recent gene-fusion event. We suggest that deviation in gene content for the large OR gene family may lead to diversity of olfactory perception in the human population.
In addition to NHEJ, retrotransposition, and NAHR, other events may have occurred or could not be assigned. In four cases, simple sequence DNA was present at the breakpoint junctions; NAHR or other mechanisms may be involved in their formation (23). Four cases were unassigned, and two sequenced SVs closed gaps in the human reference sequence (see, e.g., Fig. 5, B and C).
We also analyzed 14 inversions. Four instances of homologous recombination between inverted repeats (HRIR) were observed; surprisingly, the remaining 10 inversions appeared to involve events that do not require homology. Overall, a large fraction of all of the SVs we sequenced (at least 57%) had one or both breakpoints in nonrepetitive sequence, indicating that high-complexity genomic regions are subject to structural variation.
Discussion
PEM enabled global detection of SVs at 3-kb resolution, and an average resolution of breakpoint assignment of 644 bp. We identified ~1300 SVs in two individuals, which suggests that humans may differ to a greater extent in SVs than in SNPs, when considering the total number of nucleotides affected. To date, most human genome–sequencing projects do not directly analyze SVs. Our study reveals that, given their high frequency, it will be essential to incorporate SV detection into human genome–sequencing projects (24). Overall, PEM is a cost-effective method both for improving genome assemblies and for revealing SVs present in the genome for a better understanding of human diversity.
PEM has several advantages over existing methods. First, PEM increases resolution of SV detection to the level of confirmation by PCR, and resolution can be further improved by more careful selection of evenly sized DNA fragments for circularization. Second, PEM does not require preparation of a DNA library that involves cloning. However, the short size of fragments (3 kb) used in this study hampers the detection of simple insertions >3 kb, although larger insertions can be detected by their mated ends. Similar to other SV detection methods, a limitation of PEM is that SVs in regions with multiple copies of highly similar and long (>3 kb) repeats are difficult to identify. Fortunately, although 45% of the human genome is composed of high-copy number repeat elements, these are often sufficiently divergent or short and can thus be distinguished by PEM. Additional refinements of PEM are also possible and will eventually allow detection of all SVs in the human genome.
Supplementary Material
S_table1
Suppl.data
Acknowledgments
We thank C. Turcotte, C. Celone, D. Riches, and 454 colleagues, and R. Bjornson at the Yale High Performance Computation Center (funded by NIH grant: RR19895-02) for technical support. Funding was provided by a Marie Curie Fellowship (J.O.K.), the Alexander von Humboldt Foundation (A.T.), the Wellcome Trust (N.P.C., M.E.H., J.C., and F.Y.), Roche Applied Science, and the NIH (Yale Center of Excellence in Genomic Science grant). Accessions can be found in table S5, and at http://sv.gersteinlab.org/.
References and Notes
- 1.Sebat J, et al. Science. 2004;305:525. doi: 10.1126/science.1098918. [DOI] [PubMed] [Google Scholar]
- 2.Iafrate AJ, et al. Nat. Genet. 2004;36:949. doi: 10.1038/ng1416. [DOI] [PubMed] [Google Scholar]
- 3.Tuzun E, et al. Nat. Genet. 2005;37:727. doi: 10.1038/ng1562. [DOI] [PubMed] [Google Scholar]
- 4.Redon R, et al. Nature. 2006;444:444. [Google Scholar]
- 5.Stranger BE, et al. Science. 2007;315:848. doi: 10.1126/science.1136678. [DOI] [PMC free article] [PubMed] [Google Scholar]
- 6.Stefansson H, et al. Nat. Genet. 2005;37:129. doi: 10.1038/ng1508. [DOI] [PubMed] [Google Scholar]
- 7.Gonzalez E, et al. Science. 2005;307:1434. doi: 10.1126/science.1101160. [DOI] [PubMed] [Google Scholar]
- 8.Fanciulli M, et al. Nat. Genet. 2007;39:721. doi: 10.1038/ng2046. [DOI] [PMC free article] [PubMed] [Google Scholar]
- 9.Lupski JR, Stankiewicz P. PLoS Genet. 2005;1:e49. doi: 10.1371/journal.pgen.0010049. [DOI] [PMC free article] [PubMed] [Google Scholar]
- 10.Freeman JL, et al. Genome Res. 2006;16:949. doi: 10.1101/gr.3677206. [DOI] [PubMed] [Google Scholar]
- 11.Korbel JO, et al. Proc. Natl. Acad. Sci. U.S.A. 2007;104:10110. [Google Scholar]
- 12.Materials and methods are available as supporting material on Science Online.
- 13.Margulies M, et al. Nature. 2005;437:376. doi: 10.1038/nature03959. [DOI] [PMC free article] [PubMed] [Google Scholar]
- 14.The International HapMap Consortium Nature. 2005;437:1299. [Google Scholar]
- 15.Selzer RR, et al. Genes Chromosomes Cancer. 2005;44:305. doi: 10.1002/gcc.20243. [DOI] [PubMed] [Google Scholar]
- 16.Urban AE, et al. Proc. Natl. Acad. Sci. U.S.A. 2006;103:4534. [Google Scholar]
- 17.Coe BP, et al. Genomics. 2007;89:647. doi: 10.1016/j.ygeno.2006.12.012. [DOI] [PubMed] [Google Scholar]
- 18.Kim PM, et al. in preparation, available at http://arxiv.org/abs/0709.4200v1.
- 19.Bailey JA, Liu G, Eichler EE. Am. J. Hum. Genet. 2003;73:823. doi: 10.1086/378594. [DOI] [PMC free article] [PubMed] [Google Scholar]
- 20.Linardopoulou EV, et al. Nature. 2005;437:94. doi: 10.1038/nature04029. [DOI] [PMC free article] [PubMed] [Google Scholar]
- 21.Mills RE, Bennett EA, Iskow RC, Devine SE. Trends Genet. 2007;23:183. doi: 10.1016/j.tig.2007.02.006. [DOI] [PubMed] [Google Scholar]
- 22.Belshaw R, et al. J. Virol. 2005;79:12507. doi: 10.1128/JVI.79.19.12507-12514.2005. [DOI] [PMC free article] [PubMed] [Google Scholar]
- 23.Bacolla A, Wells RD. J. Biol. Chem. 2004;279:47411. doi: 10.1074/jbc.R400028200. [DOI] [PubMed] [Google Scholar]
- 24.Khaja R, et al. Nat. Genet. 2006;38:1413. doi: 10.1038/ng1921. [DOI] [PMC free article] [PubMed] [Google Scholar]
Associated Data
This section collects any data citations, data availability statements, or supplementary materials included in this article.
Supplementary Materials
S_table1
Suppl.data