Golgi-derived CLASP-dependent Microtubules Control Golgi Organization and Polarized Trafficking in Motile Cells (original) (raw)
. Author manuscript; available in PMC: 2010 Mar 1.
Published in final edited form as: Nat Cell Biol. 2009 Aug 23;11(9):1069–1080. doi: 10.1038/ncb1920
Abstract
Microtubules are indispensable for Golgi complex assembly and maintenance that is an integral part of cytoplasm organization in interphase mammalian cells. Here, we show that two discrete microtubule subsets drive two distinct, yet simultaneous, stages of Golgi assembly. In addition to the radial centrosomal microtubule array, which positions the Golgi in the cell center, we identify a role for microtubules that form at the Golgi membranes in a manner dependent on microtubule regulators CLASPs. These Golgi-derived microtubules draw Golgi mini-stacks together in tangential fashion and are critical for establishing continuity and proper morphology of the Golgi complex.
We propose that specialized functions of these two microtubule arrays arise from their specific geometries. Further, we demonstrate that directional post-Golgi trafficking and cell migration depend on Golgi-associated CLASPs suggesting that correct organization of the Golgi complex by microtubules is essential for cell polarization and motility.
Introduction
The microtubule (MT) cytoskeleton is to a large extent responsible for dynamic architecture of the cytoplasm including global changes associated with cell cycle progression. In order to successfully adapt to dynamic conditions, cells often distribute the MT “work-load” to functional MTs subsets that are specific for interphase or mitosis [1–3]. MT subsets can be distinguished, for example, by their dynamic or motor binding properties. In particular, dynamic properties of mitotic MTs differ between kinetochore and astral MT subsets. Similarly, distinct front-oriented stable MT arrays establish polarity of motile interphase cells [4, 5]. Orientation and positioning of MTs within a cell, which are important for functional subset partition, to a large extent depend on the MT nucleation sites. For example, MTs originating at the centrosomes and kinetochores build a mitotic spindle in cooperative fashion due to their distinct geometry and growth directionality [6].
MT subsets of distinct origin exit also in motile interphase cells. In particular, we have recently discovered a novel MT subset that is nucleated at the Golgi apparatus [7]. In contrast to radial centrosomal MTs, Golgi-derived MTs form a wide array extending toward the cell edge. This array specifically depends on MT-stabilizing proteins CLASPs (CLIP-associated proteins), which coat Golgi-derived MTs and thus make them biochemically and dynamically dissimilar from the centrosomal array. Thus, the Golgi-derived MT subset is characterized by specific origin, orientation, and protein composition. Do distinct properties of Golgi-derived MTs confer specific functional abilities to this MT subset?
Interphase mammalian cells typically have an integrated, centrally located Golgi complex that serves as the major center for protein sorting. Upon mitotic exit, Golgi mini-stacks are formed by tightly regulated fusion of small Golgi membrane vesicles into cisternae that undergo subsequent stacking. Formation of mini-stacks is MT-independent and can be reconstituted in cell-free system [8] or in a MT-devoid cell at ER exits [9]. Next, these mini-stacks utilize evolving interphase MT network and the minus-end directed MT motor dynein [10–13] to form a continuous Golgi ribbon. However, it is not clear how correct organization of the Golgi ribbon is achieved by dynein transport. Given that CLASP-dependent MTs are closely associated with the Golgi membrane, their specific function may relate to the Golgi organization.
Here, we show that MTs growing from dispersed Golgi stacks exhibit a classical “search and capture” [14] scenario whereby mini-stacks cluster in the cell periphery. Furthermore, Golgi-derived and centrosomal MTs act in concert to organize individual Golgi stacks into a continuous ribbon structure that, in turn, supports the polarity of post-Golgi vesicular trafficking in migrating cells. Centrosomal MTs alone appear to be insufficient for proper Golgi ribbon formation though they actively support central Golgi positioning. Importantly, the distinction between centrosomal and Golgi-derived MT functions arises from their geometry and orientation within the cell. Our findings provide the first demonstration of the functional significance of Golgi-derived MTs and highlight the defining role of functionally distinct MT subpopulations in organization of cellular architecture.
Results
MTs assemble the Golgi ribbon in two stages
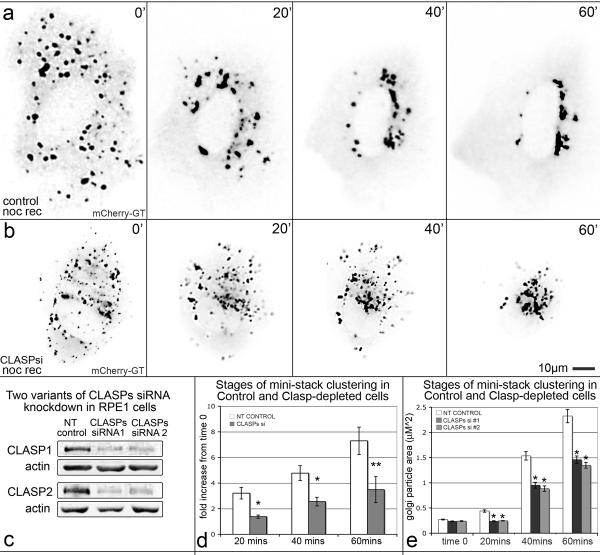
Individual Golgi mini-stack formation is MT-independent, while Golgi complex assembly requires MTs [11, 15]. To investigate in detail explicitly the MT-dependent assembly, we employed nocodazole washout assay. Full MT depolymerization in Human Retinal Pigment Epithelial (RPE1) cells by nocodazole treatment resulted in dispersal of Golgi mini-stacks (Fig. 1a,b). Live-cell imaging of Golgi re-assembly upon nocodazole washout (Fig. 1a; Movie 1) revealed that Golgi mini-stacks undergo initial clustering in the cell periphery (Fig. 1a). Quantitative analysis of both live imaging sequences and fixed immunostained samples revealed that Golgi particle size doubled at this time (Fig. 1d,e). Clusters then relocated to the cell center to complete Golgi ribbon assembly (Fig. 1a).
Figure 1. The two-stage process of Golgi assembly requires CLASPs.
(a–b) Video frames illustrating assembly of the Golgi marked by mCherry-tagged Galactosyltransferase (GT) in NT-control (a) and CLASP-depleted (siRNA combination #1, b) RPE1 cells recovering after nocodazole washout (noc rec). Time after nocodazole removal is shown. (c) Western blotting showing reduction of CLASP1 levels by ~75 % using siRNA combination #1 and by ~77 % using siRNA combination #2 and CLASP2 levels by ~88 % using siRNA combination #1 and by ~74 % using siRNA combination #2. Actin, loading control. (d) Golgi particle size upon nocodazole washout analysis based on live cell imaging experiments in NT-control (n=7, 6 independent experiments) and CLASP-depleted (n=7, 7 independent experiments) cells (as in a, b). Average fold size increase of Golgi particles relative to time 0 (nocodazole removal) is shown. Error bars, standard error. *P<0.01, **P<0.05, unpaired Student's t-test. (e) Average Golgi particle area (μm2) upon nocodazole washout based on GM130 immunolabeled fixed samples for of NT-control, CLASP siRNA combination #1, and CLASP siRNA combination #2 cells (as in Fig. S1). n=50 for each condition, 3 independent experiments. Error bars, standard error. *P<0.001, unpaired Student's t-test.
Thus, MTs assemble the Golgi by two distinct mechanisms: one that does not involve relocation toward the centrosome and another that occurs in vicinity of the centrosome. We refer to these processes as the “G-stage” (for Golgi) and the “C-stage” of the Golgi assembly (for centrosome), respectively.
CLASPs are required for initial Golgi clustering
We next addressed the roles of Golgi-derived versus centrosomal MTs in the two-stage process of Golgi assembly. Since CLASPs are essential for Golgi-associated MT nucleation, siRNA targeting of CLASPs (Fig. 1c) explicitly removes the Golgi-derived but not centrosomal MT subset [7]. Hence, we analyzed the process of Golgi assembly in CLASP-depleted cells (Fig 1b,d). Here and below, cells treated with two independent targeting sequences for CLASP1 and CLASP2 were compared to cells treated with non-targeting siRNA oligonucleotides (NT control). After nocodazole washout, Golgi mini-stacks did not form larger cytosolic clusters (G-stage) (Fig. 1b; Movie 1). Instead, unaltered mini-stacks relocated toward the cell center and gathered around the centrosome (C-stage), although they failed to form a well-organized Golgi ribbon (Fig. 1b).
Accordingly, Golgi particle size analysis based on both live imaging data and immunostainings revealed that Golgi particle area in CLASP-depleted cells remained constant by 20 minutes (Fig. 1e), and final average mini-stack area in CLASP-depleted cells was substantially lower than in control cells (Fig. 1d,e; Fig. S1). These observations indicate that CLASPs are essential for the G-stage of Golgi assembly, and that the C-stage alone is not sufficient for the proper Golgi ribbon assembly.
Two-stage Golgi assembly occurs upon mitotic exit
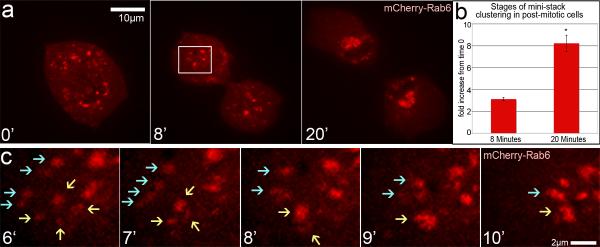
Next we visualized Golgi assembly in untreated cells after mitotic exit (Fig. 2; Movie 2). In mCherryRab6- or GFP-GM130-expressing cells exiting mitosis, the average size of detected Golgi mini-stacks (0.34±0.01μm) did not differ from the size of mini-stacks in nocodazole-treated cells (0.35±0.02μm), indicating that these mini-stacks were likely assembled in MT-independent manner by fusion and stacking of membranes brought together by simple diffusion [8]. During subsequent Golgi assembly, distinct G- and C- stages were easily distinguishable by analysis of the Golgi particle size increase (Fig. 2b). Mini-stack clustering in G-stage often occurred at the cell periphery away from the centrosome (Fig. 2c), suggestive of the role of Golgi-derived MTs that were detected at the periphery of cells exiting mitosis (Fig. S2). The Golgi assembled faster, and temporal separation between G- and C-stages was less distinct than in nocodazole washout assay. Possibly, the efforts of centrosomal and Golgi-derived MTs were better coordinated in a rounded mitotic cell than in a spread cell. Because CLASPs are indispensable for mitosis, we did not directly test their role in post-mitotic assembly; our nocodazole washout results, however, suggest that G-stage Golgi clustering in this scenario is likely CLASP-dependent.
Figure 2. Golgi assembly occurs in 2 stages upon mitotic exit.
(a) Video frames illustrating post-mitotic Golgi assembly in mCherry-Rab6 expressing RPE1 cells. Time zero marks approximate onset of telophase. Boxed area is enlarged below. (b) Post-mitotic Golgi particle size based on live imaging experiments in NT-control (n=4, 4 independent experiments) cells. Average fold increase of Golgi particles relative to time zero is shown. Error bars, standard error. *P<0.001, unpaired Student's t-test. (c) Enlarged box from (a) showing Golgi mini-stack (red) clustering (6–9', blue and yellow arrows indicate two separate clusters) prior to re-location toward the centrosome (10').
Cooperation of Golgi-derived and centrosomal MTs drive two stages of Golgi assembly
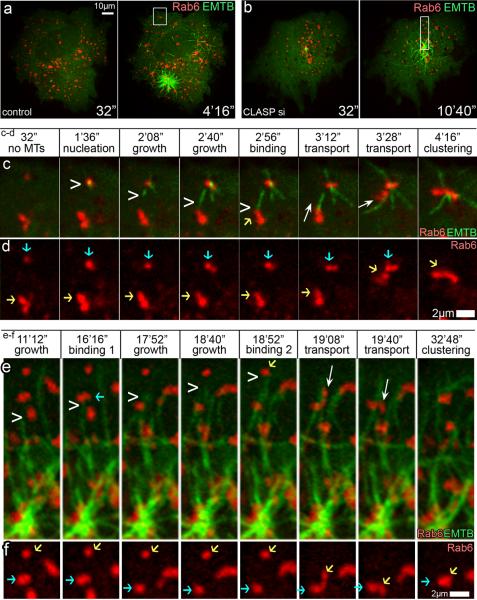
To determine whether CLASPs support Golgi mini-stack clustering at the cell periphery via Golgi-derived MT formation, we directly followed MT involvement in this process. RPE1 cells were co-transfected with variable Golgi stack markers and 3GFP-EMTB to label MTs [16]. As expected, nocodazole washout assay in NT-control cells revealed MT nucleation at individual Golgi mini-stacks as well as at the centrosome (Fig. 3a, c–d; Movie 3). To avoid overlap between G-stage and C-stage, we specifically followed G-stage clustering events at the cell periphery before centrosomal MTs extended into this area. As MTs formed at Golgi mini-stacks polymerized toward nearby mini-stacks, the latter ones were transported into close proximity of the former that allowed subsequent mini-stack linking. Transport of mini-stacks during the G-stage occurred in random directions, often tangential relative to radial centrosomal array.
Figure 3. Golgi mini-stacks clustering by Golgi-derived and centrosomal MTs.
(a–b) Video frames illustrating MT formation in 3GFP-EMTB (green) and mCherry-Rab6 (red) expressing RPE1 cells upon nocodazole washout. Time after nocodazole removal is shown. (a) Control cell, MTs at Golgi mini-stacks and the centrosome. (b) CLASP-depleted cell (siRNA combination #1), MTs at the centrosome. Areas in boxes are enlarged below. (c) enlarged box from (a) showing MT nucleation (chevron) at Golgi mini-stacks (red), binding of mini-stacks to MT (yellow arrow), and transport along MT (white arrow) resulting in clustering along Golgi-nucleated MT. mCherry-Rab6 (red), GFP-EB3 (green). Note transport of a mini stack toward cell periphery and subsequent tangential linking. (d) Mini-stack clustering from (c), mCherry-Rab6 alone. Blue arrow, mini-stack where MT nucleates. Yellow arrow, transported mini-stack. (e) Enlarged box from (b) showing centrosomal MTs growing (chevron), binding to 2 mini-stacks subsequently (blue and yellow arrows), and transport (white arrow) of the second mini-stack resulting in radial clustering in peri-centrosomal area. mCherry-Rab6 (red), GFP-EB3 (green). (f) Mini-stack clustering from (e), mCherry-Rab6 alone. Blue arrow, mini-stack proximal to the centrosome. Yellow arrow, transported mini-stack.
In contrast, CLASP-depleted cells failed to show MT nucleation at Golgi mini-stacks [7] while centrosomal MT nucleation remained functional (Fig. 3b). Early clustering of mini-stacks at the cell periphery was not detected. However, centrosomal MTs transported Golgi mini-stacks into close proximity of each other and supported their clustering in the central cell area (Fig. 3e–f; Movie 3). In these cells, mini-stack clustering occurred in a radial manner consistent with radial architecture of the centrosomal MT array. Thus, centrosomal MTs are responsible for the C-stage of Golgi assembly including gathering mini-stacks at the cell center and their limited linking along the radial axis.
MT orientation within arrays regulates Golgi organization
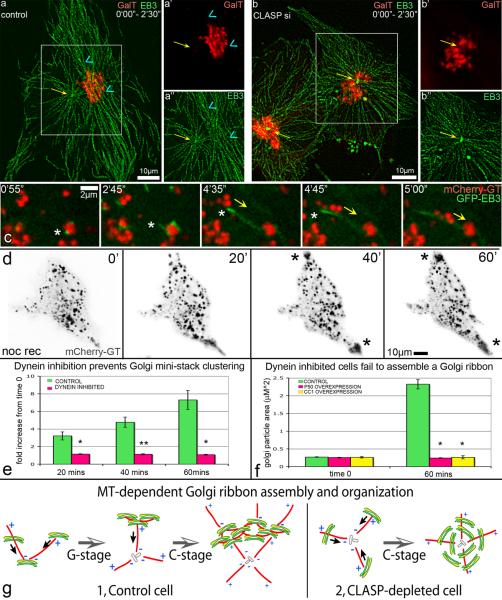
Because MT orientation appeared important for Golgi stack clustering in nocodazole washout assays, we further addressed the role of MT orientation in Golgi organization. MT directionality was detected as described in Efimov et al [7]. In brief, RPE1 cells were transfected with GFP-EB3 to mark MT plus-tips and mCherry-GT to label the Golgi, and time-lapse video sequences were recorded. Distinct centrosomal MT and Golgi-derived MT arrays were detected in NT-control cells (Fig. 4a,a”). Interestingly, while centrosomal MTs showed clear radial geometry, MTs formed at the Golgi were predominantly tangential. Golgi ribbons (Fig. 4a') were aligned along Golgi-derived MT tracks suggesting that they were primarily formed via tangential mini-stack linking and fusion (Fig. 4a).
Figure 4. Golgi assembly depends on directionality of two MT subsets and on dynein activity.
(a–b) Overlaid GFP-EB3 (green) and mCherry-GT (red) video frames within 2.5 min. (a) EB3 tracks in a control cell illustrate radial centrosomal (yellow arrow) and tangential Golgi-associated (blue arrowhead) MT arrays. Box is enlarged in (a') for mCherry-GT and in (a”) for GFP-EB3. (b) Radial centrosomal (yellow arrow) EB3 tracks in CLASP-depleted cell (siRNA combination #1). Box is enlarged in (b') for mCherry-GT and in (b”) for GFP-EB3. (c) Video frames illustrating minus-end directed mini-stack movement (yellow arrow) along Golgi-nucleated MTs upon nocodazole washout in mCherry-GT (red) and GFP-EB3 (green) expressing NT control cells. MT plus end, asterisk. Time after nocodazole removal is shown. (d) Video frames illustrating nocodazole washout in cell over-expressing GFP-P50 (not shown) and mCherry-GT (black). Mini-stacks move toward the cell periphery along forming MTs due to kinesin activity (asterisks). Time after nocodazole removal is shown. (e) Fold increase of Golgi particle size upon nocodazole washout based on live cell imaging of control (n=7, 6 independent experiments) and GFP-P50 over-expressing (n=8, 7 independent experiments) cells. Error bars, standard error. *P<0.001, unpaired Student's t-test. (f) Average Golgi particle area (μm2) in nocodazole (time 0) and upon 60 min washout in fixed samples of control, GFP-P50 over-expressing, and RFP-CC1 over-expressing cells. n=50 for each condition, 4 independent experiments. Error bars, standard error. *P<0.001, **P<0.01 unpaired Student's t-test. (g) Role of Golgi-associated MTs in Golgi ribbon assembly (model).
In contrast, CLASP-depleted cells contained only radial MT tracks emanating from the centrosome (Fig. 4b,b”), while the Golgi (Fig. 4b') formed a poorly organized assembly distributed around the centrosome. Apparently, a radial MT array does not allow for tangential linking and fusion of Golgi mini-stacks in these cells. These data indicate that CLASP-dependent Golgi-derived MTs are required for tangential Golgi stack linking within the Golgi ribbon.
Dynein is required for both G-stage and C-stage of Golgi assembly
Since dynein is required to maintain an organized Golgi complex [11], we addressed whether it is involved in G-stage and/or C-stages of Golgi assembly. Nocodazole washout assays in RPE1 cells co-expressing Golgi markers and GFP-EB3 revealed that mini-stacks during G-stage moved in a minus-end directed manner (Fig. 4c). To test whether this movement is driven by dynein, dynein activity was inhibited by either p50 dynamitin [17, 18] or the CC1 domain of p150Glued [19] over-expression (Fig. 4d,f). Golgi particle size was analyzed in live cell imaging sequences (Fig. 4e) and in fixed immunostained cells (Fig. 4f). Golgi particle size did not change throughout nocodazole washout indicating that neither G-stage nor C-stage of stack clustering occurs in the absence of dynein-dependent transport (Fig. 4d). At the same time, plus-end motors remained functional and MTs were available for trafficking as evident from the transport of Golgi mini-stacks toward the cell periphery (Fig. 4d).
CLASP-dependent MTs control Golgi-ribbon morphology
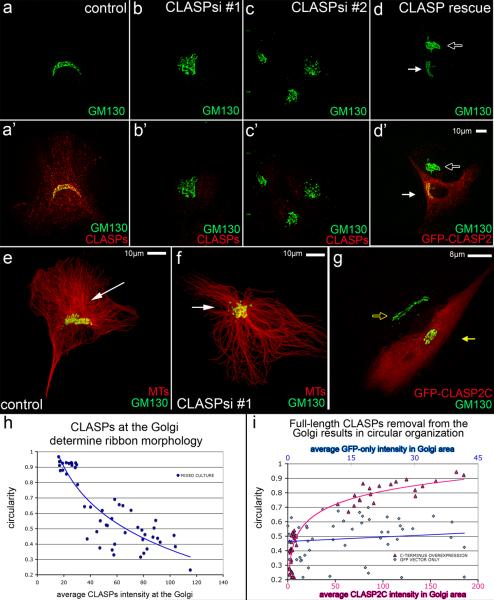
Our data support a model wherein Golgi-derived MTs play a distinct and essential role in Golgi organization (Fig. 4g). Indeed, while in NT-control cells a classic Golgi ribbon associated with Golgi-derived MT array was observed (Fig. 5a,e), in CLASP-depleted cells (Fig. 5b,c,f) MTs formed a radial array and the Golgi showed circular morphology (Fig. 5f). The Golgi shape was reverted back to a ribbon by expression of a non-silenceable GFP-CLASP2α rescue construct in CLASP-depleted cells (Fig. 5d). Dependence of the circular Golgi phenotype on the Golgi-associated CLASP fraction was confirmed by over-expressing GFP-tagged C-terminus of CLASP2 that competes full-length CLASPs off the Golgi (Fig. S3). Similar to CLASP-knockdown, cells over-expressing GFP-CLASP2C had circular Golgi complex (Fig. 5g).
Figure 5. CLASPs at the Golgi determine ribbon morphology.
(a) Control cells have a ribbon-like Golgi (GM130, green) when CLASPs (red, a') are present. (b–c) Golgi (green) morphology is circular when CLASPs (red, b', c') are depleted from cells. (d) Ribbon-like Golgi morphology (white arrow) is restored in CLASP-depleted cells expressing a nonsilenceable GFP-CLASP2C construct (d', false-colored red). The Golgi (GM-130, false-colored green) remains circular in non-expressing cells (hollow arrow). (e–f) Immunostainings of Golgi (GM130, green) and MTs (red). (e) Control cell showing ribbon-like Golgi in the presence of Golgi-associated MTs (white arrow). (f) CLASP-depleted cell (siRNA combination #2) showing circular Golgi morphology and radial centrosomal MT array (white arrow). (g) Ribbon-like Golgi (GM130, false-colored green, hollow yellow arrow) turns circular (yellow arrow) in cells over-expressing GFP-CLASP2C (false-colored red). (h) Golgi circularity depends on CLASPs intensity at the Golgi. Average CLASP intensity at the Golgi in mixed-culture cell plotted against circularity index (n=50, 4 independent experiments). (i) Removal of full-length CLASP results in circular morphology. Average GFP-CLASP2C intensity (pink, lower x-axis) and GFP vector only intensity (blue, top x-axis) in the Golgi area plotted against circularity index (n=50, 3 independent experiments for each condition). Cells with similar overall expression levels are compared, in which GFP-CLASP2c intensity in the Golgi region is 4 to 5 times higher than GFP due to specific accumulation of GFP-CLASP2C in the Golgi area (~1/5 of the cell area). GFP-CLASP2C but not GFP expression leads to circular Golgi morphology.
To quantify this phenomenon, Golgi circularity index was calculated in relation to CLASP intensity at the Golgi. In order to directly correlate CLASPs presence with observed phenotypes, cells transfected with CLASP siRNA and NT control siRNA were co-plated in a proportion of 1:1. In this mixed cell population, the Golgi outlines were identified by GM130 immunostaining. Golgi outline circularity indexes showed striking negative dependence on intensities of the immunostained CLASPs within this area (Fig. 5h). Accordingly, the Golgi circularity enhanced as full length CLASP2 was removed from the Golgi by GFP-CLASP2C expression (Fig. 5i) whereas GFP-only expression had no effect (Fig. S4). These results indicate that Golgi-localized CLASPs maintain polarized functional Golgi organization [20], probably through Golgi-derived MT nucleation.
CLASP-dependent MTs control Golgi ribbon continuity
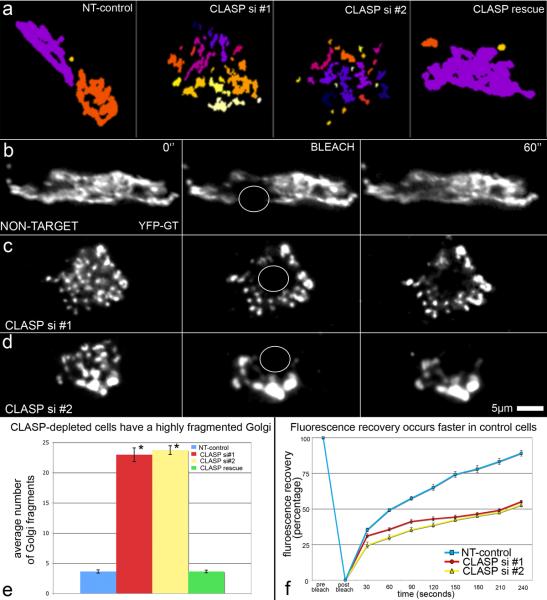
If without Golgi-derived MTs Golgi mini-stack linking is incomplete, membrane fusion required for functional Golgi complex continuity would likely be defective. We performed 3-dimensional Golgi fragmentation analysis on cells immunostained for TGN-46 (data not shown) and GM130 (Fig. S5). CLASP-knockdown cells contained significantly higher number of fragments as compared to NT-control (Fig. 6a,e). Rescue experiments returned Golgi fragment number back to control levels (Fig. 6a,e). Golgi continuity was further examined by FRAP (Fluorescence Recovery After Photobleaching) to assess GT flow within the Golgi network. As expected, fast recovery in control cells (Fig. 6b,f) was typical for a continuous Golgi ribbon where Golgi enzymes freely re-distributed throughout the structure [21–23]. Incomplete fluorescence recovery of CLASP-knockdown cells (Fig. 6c–d,f) indicated that Golgi enzyme mobility between stacks was significantly restricted.
Figure 6. Golgi fragmentation in CLASP-depleted cells results in diminished enzyme mobility within the Golgi complex.
(a) Representative data from 3-dimensional objects counter analysis based of GM130 immunostaining. Colored segments represent interconnected Golgi fragments. (b–d) Video frames illustrating fluorescence recovery after photobleaching in YFP-GT expressing cells. Time points shown are pre-bleach (0”), bleach, and 60 seconds post-bleach. Bleached regions are indicated by white circles. (b) NT-control. (c) CLASP depletion siRNA combination #1. (d) CLASP depletion siRNA combination #2. (e) Numbers of Golgi fragments in NT-ctl (blue), CLASPs-depletion #1 (red), CLASPs-depletion #2 (yellow), and CLASP rescue (green) cells. n=30, 5 independent experiments for each condition. Error bars, standard error. *P<0.001, unpaired Student's t-test. (f) Graph showing fluorescence recovery rates for NT-control (blue), CLASP siRNA combination #1 (red), and CLASP siRNA combination #2 (yellow). n=20 for each condition. NT-control = 4 independent experiments, CLASP si #1 and CLASP si #2 = 5 independent experiments.
Together, these data reveal that the Golgi is highly fragmented in CLASP-knockdown cells indicative of impaired membrane fusion, which is likely a result of missing tangential linking by Golgi-derived MTs.
Directional trafficking defects in cells lacking Golgi-derived MTs
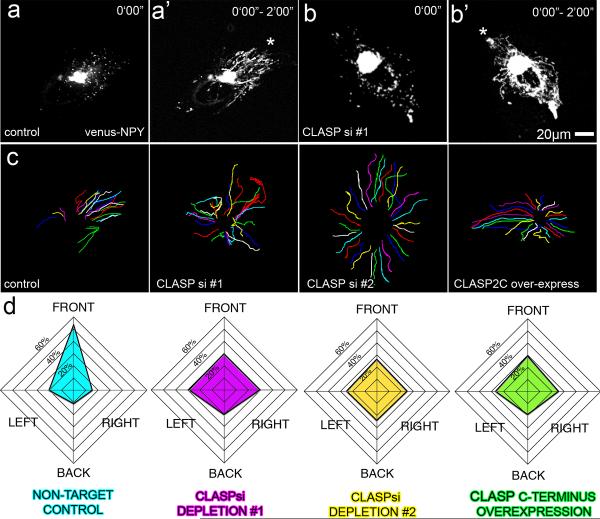
One logical function of a properly organized Golgi ribbon is support of directional post-Golgi trafficking. Because CLASP-dependent MTs organize the Golgi ribbon, we examined their role in the process of polarized post-Golgi trafficking by monitoring secreted fluorescently tagged Neuropeptide-Y (NPY) [24, 25]. Individual NPY-containing vesicles (Fig. 7a,b) were tracked from the Golgi to the plasma membrane, vesicle tracks were created (Fig. 7a',b') and their directionality was quantified in four cell quadrants (Fig. S6). While NT-control cells exhibited polarized trafficking toward the leading edge (Fig. 7a',c,d), cells after CLASP depletion (Fig. 7b',c, d) or removal from the Golgi by GFP-CLASP2C over-expression (Fig. 7c, d) exhibited randomized symmetric trafficking patterns. VSVG trafficking assays (data not shown) show no differences in overall trafficking to the plasma membrane upon CLASP knockdown indicating that directionality but not efficiency of post-Golgi trafficking depends on Golgi-associated MTs. At the same time, overall MT network also becomes symmetric upon CLASP depletion (Fig. S7), correlating with the fact that directional Golgi-originated MT array is missing in CLASP depleted cells [7] (Fig. 4b).
Figure 7. CLASP-dependent MTs polarize trafficking to the cell front.
(a–b) Video frames showing post-Golgi trafficking in Venus-NPY expressing RPE1 cells. (a) NT-control. (b) CLASP-depleted cell. (a, b) Snapshot of NPY vesicles (a', b'). Overlaid Venus-NPY images within 2 minutes show directional trafficking toward the cell front (asterisks) in control cells (a') and symmetric trafficking (b') in CLASP-depleted cells. (c) Examples of particle tracking analysis. Particle movement tracks within 2 mins for NT-control, CLASP siRNA combination #1, CLASP siRNA combination #2, and GFP-CLASP2C over-expressing cells. (d) Graphs showing trafficking directionality in NT-control (blue), CLASP siRNA combination #1 (purple), CLASP siRNA combination #2 (yellow), and GFP-CLASP2C over-expressing (green) cells. Data represents average percentage of tracks corresponding to the cell front, right, rear, and left. n=30 for each condition, NT-control = 4 independent experiments, CLASP si #1 and CLASP si #2 = 6 independent experiments, CLASP C-term = 3 independent experiments.
Migration defects in cells lacking Golgi-derived MTs
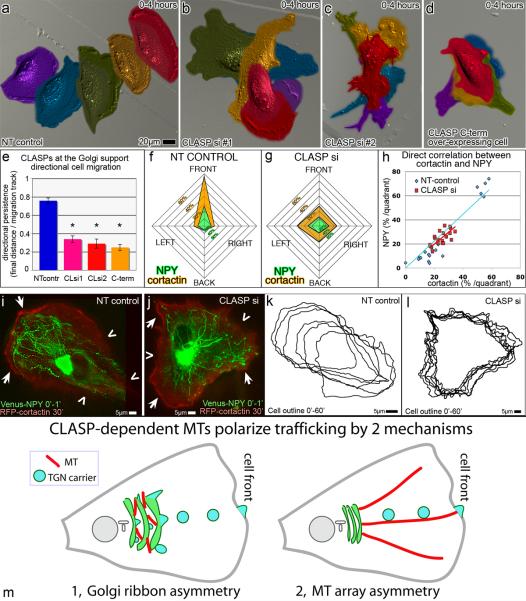
Golgi ribbon integrity [26] and asymmetry of post-Golgi transport [27] are thought to play an important role in polarized cell motility along with other potential functions of front-oriented MT arrays [28, 29]. To test for potential migration defects, single NT-control, CLASP-depleted, and GFP-CLASP2C over-expressing cells were monitored by DIC microscopy. CLASP-depleted cells were analyzed only if post-recording immunostaining confirmed non-detectable CLASP levels. NT-control cells migrated in directionally persistent fashion (Fig 8a,e; Movie 4). CLASP-depleted (Fig. 8b–d; Movie 4) cells exhibited random migration, consistent with previous findings [30]. Similar random migration of GFP-CLASP2C over-expressing cells (Fig. 8d,e) suggested that specifically Golgi-associated CLASPs were involved in migratory persistence.
Figure 8. CLASP-dependent MTs regulate directional cell migration.
(a–d) False-colored DIC video frames showing single RPE1 cell migration over a time period of 4 hours. Purple indicates time 0, blue = 1hr, green = 2hrs, yellow =3hrs, and red =4hrs. (a) Control cells exhibit directionally persistent migration. CLASP-depleted cells (b–c) and CLASP2C (d) over-expressing cells show random migration patterns. (e) Average directional persistence for NT-control (n=13, blue), CLASP siRNA combination #1 (n=12, pink) and #2 (n=17, red), and CLASP2C over-expressing (n=15, orange) cells each from 4 independent experiments. Error bars, standard error. *P<0.001, unpaired Student's t-test. (f–g) NPY trafficking (green) directionality and cortactin cell edge distribution (orange) in migrating NT-control (f) and CLASP-depleted (g) cells. Data represent average percentage per quadrant (Fig. S6) of track number within 1 min and cortactin-associated cell edge length over 30 min thereafter. n=5 from 4 independent experiments for each condition. (h) Direct correlation between NPY track number and cortactin-rich cell edge in NT-control (blue) and CLASP-depleted (red) cells. Each point represents correlation within one quadrant of an individual cell. (i–j) NPY tracks within 1 minute (green) overlaid with RFP-cortactin (red (see “Image processing”)) at 30 minutes after track recording in NT-control (i) and CLASP-depleted (j) cells. Arrows, cortactin enrichment. Chevrons, regions lacking cortactin. (k–l) Cell outlines showing cell relocation and edge dynamics over 1 hour with 10 minute interval. (k) NT-control, same as (i). (l) CLASP-depleted cell, same as (j). (m) Proposed mechanisms by which CLASP-dependent MTs polarize trafficking (model).
Thus, random migration pattern was observed under the same conditions as the random trafficking (Fig. 7). In order to observe the trafficking pattern and cell edge protrusions in the same cell, we co-expressed NPY as a trafficking marker and RFP-cortactin [31] as a marker of protrusion activity (Fig. 8i,j). Cell migration and cortactin distribution were followed within 1 hour of migration (Fig. 8k,l). One minute NPY tracks were recorded at the beginning and at the end of the cortactin recording. NPY track distribution was compared to the relative length of cortactin-rich cell edge within the same quadrants (Fig. S6) throughout the recording. Persistence of cortactin accumulation over time at one cell side directly correlated with the load of vesicular trafficking to that side (Fig. 8f–h) in both NT control and CLASP-depleted cells, suggesting that vesicular trafficking is likely involved in protrusion site stabilization and may serve a mechanism whereby Golgi-associated CLASPs supports directionally persistent migration.
Discussion
The major MT function is spatial organization of the cytoplasm at particular time points. MT network properties, including specific nucleation sites, orientation, dynamics and molecular motor affinity establish a fine-tunable machine for organelle positioning. The best-studied MT-driven positioning machine is the mitotic spindle. Chromosome location by a “search and capture” mechanism [14] involves variability of all above-listed parameters. Assembly of the Golgi complex described herein is driven by a similar arrangement though this machinery is not understood as clearly as mitosis. Yet, Golgi assembly by G- and C-stage mechanisms provides a strong analogy to modern understanding of the mitotic spindle, which is cooperatively built by centrosomal and kinetochore-derived MTs [6]. In both cases, correct organelle positioning is achieved by cooperation of two MT subsets bearing their own functions due to distinct sites of origin.
Upon nocodazole washout, Golgi undergoes two distinct, yet simultaneous, rearrangements. In G-stage, Golgi-derived MTs organize peripheral Golgi mini-stacks into larger clusters similar to melanosomes in pigment cells [32]. Simultaneously, the C-stage drives relocalizing stacks toward the cell center thought it appeared insufficient for correct Golgi assembly. Why is the unconventional, Golgi-based, nucleation mechanism so important for the Golgi assembly by MTs?
This question can be addressed from a purely geometric as well as from a biochemical point of view. One of the reasons for efficient mini-stack gathering by Golgi-derived MTs could be that the their anchoring sites are distributed evenly throughout the cytosol producing fusion templates of variable orientations. This geometry helps to overcome limitations of diffusion-based mini-stack association and leads to a rapid increase in Golgi particle size. As a result, the probability that centrosomal MTs will easily find and transport mini-stacks toward the cell center is significantly enhanced. This phenomenon likely enhances Golgi assembly rate and may be important for efficient cell cycle progression upon mitotic exit. In the assembled Golgi complex, tangential Golgi-derived MTs likely serve for lateral cross-linking of mini-stacks. Such cross-linking is essential for cisternal fusion and functional continuity of the Golgi complex as evident from Golgi fragmentation and low enzyme mobility in CLASP-depleted cells (Fig. 6).
Besides geometric clues, it is possible that Golgi-derived MTs possess distinct biochemical properties, such as altered balance between plus-end directed and minus-end-directed motor affinity or regulation of proteins involved in membrane fusion. It is known that Golgi membrane fusion requires highly regulated molecular machinery [33, 34]. While our study does not address the biochemistry of fusion, it emphasizes that MT-driven mutual localization of membranes [12] is critical for this machinery to work. Multiple structural biology studies have proven the importance of proper mutual positioning of two entities for a chemically correct interaction to occur. Such correct positioning is as important on the level of organelles as on the level of single molecules and their domains. Golgi mini-stacks in the absence of MTs fragment throughout the cytosol though their membranes carry all molecules required for efficient fusion. Therefore, Golgi mini-stacks need to be brought into close proximity for fusion machinery to proceed. Practically, MTs can be compared to surface catalysts, which hold membranes together. Since the membrane fusion machinery is compartment-specific [35, 36], MTs may promote connection of homotypic cisternae (e.g. cis with cis, or trans with trans). To date, Golgi-derived MTs were suggested to bind either _cis_-Golgi through AKAP450 [37] or the TGN (_trans_-Golgi Network) through CLASPs [7]. The latter possibility is supported by the recent finding that a CLASP-binding TGN protein (GCC185) is involved in lateral mini-stack cross-linking [38]. Nevertheless, whether Golgi-derived MTs catalyze homotypic fusion remains to be investigated.
Altogether, we propose that a properly organized Golgi ribbon arises from a concerted effort of G-stage tangential cross-linking and C-stage radial gathering of stacks (Fig. 4g). According to this model, the distinct geometry of Golgi-derived and centrosomal MTs underlies requirement of both MT subpopulations for Golgi ribbon organization.
Another important function of Golgi-derived MTs is support of directional trafficking in motile cells, which may be utilized by two mechanisms (Fig. 8m). First, MT-dependent Golgi morphology may contribute to trafficking directionality if post-Golgi carriers predominantly bud off one side of the polarized Golgi. Second, vesicular transport may be polarized due to direction bias of these MTs toward the cell front [7]. Either way, the observed correlation between the CLASP effects on trafficking and protrusion stability (Fig. 7) suggests that trafficking contributes to CLASP-dependent regulation of migration. Importance of polarized Golgi organization for directional cell motility has been recently supported by data arising from the Golgi ribbon disruption by a number of alternative protein depletions [26]. Additionally, CLASPs function in MT capture at cortical sites [39] may be involved in regulation of migration. Notably, our results involving removal of CLASPs from the membrane (that may involve both Golgi and cortical site association [39]) indicate that CLASP functioning at the membrane and not CLASP MT-binding is important for directional migration. It is yet unclear how CLASP activities at the Golgi and at cortical sites are coordinated. One possibility is that Golgi-derived MTs that possess high CLASP affinity as they form [7] represent the same population of microtubules that are later associated with CLASP at the cell periphery [40] and anchored at the cortical sites [39]. Thus, we propose that Golgi-derived MTs facilitate directional persistence of cell migration, on one hand, through Golgi-ribbon organization and polarized trafficking, and, on the other hand, by establishment of a directional array of CLASP-rich MTs extending toward the cell front.
Methods
Cells
Immortalized human retinal pigment epithelial cells hTert-RPE1 (Clontech) were maintained in DMEM/F12 with 10% fetal bovine serum (FBS). GFP-tubulin expressing LLC-PK1 stable line (renal epithelial cell line derived from porcine kidney, gift of P. Wadsworth, Amherst, MA) were cultured in a mixture of Opti-MEM and F10 (1:1) supplemented with 10% of fetal bovine serum. Cells were grown in 5% CO2 at 37°C. Cells were plated on fibronectin-coated glass coverslips 24 hours before experiments.
Treatments
For MT depolymerization and Golgi dispersal, nocodazole (2.5μg/ml) was added to culture media for 2 hours. For Golgi reassembly experiments, cells were rinsed five times with ice-cold medium to remove nocodazole and then moved to a dish with warm (37°C) medium (time 0 for Golgi reassembly). For live imaging of Golgi reassembly, cells were washed with cold medium directly at the microscope stage after initial recording of cells in nocodazole. Temperature was slowly raised to 37°C by the heated stage. For dynein inhibition cells were transfected with 1.5μg of GFP-p50 or RFP-RCC1 (gift from T.A. Schroer, Baltimore, MD).
siRNA and Expression Constructs
Two alternative combinations of mixed siRNA oligos against CLASP1 and CLASP2 [41] were transfected using HiPerFect (Qiagen) according to the manufacturer's protocol. Combination 1: CLASP1 siRNA targeted sequence 5'-GGATGATTTACAAGACTGG-3'; CLASP2 siRNA targeted sequence 5'-GACATACATGGGTCTTAGA-3'. Combination 2: CLASP1 siRNA targeted sequence 5'-GCCATTATGCCAACTATCT-3'; CLASP2 siRNA targeted sequence 5'-GTTCAGAAAGCCCTTGATG-3'. Experiments were conducted 72 hours post-transfection as at this time minimal protein levels were detected. Nontargeting siRNA (Dharmacon) was used for controls. Empty pEGFP-C1 vector (Clontech) served as a control for circularity quantifications. mCherry plasmid was provided by Dr. R. Tsien (San Diego, CA). YFP-GT (YFPGalactosyltransferase; Clontech), mCherry-GT (modified from Clontech), GFP-GM130 (gift from C. Sütterling, Irving, CA), and Cherry-Rab6 (gift from A. Akhmanova, Rotterdam, The Netherlands) were used for Golgi visualization. EGFP-EB3 (gift from A. Akhmanova, Rotterdam, The Netherlands), mCherry-EB3 (gift from J.V. Small, Vienna, Austria), 3xGFP-EMTB (gift from J.C. Bulinski, New York, NY) were used for MT plus tip and MT visualization. GFP-CLASP1α, GFP-CLASP2α, RFP-CLASP2, GFP-CLASP2-C, and the nonsilenceable rescue construct GFP-CLASP2α are described in Mimori-Kiyosue et al (2005). GFP-Centrin (gift from M. Bornens, Paris, France) was used to mark the centrosome. RFP- and Venus-NPY constructs were provided by Atsushi Miyawaki (Saitama, Japan). Cell polarity marker RFP-cortactin was provided by Marko Kaksonen, UC Berkeley. RPE1 cells were transfected with Fugene6 (Roche), and LLC-PK1 cells with Effectene (Qiagen) according to manufacturer's protocols.
Antibodies and Immunofluorescence Details
Rabbit polyclonal antibodies against CLASP2 VU-83 are described in Efimov et al. [7]. Rabbit polyclonal antibodies against CLASP1 were provided by Dr. F. Severin (Dresden). A mouse polyclonal antibody against Actin (NeoMarkers) was used. For Golgi compartment identification, a mouse monoclonal antibody against GM130 (Transduction Laboratories) and a sheep polyclonal antibody against TGN46 (Serotec) were used. MTs were stained with a rat monoclonal YL1/2 antibody (Abcam). Cells were fixed in cold methanol (10' at −20°C) for CLASPs stainings. For MT staining and Golgi reconstruction cells were fixed (15' at room temp.) in 2% paraformaldehyde, 0.1% Glutaraldehyde, 0.5% Saponin in cytoskeleton buffer (10 mM MES, 150 mM NaCL, 5 mM EGTA, 5 mM glucose, and 5 mM MgCL2, pH 6.1). Alexa488 and Alexa568-conjugated highly cross-absorbed goat anti-mouse IgG antibodies, Alexa568-conjugated goat anti-rat IgG antibodies, and Alexa568 donkey anti-sheep IgG (Molecular Probes) were used as secondary antibodies.
Fluorescence Recovery after Photobleaching
RPE1 cells treated with non-targeting or CLASPs siRNA were transfected with YFP-GT or mCherry-GT and photobleached for 7 seconds with a 10mW DPSS laser 85YCA010 (Melles Griot) by focusing the laser light on the selected Golgi area with a custom-made lens (Nikon) placed in position of the filter cube. Single-channel movies were recorded using wide-field microscopy for 5 minutes (3 seconds/frame) after bleaching.
Quantitative Analysis
Golgi assembly
Images from time points (nocodazole washout: 0, 20, 40, and 60 minutes; mitotic exit: 0, 8, and 20 minutes) were obtained from time-lapse movies of cells expressing either YFP-GT, mCherry-GT, or mCherry-Rab6 to label the Golgi. Images were processed by background subtraction and standardized entropy thresholding, then particle area was quantified using ImageJ analyze particles function.
MT plus end and NPY vesicle tracking analyses
For plus end and vesicle tracking, time-lapse recordings of RPE1 cells expressing fluorescently labeled MT tip marker EB3 (5 sec/frame) or NPY (Venus or RFP) to mark post-Golgi carriers (1 sec/frame) were processed by rolling-ball background correction. Then, a custom script in IPLab software created tracks by rolling average sequences over 4 frames to precisely follow MT tips and vesicles. The manual tracking plugin of ImageJ software was used to follow tracks.
Circularity
To apply circularity measurements to the Golgi, a freehand selection option in ImageJ software was used to outline the Golgi based on GM130 staining. Circularity index values were assigned to Golgi outlines by ImageJ circularity plugin (http://rsb.info.nih.gov/ij/plugins/circularity.html) where Circularity = 4pi(area/perimeter^2). A circularity value of 1 corresponds to a perfect circle. Circularity index was previously used by Patel et al. [42] to analyze overall cell shape and by Thomas and Wieschaus [43] to measure microfilament ring circularity during cellularization.
3D Golgi analysis
Confocal z-slices (0.2μm) were analyzed for 3D continuity by ImageJ 3D objects counter plugin and ImageJ Volume Viewer plugin was used for 3D Golgi reconstruction.
Fluorescence recovery after photobleaching
Fluorescence intensity in bleached and non-bleached regions of the Golgi was measured using ImageJ software. Bleached areas were normalized to non-bleached areas both pre- and post-bleach in order to obtain fluorescence recovery values. Data represents percentage of fluorescence recovery in the bleached region.
NPY quantification
Cells were divided into four quadrants (Fig. S6). A line was drawn down the cell connecting the center of the Golgi and the center of the nucleus. This line was then rotated both +/− 45° in order to create four 90° quadrants corresponding to the cell front (containing the Golgi), right, left, and rear. Tracking of post-Golgi cargos were assigned to each of these categories based upon which quadrant the track fused with the plasma membrane at the cell periphery.
Directional persistence of cell migration
Cell migration tracks were quantified by “Manual tracking” plugin of ImageJ using nuclei positions in DIC recordings of migrating single cells as reference points. Directional persistence was quantified as final distance of cell relocation divided by total migration track.
Cortactin quantification
Cells were divided into quadrants (Fig. S6). Cell outlines were generated by tracing around the entire cell to obtain a total perimeter measurement. A line was drawn to highlight cortactin rich regions of cell border and the total length of this line was quantified as a percentage of the total cell perimeter and assigned to the appropriate cell quadrant (same as for NPY quantification). Images from selected time points (0, 15, and 30 minutes) were calculated for each cell and combined to obtain a total average cortactin percentage per cell quadrant for each cell.
Image Acquisition and Processing
Fig. 1a–b: Wide-field fluorescent video frames, 15 seconds between frames, 200ms exposure, inverted images. Fig. 2a, c: Maximum intensity projection of time-lapse confocal slices (10, 1 micron slices), 1 minute between frames, 100ms exposure time. Fig. 3a–f: Maximum intensity projection of time-lapse confocal slices (10, 0.20 micron slices), 16 seconds between frames, 200ms exposure time for red and green channels. Fig. 4a–c: Wide-field fluorescent video frames, 5 seconds between frames, 200ms exposure time red and green channels (a–c); 15 seconds between frames, 200ms exposure time (d) inverted image. Fig. 5: Maximum intensity projection of confocal stacks (10, 0.20 micron spacing (a–d); 20, 0.20 micron spacing (e–f); 10, 0.20 micron spacing (g)). Fig. 6b–d: Wide-field fluorescent video frames, 3 seconds between frames, 200ms exposure (b), 300ms exposure time (c–d). Fig. 7a–b: Wide-field fluorescent video frames, 1 second between frames, 40 ms exposure time. Fig. 8: False-colored DIC video frames (a–d), 1 minute between frames, 100ms exposure time; wide-field fluorescent video frames (i–j), 5 minutes between frames (cortactin), 200ms exposure time; 1 second between frames (NPY), 300ms exposure time. For images depicting cortactin (Fig. 8i–j) the image intensity in the cell center was artificially decreased for clarity with overlaid NPY tracks. This modification did not affect cell periphery intensity within 5μm from the cell edge (region of interest). The cell cortex, which is the area of interest used for quantification purposes, was not artificially altered. Fig. S1: Wide-field fluorescent images inverted. Fig. S2: Maximum intensity projection of time-lapse confocal slices (10, 1 micron slices), 1 minute between frames, 200ms exposure (red), 100ms exposure time (green). Fig. S3: False-colored snapshots of 3-Dimensional reconstructions from confocal z-sections (control= 8 slices, CLASP si= 15 slices, CLASP rescue= 8 slices; all 0.20 micron slices). Fig. S6: Wide-field fluorescent image. Fig. S7a,c: Maximum intensity projection of confocal stacks (16, 0.20 micron slices). Brightness and contrast were adjusted individually for each fluorescent channel. For images showing Golgi particles and MTs, gamma settings were adjusted to make small structures visible. Images showing MT tip and NPY tracks are shown as maximum intensity projections for background-subtracted time-lapse stacks (Figs. 4a–b, 7a–b, 8i–j).
Quantifying MT asymmetry
Central cell area (30% total area centered at the cell centroid) is excluded from analysis because the brightness of central MTs often overrides otherwise significant differences in the rest of the cell and interferes with MT distribution analysis. Each cell was divided into radial quadrants and the average intensity (I) in each quadrant was quantified. This parameter correlates with the number of MTs in each quadrant. Degree of asymmetry is quantified as the ratio of the highest to lowest intensity.
Statistical Analysis
Statistical significance was determined by Student's t-test (two-tailed unpaired). P-values < 0.05 are shown.
Supplementary Material
1
2
Acknowledgments
We thank Drs James Goldenring, Mathew Tyska, and Ryoma Ohi for helpful discussions and Drs Anna Akhmanova, Laura A. Lee and Steven K. Hanks for critical reading of the manuscript. This study was funded by NIH NIGMS grant 1R01GM078373-01 to I.K. and a pilot project to I.K. from NIH NCI GI SPORE grant P50CA095103.
A.R.R.M. was supported by Fundação para a Ciência e Tecnologia fellowship SFRH/BD/32976/2006 and by grant PTDC/SAU-OBD/66113/2006 from Fundacao para a Ciencia e a Tecnologia of Portugal.
References
- 1.Walczak CE, Heald R. Mechanisms of mitotic spindle assembly and function. Int Rev Cytol. 2008;265:111–58. doi: 10.1016/S0074-7696(07)65003-7. [DOI] [PubMed] [Google Scholar]
- 2.Karsenti E, et al. Interconversion of metaphase and interphase microtubule arrays, as studied by the injection of centrosomes and nuclei into Xenopus eggs. J Cell Biol. 1984;98(5):1730–45. doi: 10.1083/jcb.98.5.1730. [DOI] [PMC free article] [PubMed] [Google Scholar]
- 3.Zhai Y, et al. Microtubule dynamics at the G2/M transition: abrupt breakdown of cytoplasmic microtubules at nuclear envelope breakdown and implications for spindle morphogenesis. J Cell Biol. 1996;135(1):201–14. doi: 10.1083/jcb.135.1.201. [DOI] [PMC free article] [PubMed] [Google Scholar]
- 4.Bulinski JC, Richards JE, Piperno G. Posttranslational modifications of alpha tubulin: detyrosination and acetylation differentiate populations of interphase microtubules in cultured cells. J Cell Biol. 1988;106(4):1213–20. doi: 10.1083/jcb.106.4.1213. [DOI] [PMC free article] [PubMed] [Google Scholar]
- 5.Gundersen GG, Gomes ER, Wen Y. Cortical control of microtubule stability and polarization. Curr Opin Cell Biol. 2004;16(1):106–12. doi: 10.1016/j.ceb.2003.11.010. [DOI] [PubMed] [Google Scholar]
- 6.O'Connell CB, Khodjakov AL. Cooperative mechanisms of mitotic spindle formation. J Cell Sci. 2007;120(Pt 10):1717–22. doi: 10.1242/jcs.03442. [DOI] [PubMed] [Google Scholar]
- 7.Efimov A, et al. Asymmetric CLASP-dependent nucleation of noncentrosomal microtubules at the trans-Golgi network. Dev Cell. 2007;12(6):917–30. doi: 10.1016/j.devcel.2007.04.002. [DOI] [PMC free article] [PubMed] [Google Scholar]
- 8.Tang D, et al. Molecular mechanism of mitotic Golgi disassembly and reassembly revealed by a defined reconstitution assay. J Biol Chem. 2008;283(10):6085–94. doi: 10.1074/jbc.M707715200. [DOI] [PMC free article] [PubMed] [Google Scholar]
- 9.Cole NB, et al. Golgi dispersal during microtubule disruption: regeneration of Golgi stacks at peripheral endoplasmic reticulum exit sites. Mol Biol Cell. 1996;7(4):631–50. doi: 10.1091/mbc.7.4.631. [DOI] [PMC free article] [PubMed] [Google Scholar]
- 10.Allan VJ, Thompson HM, McNiven MA. Motoring around the Golgi. Nat Cell Biol. 2002;4(10):E236–42. doi: 10.1038/ncb1002-e236. [DOI] [PubMed] [Google Scholar]
- 11.Burkhardt JK. The role of microtubule-based motor proteins in maintaining the structure and function of the Golgi complex. Biochim Biophys Acta. 1998;1404(1–2):113–26. doi: 10.1016/s0167-4889(98)00052-4. [DOI] [PubMed] [Google Scholar]
- 12.Thyberg J, Moskalewski S. Role of microtubules in the organization of the Golgi complex. Exp Cell Res. 1999;246(2):263–79. doi: 10.1006/excr.1998.4326. [DOI] [PubMed] [Google Scholar]
- 13.Bornens M. Organelle positioning and cell polarity. Nat Rev Mol Cell Biol. 2008;9(11):874–86. doi: 10.1038/nrm2524. [DOI] [PubMed] [Google Scholar]
- 14.Kirschner M, Mitchison T. Beyond self-assembly: from microtubules to morphogenesis. Cell. 1986;45(3):329–42. doi: 10.1016/0092-8674(86)90318-1. [DOI] [PubMed] [Google Scholar]
- 15.Storrie B, Yang W. Dynamics of the interphase mammalian Golgi complex as revealed through drugs producing reversible Golgi disassembly. Biochim Biophys Acta. 1998;1404(1–2):127–37. doi: 10.1016/s0167-4889(98)00053-6. [DOI] [PubMed] [Google Scholar]
- 16.Faire K, et al. E-MAP-115 (ensconsin) associates dynamically with microtubules in vivo and is not a physiological modulator of microtubule dynamics. J Cell Sci. 1999;112(Pt 23):4243–55. doi: 10.1242/jcs.112.23.4243. [DOI] [PubMed] [Google Scholar]
- 17.Burkhardt JK, et al. Overexpression of the dynamitin (p50) subunit of the dynactin complex disrupts dynein-dependent maintenance of membrane organelle distribution. J Cell Biol. 1997;139(2):469–84. doi: 10.1083/jcb.139.2.469. [DOI] [PMC free article] [PubMed] [Google Scholar]
- 18.Roghi C, Allan VJ. Dynamic association of cytoplasmic dynein heavy chain 1a with the Golgi apparatus and intermediate compartment. J Cell Sci. 1999;112(Pt 24):4673–85. doi: 10.1242/jcs.112.24.4673. [DOI] [PubMed] [Google Scholar]
- 19.Quintyne NJ, Schroer TA. Distinct cell cycle-dependent roles for dynactin and dynein at centrosomes. J Cell Biol. 2002;159(2):245–54. doi: 10.1083/jcb.200203089. [DOI] [PMC free article] [PubMed] [Google Scholar]
- 20.Mellman I, Simons K. The Golgi complex: in vitro veritas? Cell. 1992;68(5):829–40. doi: 10.1016/0092-8674(92)90027-A. [DOI] [PMC free article] [PubMed] [Google Scholar]
- 21.Puthenveedu MA, et al. GM130 and GRASP65-dependent lateral cisternal fusion allows uniform Golgi-enzyme distribution. Nat Cell Biol. 2006;8(3):238–48. doi: 10.1038/ncb1366. [DOI] [PubMed] [Google Scholar]
- 22.Feinstein TN, Linstedt AD. GRASP55 regulates Golgi ribbon formation. Mol Biol Cell. 2008;19(7):2696–707. doi: 10.1091/mbc.E07-11-1200. [DOI] [PMC free article] [PubMed] [Google Scholar]
- 23.Lippincott-Schwartz J, Cole N, Presley J. Unravelling Golgi membrane traffic with green fluorescent protein chimeras. Trends Cell Biol. 1998;8(1):16–20. doi: 10.1016/s0962-8924(97)01199-9. [DOI] [PubMed] [Google Scholar]
- 24.Taraska JW, et al. Secretory granules are recaptured largely intact after stimulated exocytosis in cultured endocrine cells. Proc Natl Acad Sci U S A. 2003;100(4):2070–5. doi: 10.1073/pnas.0337526100. [DOI] [PMC free article] [PubMed] [Google Scholar]
- 25.Bruun A, Tornqvist K, Ehinger B. Neuropeptide Y (NPY) immunoreactive neurons in the retina of different species. Histochemistry. 1986;86(2):135–40. doi: 10.1007/BF00493378. [DOI] [PubMed] [Google Scholar]
- 26.Yadav S, Puri S, Linstedt AD. A primary role for Golgi positioning in directed secretion, cell polarity, and wound healing. Mol Biol Cell. 2009;20(6):1728–36. doi: 10.1091/mbc.E08-10-1077. [DOI] [PMC free article] [PubMed] [Google Scholar]
- 27.Prigozhina NL, Waterman-Storer CM. Protein kinase D-mediated anterograde membrane trafficking is required for fibroblast motility. Curr Biol. 2004;14(2):88–98. doi: 10.1016/j.cub.2004.01.003. [DOI] [PubMed] [Google Scholar]
- 28.Small JV, Kaverina I. Microtubules meet substrate adhesions to arrange cell polarity. Curr Opin Cell Biol. 2003;15(1):40–7. doi: 10.1016/s0955-0674(02)00008-x. [DOI] [PubMed] [Google Scholar]
- 29.Noritake J, et al. IQGAP1: a key regulator of adhesion and migration. J Cell Sci. 2005;118(Pt 10):2085–92. doi: 10.1242/jcs.02379. [DOI] [PubMed] [Google Scholar]
- 30.Drabek K, et al. Role of CLASP2 in microtubule stabilization and the regulation of persistent motility. Curr Biol. 2006;16(22):2259–64. doi: 10.1016/j.cub.2006.09.065. [DOI] [PubMed] [Google Scholar]
- 31.Daly RJ. Cortactin signalling and dynamic actin networks. Biochem J. 2004;382(Pt 1):13–25. doi: 10.1042/BJ20040737. [DOI] [PMC free article] [PubMed] [Google Scholar]
- 32.Cytrynbaum EN, Rodionov V, Mogilner A. Computational model of dynein-dependent self-organization of microtubule asters. J Cell Sci. 2004;117(Pt 8):1381–97. doi: 10.1242/jcs.00919. [DOI] [PubMed] [Google Scholar]
- 33.Linstedt AD. Positioning the Golgi apparatus. Cell. 2004;118(3):271–2. doi: 10.1016/j.cell.2004.07.015. [DOI] [PubMed] [Google Scholar]
- 34.Rios RM, et al. GMAP-210 recruits gamma-tubulin complexes to cis-Golgi membranes and is required for Golgi ribbon formation. Cell. 2004;118(3):323–35. doi: 10.1016/j.cell.2004.07.012. [DOI] [PubMed] [Google Scholar]
- 35.Shorter J, Warren G. Golgi architecture and inheritance. Annu Rev Cell Dev Biol. 2002;18:379–420. doi: 10.1146/annurev.cellbio.18.030602.133733. [DOI] [PubMed] [Google Scholar]
- 36.Puthenveedu MA, Linstedt AD. Subcompartmentalizing the Golgi apparatus. Curr Opin Cell Biol. 2005;17(4):369–75. doi: 10.1016/j.ceb.2005.06.006. [DOI] [PubMed] [Google Scholar]
- 37.Rivero S, et al. Microtubule nucleation at the cis-side of the Golgi apparatus requires AKAP450 and GM130. EMBO J. 2009 doi: 10.1038/emboj.2009.47. Epub Ahead of Print. 26 February 2009; doi:10.1038/emboj.2009.47. [DOI] [PMC free article] [PubMed] [Google Scholar]
- 38.Hayes GL, et al. Multiple Rab GTPase binding sites in GCC185 suggest a model for vesicle tethering at the trans-Golgi. Mol Biol Cell. 2009;20(1):209–17. doi: 10.1091/mbc.E08-07-0740. [DOI] [PMC free article] [PubMed] [Google Scholar]
- 39.Lansbergen G, et al. CLASPs attach microtubule plus ends to the cell cortex through a complex with LL5beta. Dev Cell. 2006;11(1):21–32. doi: 10.1016/j.devcel.2006.05.012. [DOI] [PubMed] [Google Scholar]
- 40.Wittmann T, Waterman-Storer CM. Spatial regulation of CLASP affinity for microtubules by Rac1 and GSK3beta in migrating epithelial cells. J Cell Biol. 2005;169(6):929–39. doi: 10.1083/jcb.200412114. [DOI] [PMC free article] [PubMed] [Google Scholar]
- 41.Mimori-Kiyosue Y, et al. CLASP1 and CLASP2 bind to EB1 and regulate microtubule plus-end dynamics at the cell cortex. J Cell Biol. 2005;168(1):141–53. doi: 10.1083/jcb.200405094. [DOI] [PMC free article] [PubMed] [Google Scholar]
- 42.Patel H, et al. The multi-FERM-domain-containing protein FrmA is required for turnover of paxillin-adhesion sites during cell migration of Dictyostelium. J Cell Sci. 2008;121(Pt 8):1159–64. doi: 10.1242/jcs.021725. [DOI] [PubMed] [Google Scholar]
- 43.Thomas JH, Wieschaus E. src64 and tec29 are required for microfilament contraction during Drosophila cellularization. Development. 2004;131(4):863–71. doi: 10.1242/dev.00989. [DOI] [PubMed] [Google Scholar]
Associated Data
This section collects any data citations, data availability statements, or supplementary materials included in this article.
Supplementary Materials
1
2
