A Novel Native Store-operated Calcium Channel Encoded by Orai3: SELECTIVE REQUIREMENT OF Orai3 VERSUS Orai1 IN ESTROGEN RECEPTOR-POSITIVE VERSUS ESTROGEN RECEPTOR-NEGATIVE BREAST CANCER CELLS (original) (raw)
Abstract
Store-operated calcium (Ca2+) entry (SOCE) mediated by STIM/Orai proteins is a ubiquitous pathway that controls many important cell functions including proliferation and migration. STIM proteins are Ca2+ sensors in the endoplasmic reticulum and Orai proteins are channels expressed at the plasma membrane. The fall in endoplasmic reticulum Ca2+ causes translocation of STIM1 to subplasmalemmal puncta where they activate Orai1 channels that mediate the highly Ca2+-selective Ca2+ release-activated Ca2+ current (ICRAC). Whereas Orai1 has been clearly shown to encode SOCE channels in many cell types, the role of Orai2 and Orai3 in native SOCE pathways remains elusive. Here we analyzed SOCE in ten breast cell lines picked in an unbiased way. We used a combination of Ca2+ imaging, pharmacology, patch clamp electrophysiology, and molecular knockdown to show that native SOCE and ICRAC in estrogen receptor-positive (ER+) breast cancer cell lines are mediated by STIM1/2 and Orai3 while estrogen receptor-negative (ER−) breast cancer cells use the canonical STIM1/Orai1 pathway. The ER+ breast cancer cells represent the first example where the native SOCE pathway and ICRAC are mediated by Orai3. Future studies implicating Orai3 in ER+ breast cancer progression might establish Orai3 as a selective target in therapy of ER+ breast tumors.
Keywords: Calcium Channels, Calcium Imaging, Calcium Intracellular Release, Endoplasmic Reticulum (ER), Ion Channels, CRAC Channels, Orai, STIM, Store-operated Channels
Introduction
Breast cancer is the most widespread cancer in women accounting for almost a third of all new cancer cases among women in Western countries(1, 2). Whereas most breast cancers express hormone receptors, primarily estrogen receptors (ER),2 and depend on these hormones for their growth, an estimated 15–20% of all cases harbor the triple-negative (estrogen receptor/progesterone receptor/epidermal growth factor receptor 2-negative) phenotype (3, 4). Although breast cancer tumors are widely heterogeneous, the presence or absence of estrogen receptors on breast tumor cells represents one of the main criteria used for prognosis and for choice of hormonal and chemotherapeutic drugs.
Store-operated calcium (Ca2+) entry (SOCE) is a ubiquitous pathway necessary for refilling internal Ca2+ stores and for signaling downstream to the nucleus(5–9). SOCE have been implicated in many cell functions such as proliferation, migration, and differentiation (5, 10–12). However, a thorough characterization of the SOCE pathway in estrogen receptor-positive (ER+) and negative (ER−) breast cancer cells is so far missing. Upon store depletion, the Ca2+ sensor STIM1, that resides in the endoplasmic reticulum, oligomerizes and translocates to subplasmalemmal puncta(13, 14) where it activate Orai1 channels located in the plasma membrane that mediate highly Ca2+-selective currents(15–17). Mammals possess three Orai proteins (Orai1/2/3) (15); Orai1 and Orai3 are highly expressed in similar tissues including liver, lymphoid organs, skin, and skeletal muscle (18, 19). However, Orai2 is mainly found in lung, brain, spleen, and kidney (20, 21). Orai1 proteins were shown to encode the archetypical SOCE current called Ca2+ release-activated Ca2+ current (ICRAC)(15, 22); ICRAC was first recorded by Hoth and Penner in RBL mast cells(23). Since their discovery three years ago, Orai1, along with STIM1, were shown to be the predominant contributors to SOCE in many cell types, including T cells, B cells, mast cells, platelets, endothelial cells, smooth muscle cells, microglia, human embryonic kidney cells (HEK293), hepatocytes, and oocytes(10, 11, 15, 18, 19, 22, 24–28). However, the role of Orai2 and Orai3 in mediating native SOCE pathways and CRAC currents remain unknown. Here we show the first evidence for ICRAC in breast cancer cells and for a native SOCE/ICRAC pathway mediated by Orai3. We demonstrate that the SOCE pathway is mediated by STIM1/2 and Orai3 proteins in ER+ breast cancer cells whereas the canonical STIM1/Orai1 encodes the SOCE pathway in ER− breast cancer cells.
MATERIALS AND METHODS
Reagents
Thapsigargin, 2-APB, and nimodipine were purchased from Calbiochem, Fura-2AM was from Molecular Probes and GdCl3 was from Acros Organics. Cs+ BAPTA and Pluronic F-127 were from Invitrogen. siRNAs were purchased from Dharmacon (see supplemental Table S2 for sequences). All the cell lines were bought from ATCC. All primers were synthesized by Integrated DNA Technologies. The transfection kit (VCA-1003) was from Lonza. All other chemicals were from Fisher.
Cell Culture
The media used for different cell lines are as follows. MCF 10A and 184A1: DMEM-F12, 2 mm l-glutamine, 1% penicillin/streptomycin, 20 ng/ml epidermal growth factor, 100 ng/ml cholera toxin, 500 ng/ml hydrocortisone, 5% horse serum, 0.2% insulin. MDA-MB231: DMEM, 2 mm l-glutamine, 10% FBS, 1% penicillin/streptomycin, 0.1 mm NEAA, 1 mm sodium pyruvate. BT-20: MEM, 2 mm l-glutamine, 10% FBS, 1% penicillin/streptomycin, 0.1 mm NEAA, 1.5 g/liter sodium bicarbonate, 1 mm sodium pyruvate. HCC 1937 and HCC 1500: RPMI 1640 without phenol red, 2 mm l-glutamine, 10% FBS, 1% penicillin/streptomycin. MCF7: MEM without phenol red, 2 mm l-glutamine, 10% FBS, 1% penicillin/streptomycin, 0.1 mm NEAA, 1 mm sodium pyruvate, 0.2% insulin. BT-474: RPMI 1640 without phenol red, 2 mm l-glutamine, 10% FBS, 1% penicillin/streptomycin, 4.5 g/liter glucose, 10 mm HEPES, 1.5 g/liter sodium bicarbonate, 1 mm sodium pyruvate, 0.2% insulin. T47D: RPMI 1640 without phenol red, 2 mm l-glutamine, 10% FBS, 1% penicillin/streptomycin, 0.2% insulin. ZR-75–1: RPMI 1640 without phenol red, 2 mm l-glutamine, 10% FBS, 1% penicillin/streptomycin, 10 mm HEPES, 1 mm sodium pyruvate. All cells were maintained in their respective culture medium at 37 °C, 5% CO2 humidified incubator.
Real-time PCR
Cultured cells were grown to ∼80% confluence before RNA extraction. Total RNA was extracted using a Qiagen RNeasy Mini kit following the manufacturer's protocol. cDNA was made from 1 μg of RNA reverse transcribed using oligo(dT) primers (Invitrogen, Carlsbad, CA) and SuperScript III reverse transcriptase (Invitrogen). Real-time PCR analysis was performed using a Bio-Rad iCycler and iCycler iQ Optical System Software (Bio-Rad). PCR reactions were performed using Bio-Rad iQ SYBR Green Supermix. The PCR protocol started with 5 min at 94 °C, followed by 45 cycles of 30 s at 94 °C, 30 s at 54.3 °C, and 45 s at 72 °C. Quantification was measured as sample fluorescence crossed a predetermined threshold value that was just above the background. Expressions of STIM and Orai were compared with those of the housekeeping gene GAPDH and were measured using comparative threshold cycle values. The sense and antisense primers targeting human GAPDH, STIM, and Orai isoforms are described in supplemental Table S1.
Cell Transfections
Sets of either three or four different siRNAs per target gene were initially assessed for their ability to reduce mRNA levels using quantitative PCR (qPCR) as described above. siRNA sequences that induced most significant decrease in their target mRNA were used in Western blotting to confirm protein knockdown (described below). All transfections in MDA-MB231 and MCF 7 were done using Nucleofector device II (Amaxa Biosystems, Gaithersburg, MD) according to the manufacturer's instructions i.e. using program X-013 and P-020 for MDA-MB231 and MCF7, respectively. As a marker of cell transfection, 0.5 μg of green fluorescent protein (GFP) was co-transfected with siRNA for identification of successfully transfected cells during experiments. As a control, we used a non-targeting sequence (Control siRNA). Sequences of all siRNAs used in the study are listed in supplemental Table S2. Cells were transfected with 20 μg of siRNA of choice per ∼1 × 10⁶ cells, seeded on either round glass coverslips (for Ca2+ imaging and patch-clamp studies) or plates (for Western blotting) and were assayed between 72 and 96 h post-transfection.
Ca2+ Measurements
Ca2+ measurements were performed as described previously (29–31). Briefly, coverslips with attached cells were mounted in a Teflon chamber and incubated at 37 °C for 40–60 min in culture medium containing 4 μm Fura-2/AM for all cell lines expect MCF 10A and 184A1 where 3 μl of Pluronic F127 was added along with 4 μm Fura-2/AM in the loading solution. Cells were then washed (3 times) and bathed in HEPES-buffered saline solution (140 mm NaCl, 1.13 mm MgCl2, 4.7 mm KCl, 2 mm CaCl2, 10 mm d-glucose, and 10 mm HEPES, adjusted to pH 7.4 with NaOH) for at least 10 min before Ca2+ measurements were made. For Ca2+ measurements, fluorescence images of several cells were recorded and analyzed with a digital fluorescence imaging system (InCyt Im2; Intracellular Imaging Inc., Cincinnati, OH). Fura-2 fluorescence at an emission wavelength of 510 nm was induced by exciting Fura-2 alternately at 340 and 380 nm. The 340/380 ratio images were obtained on a pixel-by-pixel basis. All experiments were conducted at room temperature. All figures depicting Ca2+ imaging traces are an average from several cells from one coverslip and are representative of several independent recordings.
Western Blotting
Cells were lysed using RIPA buffer (50 mm Tris-HCl, pH 8, 150 mm NaCl, 1% Triton X-100, 0.5% sodium deoxycholate, 0.1% SDS, and 0.2 mm EDTA). Generally, 50–100 μg of proteins in denaturing conditions were subjected to SDS-PAGE (7.5–9%). Proteins from gels were then electrotransferred onto polyvinylidene fluoride membranes. After blocking with 5% nonfat dry milk (NFDM) dissolved in Tris-buffered saline containing 0.1% Tween 20 (TTBS) for 2 h at room temperature, blots were given three washes with TTBS for 5 min each and probed overnight at 4 °C, with specific primary antibodies in TTBS containing 2% NFDM. The primary antibodies used were STIM1 (1:250; BD Biosciences, San Jose, CA), hOrai1 (1:500; Prosci Inc), hOrai3-NT (1:500; ProSci Inc., Poway, CA) and β-actin-NT domain (1:2000; Sigma-Aldrich). The next day, membranes were washed with TTBS (three washes of 5 min each) and were incubated for 1 h at room temperature with a horseradish peroxidase-conjugated anti-mouse (1:20,000; Jackson ImmunoResearch Laboratories Inc., West Grove, PA) for STIM1 and actin or anti-rabbit IgG for Orai1 and Orai3 (1:10,000; Jackson ImmunoResearch Laboratories Inc.) in TTBS containing 2% NFDM. Detection was performed using the enhanced chemiluminescence reagent (ECL Western blotting detection reagents; Amersham Biosciences). Quantification of bands was achieved by densitometry using the ImageJ software.
Whole Cell Patch Clamp Electrophysiology
Patch clamp electrophysiology was essentially conducted as described previously (10, 11). The cells used for whole-cell patch clamp recordings have a capacitance of 29.9 pF±2.1 for MDA-MB231; n = 31 and 48.9pF ± 3.5 for MCF7; n = 22. 2.5–4 MΩ patch pipettes were pulled from borosilicate glass capillaries (World Precision Instruments) with P-97 flaming/brown micropipette puller (Sutter). Axopatch 200B and Digidata 1440A (Molecular Devices) with pCLAMP 10 software were used for data acquisition and analysis. Cells were seeded on round coverslips for 24–72 h before experiment. Immediately before the experiments, cells were washed with bath solution containing (in mm): sodium methanesulfonate, 145; MgSO4, 1.2; HEPES, 10; CaCl2, 10; and glucose, 10 (pH was adjusted to 7.4 with NaOH). Pipette solution contained (in mm): Cs-methanesulfonate, 145; Cs-BAPTA, 12; MgCl2, 8; HEPES, 10 (pH adjusted to 7.2 with CsOH). Divalent-free bath solution contained (in mm): sodium methanesulfonate, 155; Na3HEDTA, 10; EDTA, 1; HEPES, 10 (pH = 7.4, adjusted with HCl). Upon obtaining GΩ seal and break-in, recordings were made from cells with <15 mΩ series resistance. Cells were maintained at 0 mV holding potential during experiments and subjected to voltage ramps from +80 to −140 mV lasting 250 ms every 3 s. Reverse ramps were designed to inhibit voltage-gated channels. 3 μm nimodipine was added to bath solution to generally stabilize membrane patches and reach better seals. The ground silver-silver chloride electrode was connected to the bath through an agar bridge. Pulses of divalent-free (DVF) solutions were delivered focally to cells with least possible pressure to minimize accidental seal damage, which could lead to leak currents contaminating recordings.
Statistical Analysis
Data are expressed as means ± S.E., and statistical analysis using one way ANOVA was done with Origin software (OriginLab, Northampton, MA). Differences are considered significant when p values are < 0.05. The p values of <0.05, <0.01, and <0.001 are represented as *, **, and ***, respectively.
RESULTS
SOCE Sensitivity to Pharmacological Blockers in ER+ and ER− Breast Cell Lines
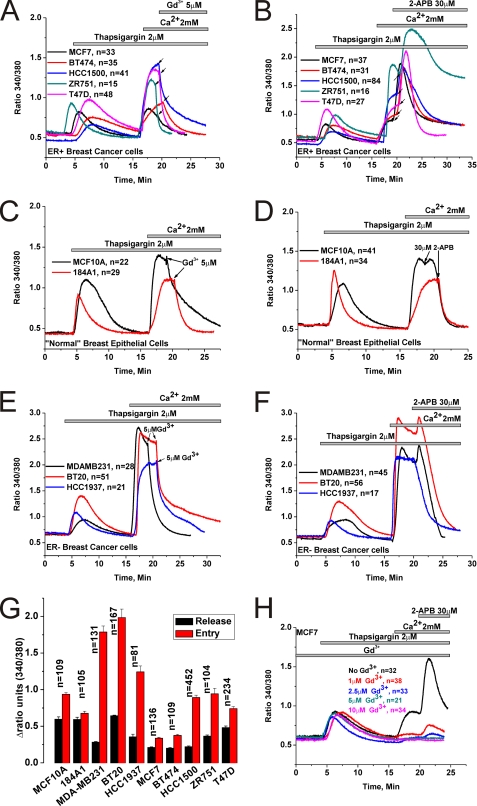
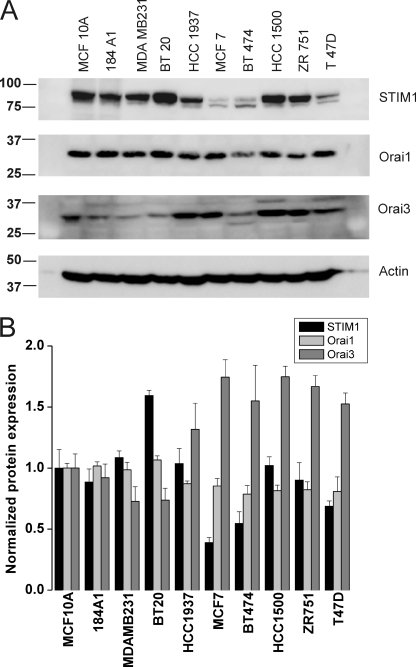
Native SOCE in many cell types has been shown to be inhibited by low concentrations of lanthanides (Gd3+; 1–10 μm) and by the drug 2-aminoethoxydiphenyl borate (2-APB; 30–50 μm)(5, 32). Previous studies comparing the functions of Orai1/2/3 when ectopically co-expressed individually with STIM1 in HEK293 cells showed that while 2-APB inhibits Orai1 and Orai2 it has the ability to activate Orai3 and to alter their ion selectivity by presumably increasing their pore size(33–36). We undertook a thorough analysis of the pharmacological features of thapsigargin-activated SOCE in 5 different ER+ and 5 ER− breast cell lines (two “normal” breast epithelial cells and 3 cancerous ones) in response to 5 μm Gd3+ and 30 μm 2-APB using Fura2 imaging. Cell lines were picked in an unbiased manner; the ER+ cell lines were: MCF7, BT474, ZR751, T47D, and HCC1500. The ER− cell lines were: MCF10A and 184A1 normal breast epithelial cells and the cancerous cell lines MDA-MB231, BT20, and HCC1937. Our results show that 5 μm Gd3+ inhibits SOCE in both ER+ and ER− cell lines (Fig. 1, A, C, E). However, while 30 μm 2-APB essentially abrogated SOCE in ER− cell lines (Fig. 1, D and F) the effect of that concentration of 2-APB on ER+ cell lines was more complex involving a transient and robust potentiation followed by sustained levels of Ca2+ entry (Fig. 1B). One exception was the cell line T47D where SOCE was equally potentiated by 2-APB, followed by partially inhibited yet sustained Ca2+ entry. There was small and transient potentiation of SOCE by 2-APB in the ER− cell lines MDA-MB231 and BT20, which is typical of Orai1(11, 37). However, the more robust and sustained potentiation of SOCE by 2-APB in ER+ cell lines clearly indicated the presence of a calcium entry channel unique to ER+ cells with features similar to those previously described for 2-APB-mediated Ca2+ entry in HEK293 cells ectopically expressing human Orai3 (33–36). Furthermore, analysis of the extent of SOCE in ER+ and ER− cell lines consistently showed that SOCE is significantly more robust in the ER− breast cancer cell lines (MDA-MB231, BT20, and HCC1937) compared with the ER+ cell lines or the ER− normal breast epithelial cells (MCF10A, 184A1) (Fig. 1G). Statistical analysis on the extent of Ca2+ release induced by thapsigargin in all 10 cell lines is also represented in Fig. 1G. Western blot analysis of STIM1, Orai1, and Orai3 proteins in all 10 cell lines revealed a significantly higher expression of Orai3 in ER+ cell lines while the expression levels of STIM1 and Orai1 were slightly lower compared with the ER− cell lines (Fig. 2A), suggesting that in ER+ cell lines the balance of STIM1/Orai interaction might be tipped toward STIM1/Orai3. Statistical analysis of the ratio of protein band densitometry to actin normalized to the protein levels of MCF10A from 3–4 independent experiments is shown in Fig. 2B.
FIGURE 1.
Pharmacology of SOCE in ER+ and ER− breast cell lines. Cells were stimulated by 2 μm thapsigargin in the absence of extracellular Ca2+ to passively deplete the intracellular Ca2+ stores followed by restoration of Ca2+ (2 mm) to the extracellular space to assess SOCE. The effects of subsequent addition of either 5 μm Gd3+ or 30 μm 2-APB on thapsigargin-activated SOCE in ER+ breast cancer cell lines (A and B), ER− normal breast epithelial cells (C and D) and ER− breast cancer cell lines (E and F) are shown. Arrows indicate for every cell line the exact moment of Gd3+ and 2-APB addition. G, the extent of SOCE as well as Ca2+ release from internal stores in response to thapsigargin was calculated in a large number of cells, for every cell line, by subtracting the basal Fura2 ratio value from that obtained after achieving either maximal peak of release in nominally free Ca2+ solution or maximal Ca2+ entry upon Ca2+ restoration to the external space; mean of data ± S.E. are shown. H, MCF7 cells were incubated in the presence of varying concentrations of Gd3+ (1–10 μm) to block SOCE followed by 30 μm 2-APB to determine the extent of potentiation; a control condition without Gd3+ is also included. Data are representative of at least four independent experiments.
FIGURE 2.
Western blot analysis of STIM1, Orai1, and Orai3 expression in breast cancer cells. A, all 10 breast cancer cells lines were lysed, and 50 μg of proteins each were loaded in the same gels. After transfer, membranes were probed with specific antibodies against either STIM1, Orai1, or Orai3 followed by the appropriate secondary antibody coupled to peroxidase as described under “Materials and Methods,” and proteins bands were visualized using the ECL kit. B, blots obtained from 3–4 independent experiments were analyzed using Image J software and densitometric ratios to corresponding actin were calculated. All densitometric values were then normalized to those of the normal cell line MCF10A.
For the rest of this study, we focused on two representative and widely studied cell lines, the ER+ MCF7 and the ER− MDA-MB231. Given the robust 2-APB potentiation of thapsigargin-activated SOCE in MCF7 cells, we reasoned that Orai3 might be contributing to SOCE in ER+ cells. While 2-APB is a nonspecific drug that has been shown to activate TRPV channels, it does so at concentrations that are 10-fold higher than those used in our study (300 μm; (38–41)). Nevertheless, to rule out contributions from TRPV channels to 2-APB-mediated potentiation of SOCE in ER+ cells, we conducted additional experiments in MCF7 cells depicted in Fig. 1H. In these experiments, pre-incubation of MCF7 cells with low concentrations of Gd3+ (1–10 μm), known to specifically inhibit Orai channels, was used to block SOCE, followed by thapsigargin stimulation using the standard Ca2+ off/Ca2+ on protocol and subsequent addition of 2-APB. At these low concentrations, Gd3+ does not inhibit TRPV channels (concentrations as high as 500 μm Gd3+ were reported to induce a slow developing block of TRPV4(42)). Fig. 1H shows that the concentration-dependent inhibition of SOCE by Gd3+ directly correlated with the reduction of 2-APB-mediated potentiation, strongly arguing that 2-APB action in MCF7 cells is likely mediated by Orai3 channels.
Electrophysiological Recordings of ICRAC in MDA-MB231 ER− and MCF7 ER+ Breast Cancer Cells
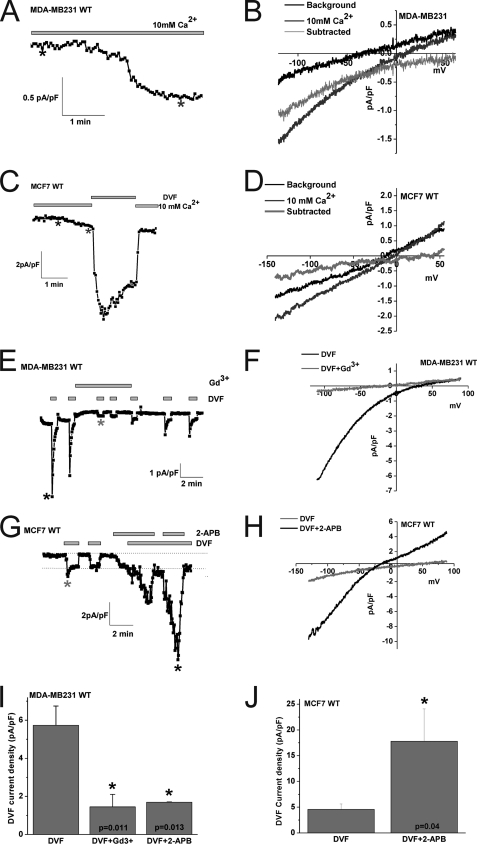
To substantiate these pharmacological data and provide confidence for the involvement of Orai3 channels in mediating SOCE in ER+ cells, we conducted whole cell patch clamp electrophysiological recordings in MDA-MB231 ER− and MCF7 ER+ cells. To characterize the current mediating SOCE in MDA-MB231 and MCF7 cells, we used the standard method for measuring ICRAC in whole-cell mode with intracellular dialysis of high concentrations of the pH-independent, fast Ca2+ chelator BAPTA, as described previously (10, 11, 33). Upon break-in with a pipette solution containing 12 mm BAPTA, a relatively small inwardly rectifying ICRAC-like current with very positive reversal potential developed in the presence of external Ca2+ (10 mm) in MDA-MB231 and MCF7 (Fig. 3_A_-D; 1.05 ± 0.25 pA/pF in MDA-MB231 versus 0.57 ± 0.1 pA/pF in MCF7 cells, at −140 mV; n = 3). Fig. 3, B and D show the current-voltage relationship (I/V) where currents recorded immediately after break-in were subtracted from fully developed currents revealing inward rectification with very positive reversal potential. To better study these ICRAC-like currents, we conducted subsequent current measurement using divalent-free (DVF) bath conditions to amplify these currents, as described previously (43, 44). Whole-cell current measurements were performed using reverse voltage ramps to minimize potential contributions from voltage-gated channels. Upon break-in in the MDA-MB231 cell line monovalent ICRAC currents were revealed in divalent free conditions that were inwardly rectifying with positive reversal potential similar to those described for Orai1-mediated ICRAC in different cell types (Fig. 3E; 5.9 ± 1.08 pA/pF at −140 mV, n = 11). These currents were essentially abrogated with 5 μm Gd3+ and 50 μm 2-APB (Fig. 3, E, I; also see supplemental Fig. S1) as previously reported for Orai1-mediated ICRAC (45). These currents displayed the peculiar phenomenon of rapid time-dependent inactivation of inward Na+ currents (called depotentiation) in DVF solutions and a very positive reversal potential of ∼+50mV in DVF which corresponds to a PCs/PNa permeability ratio of ∼ 0.1, all characteristics of ICRAC (5) (Fig. 3, E and F). After Gd3+ addition, a small Gd3+-insensitive current remained presumably corresponding to a background current. After Gd3+ washoff, only a portion of ICRAC was restored (Fig. 3E).
FIGURE 3.
Whole-cell SOCE currents in MDA-MB231 ER− and MCF7 ER+ breast cancer cells. Wild-type MDA-MB231 cells (A) or wild-type MCF7 cells (C) were dialyzed with a pipette solution containing 12 mm BAPTA to induce store depletion and whole-cell currents were measured in the presence of 10 mm extracellular Ca2+. A small inwardly rectifying ICRAC-like current developed in both cell types. B and D show the current/voltage (I/V) relationships of these Ca2+ currents in MDA-MB231 and MCF7 cells, respectively; the sweeps after break-in (black) and those when the current has developed (dark gray) were taken where shown by asterisks. The light gray sweep represents the subtraction of the “black” sweep from the “dark gray” sweep. For MCF7 (C), the trace depicted also shows amplification of the current by switching to a divalent-free (DVF) solution. Monovalent ICRAC measured in MDA-MB231 cells (E) and MCF7 cells (G) under DVF conditions is shown. Monovalent ICRAC currents measured from MDA-MB231 show substantial “depotentiation” in DVF solutions while those measured in MCF7 have a less pronounced depotentiation. Monovalent ICRAC in MCF7 is potentiated by 2-APB and this is accompanied by a change in the I/V relationship of the current (left shift of reversal potential and outward component. H, in this case, background currents were not subtracted). The I/V curve of monovalent ICRAC in MDA-MB231 is shown in F. Monovalent ICRAC in MDA-MB231 is inhibited by Gd3+ (5 μm) and 2-APB (50 μm), and data are summarized in I (n = 5). J, data summary of monovalent ICRAC current density in MCF7 cells before and after 2-APB (50 μm) potentiation (n = 7).
Upon break-in in MCF7, we also observed currents in divalent-free conditions typical of monovalent ICRAC that were inwardly rectifying with positive reversal potential (Fig. 3, G, H; 4.57 ± 1.03 pA/pF at −140 mV; n = 11). These currents observed in MCF7 also showed depotentiation in DVF solutions, although to a much lesser extent than MDA-MB231 (also see Fig. 3C) consistent with the properties described for ectopically expressed Orai3 channels (33), and a very positive reversal potential of ∼+50mV (Fig. 3H). These currents were reversibly inhibited by 5 μm Gd3+ (supplemental Fig. S2). However, upon 50 μm 2-APB addition, we observed a robust potentiation of these membrane currents by over 3-fold (Fig. 3, G, H, J). Importantly, the currents activated by 2-APB in MCF7 cells showed large outward currents at potentials greater than 0 mV with a left shift of reversal potential that is indicative of change in ion selectivity and Cs+ permeation (Fig. 3H), features that are consistent with those of 2-APB causing pore enlargement of ectopically expressed Orai3 channels that were recently reported by four independent groups (33–36). Similar results of 2-APB actions on MDA-MB231 and MCF7 cells were obtained using regular voltage ramps from −120 mV to +60 mV lasting for short durations (150 ms; supplemental Fig. S1).
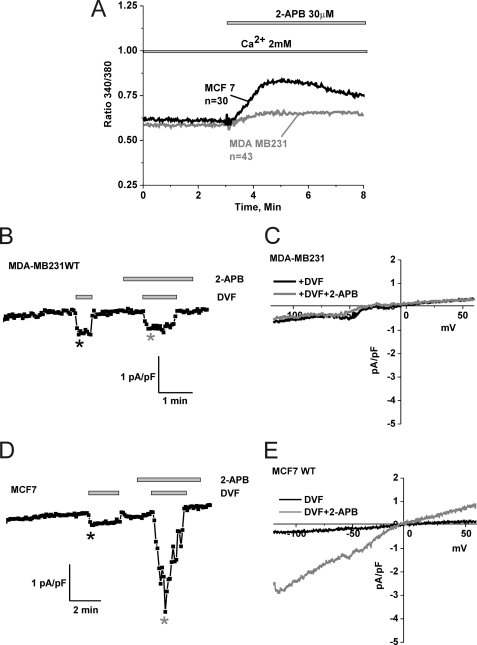
We next tested whether 2-APB can cause Ca2+ entry and membrane currents in MCF7 and MDA-MB231 cells, in the absence of store depletion. Fig. 4A shows a Fura2 experiment where cells were incubated in HBSS containing 2 mm Ca2+ and stimulated with 2-APB. In this case, 2-APB caused a small but significant increase in intracellular Ca2+ in MCF7 cells with no apparent effect on MDA-MB231 cells (Fig. 4A). We conducted whole cell patch clamp recordings using a pipette solution where Ca2+ was buffered to 100 nm using the chelator BAPTA to avoid store depletion (buffered 100 nm Ca2+ was achieved using the software Maxchelator). Using DVF protocols we found that while 2-APB failed to generate a membrane current in MDA-MB231 cells (Fig. 4, B and C), it caused significant current in MCF7 cells consistent with the Fura2 data (Fig. 4, D and E). These 2-APB-activated currents in MCF7 cells were substantially smaller than the currents generated in the same cells when 2-APB was added after store depletion (e.g. see Fig. 3, G and J). Also note the I/V curve (Fig. 4E) that is consistent with the modification of Orai3 pore properties by 2-APB.
FIGURE 4.
2-APB activates Ca2+ entry and membrane currents in MCF7 cells in the absence of store depletion. A, MDA-MB231 and MCF7 cells were loaded with Fura2 and incubated in an HBSS solution containing 2 mm Ca2+ followed by stimulation with 30 μm 2-APB; only MCF7 show a significant Ca2+ entry upon 2-APB stimulation (similar results were obtained with 50 μm 2-APB). Using a pipette solution where Ca2+ was buffered to the physiological concentration of 100 nm, whole cell recording in MDA-MB231 showed no increase in DVF currents after addition of 50 μm 2-APB (B and C) while MCF7 showed substantial current activation in response to the same concentration of 2-APB (D and E). The I/V curves represented in C and E were taken where indicated by the color-coded asterisks in B and D, respectively.
SOCE and ICRAC Are Mediated by Orai1 and Orai3 in MDA-MB231 and MCF7 Cells, Respectively
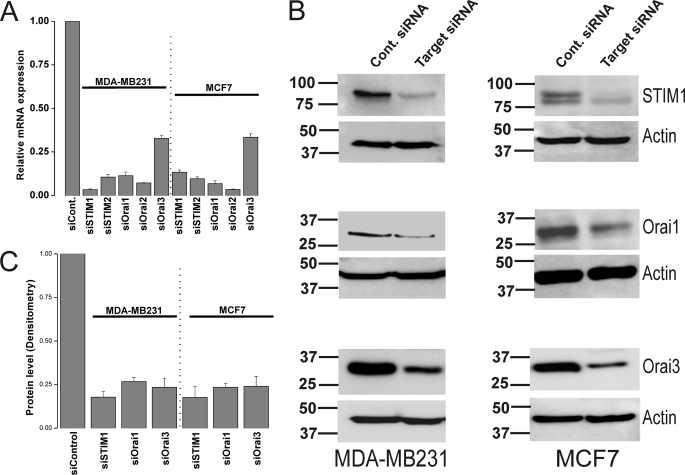
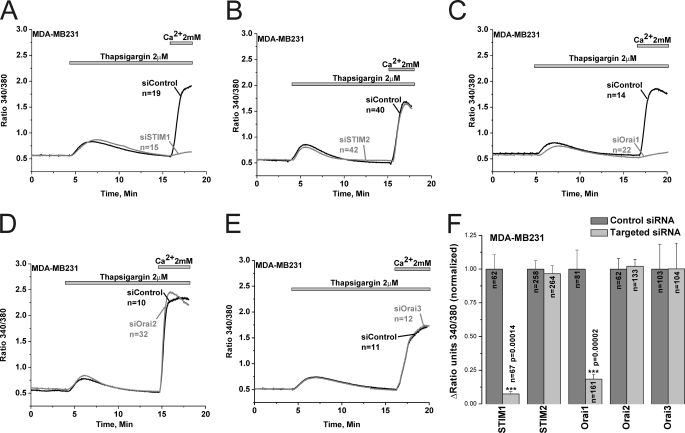
Because the specificity of 2-APB is questionable despite the low concentrations used in our study (30–50 μm), we conducted molecular knockdown on all the 5 potential SOCE proteins to unequivocally determine the molecular identity of SOCE in ER− and ER+ breast cancer cells. Systematic gene silencing using short interfering RNA (siRNA) against STIM and Orai isoforms was performed to establish the molecular nature of SOCE in MCF7 and MDA-MB231. The siRNA sequences used are listed in the online supplement, some of which have been used previously for successful protein knockdown in human endothelial cells (10). Fig. 5A shows that these siRNA sequences were efficient in causing robust reduction in mRNA expression of their respective target genes (Fig. 5A). Western blots analysis using anti-STIM1, anti-Orai1 and anti-Orai3 antibodies confirmed knockdown of these proteins in MDA-MB231 and MCF7 72 h after transfection with specific siRNA (Fig. 5B; % of knockdown: 82.27% ± 3.41 and 82.44% ± 6.16 for siSTIM1; 73.6% ± 2.4 and 76.64% ± 2.2 for siOrai1; 76.59% ± 5.1, and 76.05% ± 5.7 for siOrai3 in MDA-MB231 and MCF7, respectively; n = 3; see Fig. 5C for statistics of protein knockdown). Using Fura2 Ca2+ imaging, we show that knockdown of either STIM1 or Orai1 essentially abrogated SOCE in MDA-MB231 cells (92.6% ± 1.8 inhibition for siSTIM1 and 81.6% ± 3.5 for siOrai1) while knockdown of STIM2, Orai2 and Orai3 had no significant effect on SOCE in these cells (Fig. 6). Statistical analysis of all Ca2+ imaging data using target-specific and control siRNA in MDA-MB231 are shown in Fig. 6F. Similar results were obtained in MDA-MB231 cells with a second set of siRNA/shRNA sequences directed against STIM1, Orai1, and Orai3 (supplemental Fig. S3).
FIGURE 5.
Protein and mRNA knockdown of STIM and Orai isoforms in MDA-MB231 and MCF7 cells. MDA-MB231 and MCF7 cells were transfected with either control non-targeting siRNA or specific siRNA against STIM1, STIM2, Orai1, Orai2, or Orai3 and mRNA were extracted 72-h post-transfection, reverse transcribed, and assayed using real-time PCR as described under “Materials and Methods.” Each specific siRNA caused a significant decrease of its corresponding target mRNA (A). Data represent average ± S.E. from three independent transfections analyzed in duplicates. Western blotting analysis using specific antibodies was conducted to assess the protein knockdown of STIM1, Orai1, and Orai3 after transfection with specific siRNA and non-targeted control siRNA in MDA-MB231 and MCF7 cells; the corresponding anti-actin loading controls are also shown (B). Data are representative of three independent transfections and statistical analysis of protein knockdown is included in the text and depicted in C.
FIGURE 6.
SOCE in MDA-MB231 cells is mediated by STIM1 and Orai1. Thapsigargin-activated SOCE in MDA-MB231 cells was measured using Fura2 and the standard “Ca2+ off/Ca2+ on” protocol in cells transfected with either specific siRNA against STIM1 (A), STIM2 (B), Orai1 (C), Orai2 (D), or Orai3 (E) or control non-targeted siRNA performed on the same day; measurements were performed on day 3 post-transfection. Data are representative of 6–15 independent experiments from 2–4 independent transfections. The effect of siRNA against STIM and Orai isoforms and corresponding control non-targeted siRNA on SOCE in MDA-MB231 was statistically analyzed on cells from different independent experiments and depicted in F.
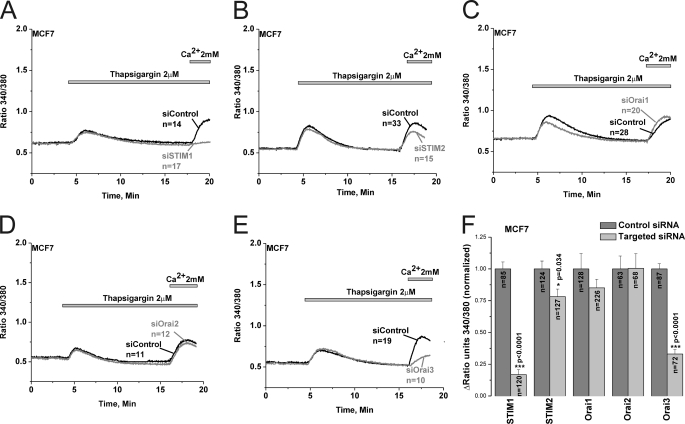
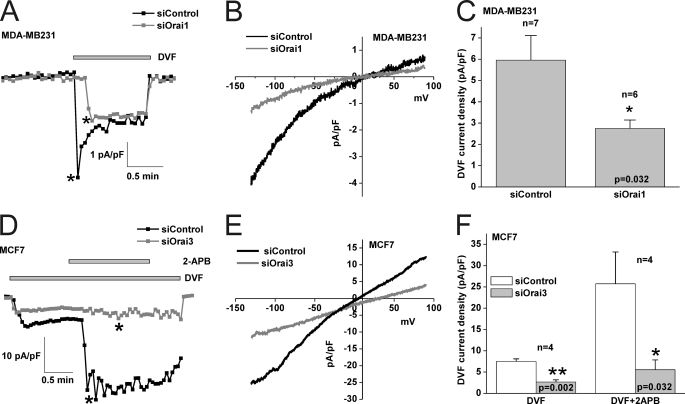
Interestingly, protein knockdown studies revealed that SOCE in MCF7 was mediated by STIM1 and Orai3 independently of Orai1 and Orai2 (83.2% ± 3.9 inhibition for siSTIM1 and 67% ± 3.4 for siOrai3); STIM2 knockdown had a modest yet statistically significant effect (21.8% ± 5.9 inhibition for siSTIM2) on SOCE in MCF7 cells (Fig. 7). Statistical analysis of all Ca2+ imaging data using target-specific and control siRNA in MCF7 are shown in Fig. 7F. Similar results were obtained in MCF7 cells with a second set of siRNA/shRNA sequences directed against STIM1, Orai1 and Orai3 (supplemental Fig. S4). Furthermore, Orai3 knockdown was accompanied by strong inhibition of 2-APB-mediated SOCE potentiation in MCF7 cells, further indicating that Orai3 is the major SOCE channel in MCF7 cells (supplemental Fig. S5). Whole-cell patch clamp recordings demonstrated that Orai1 knockdown significantly inhibited store depletion-activated ICRAC membrane currents measured in DVF conditions in MDA-MB231 (54.16% ± 6.55 inhibition, n = 6; Fig. 8, A–C) while Orai3 knockdown inhibited monovalent ICRAC currents in MCF7 cells (58.84% ± 7.04 inhibition, n = 4; Fig. 8, D–F). Current/voltage relationships of monovalent ICRAC currents in MDA-MB231 and MCF7 cells with control siRNA and siRNA against Orai isoforms (Fig. 8, B and E) as well as statistical analysis (Fig. 8, C and F) are shown.
FIGURE 7.
SOCE in MCF7 cells is mediated by STIM1/2 and Orai3. Thapsigargin-activated SOCE in MCF7 cells was measured using Fura2 and the standard “Ca2+ off/Ca2+ on” protocol in cells transfected with either specific siRNA against STIM1 (A), STIM2 (B), Orai1 (C), Orai2 (D), or Orai3 (E) or control non-targeted siRNA performed on the same day; measurements were performed on day 3 post-transfection. The effect of siRNA against STIM and Orai isoforms and corresponding control non-targeted siRNA on SOCE in MCF7 was statistically analyzed on cells from different independent experiments and depicted in F.
FIGURE 8.
Orai1 and Orai3 mediate ICRAC in MDA-MB231 and MCF7 cells, respectively. A, Orai1 knockdown causes inhibition of monovalent ICRAC measured using DVF pulses as compared with non-targeted control siRNA conditions. The I/V relationships of control siRNA and Orai1-targeted siRNA conditions in MDA-MB231 cells are shown in B, and statistical analysis on the effect of Orai1 knockdown on monovalent ICRAC (n = 7) is represented in C. D, Orai3 knockdown causes inhibition of monovalent ICRAC in MCF7 cells as well as an inhibition of 2-APB-mediated potentiation of this current. The I/V relationships of control siRNA and Orai3-targeted siRNA conditions in MCF7 cells after 2-APB addition are shown in E. Statistical analysis on the effect of Orai3 knockdown on monovalent ICRAC in MCF7 cells (n = 4) before and after 2-APB addition is represented in F. Throughout, background currents were not subtracted.
DISCUSSION
During the past few decades, increased understanding of the molecular heterogeneity of breast cancers has led to significant improvements in therapeutic modalities of this disease. In over two-third of breast cancers, ER signaling is a key instigator of tumor growth, and inhibition of this important pathway using ER modulators such as tamoxifen has shown a clear therapeutic benefit (3). However, most of breast cancer therapies currently available are effective only in a proportion of ER+ breast cancers and new targets are constantly needed. The newly discovered STIM/Orai pathway is known to control many physiological and pathophysiological functions, but its expression and role in cancer is only starting to emerge. Only recently, STIM1 and Orai1 were shown to play an important role in breast cancer cell migration and metastasis using the MDA-MB231 ER− cell model (46). Ritchie et al. demonstrated that STIM1 gene expression in primary Wilms tumors is reciprocally regulated by Wilms tumor suppressor 1 (WT1) and early growth response 1 (EGR1) (47). The expression and role of STIM/Orai isoforms in ER+ breast cancer progression is currently unknown. Our data clearly implicate a selective involvement of Orai3 in the ER+ breast cancer cell line MCF7, one of the most recognized and widely studied cell models for ER+ breast cancer. The four other ER+ cell types used in this study were picked randomly based solely on their positivity for the ER; according to 2-APB pharmacology and Orai3 protein expression, all these ER+ cell lines (BT474, ZR75–1, HCC1500, and T47D) likely use Orai3 as their predominant SOCE pathway. However, the ER− cell lines use the canonical STIM1/Orai1 as their main SOCE pathway, like all cell types from a number of tissues analyzed so far (10, 11, 15, 18, 19, 22, 24–28).
Whereas ion channels in general and calcium channels in particular represent attractive targets for drug therapy of human disease, to this day no channel molecule has been exploited for either therapy or diagnosis of breast cancer(48, 49). Clearly, many important questions need to be resolved by future studies before Orai3 could represent such a target. Namely, what is the precise role of Orai3 in ER+ breast cancer growth, migration and apoptotic/anti-apoptotic pathways? What is the connection between the presence of ER and Orai3? What are the molecular mechanisms that control the functional switch of Orai isoforms in breast cancer? What are the growth factors that mediate their function through Orai3 in ER+ breast cancer cells? The answer to these questions might establish Orai3 as a target for therapy of ER+ breast cancers. Our study showing a unique involvement of Orai3 in the SOCE pathway in ER+ cells represents a first step toward this important goal.
Supplementary Material
Supplemental Data
Acknowledgments
We thank Dr. Alexander A. Mongin for critical help during the course of these studies and Jonathan M. Bisaillon for performing real-time PCR experiments. We also thank Dr. Ceshi Chen and Dr. J. Andres Melendez for providing useful reagents during the early stages of this project. We would like to thank Drs. David Jourd'heuil, Harold Singer, and Peter Vincent for helpful discussions. R.K.M. is indebted to José Gonzàlez-Cobos, Frances Jourd'heuil, Amy Spinelli, Katharine Halligan, Arti Shinde, and Devender Kumar for their constant help, support, and encouragement. The administrative help of Wendy Hobb-Vienneau and Jo Anne La Plante-Evans is also gratefully acknowledged.
*
This work was supported, in whole or in part, by an early career National Institutes of Health Grant 5K22 ES014729 and funds allocated through the American Recovery and Reinvestment Act (ARRA) supplements 3K22ES014729-03S1 and 3K22ES014729-03S2 (to M. T.).
2
The abbreviations used are:
ER
estrogen receptor
SOCE
store-operated calcium entry
DMEM
Dulbecco's modified Eagle's medium
FBS
fetal bovine serum
GAPDH
glyceraldehyde-3-phosphate dehydrogenase
APB
2-aminoethoxydiphenyl borate.
REFERENCES
- 1.Glass A. G., Lacey J. V., Jr., Carreon J. D., Hoover R. N. (2007) J. Natl. Cancer Inst. 99, 1152–1161 [DOI] [PubMed] [Google Scholar]
- 2.Jemal A., Ward E., Thun M. J. (2007) Breast Cancer Res. 9, R28. [DOI] [PMC free article] [PubMed] [Google Scholar]
- 3.Bai Z., Gust R. (2009) Archiv der Pharmazie 342, 133–149 [DOI] [PubMed] [Google Scholar]
- 4.Hurvitz S. A., Finn R. S. (2009) Future Oncology 5, 1015–1025 [DOI] [PubMed] [Google Scholar]
- 5.Parekh A. B., Putney J. W., Jr. (2005) Physiol. Rev. 85, 757–810 [DOI] [PubMed] [Google Scholar]
- 6.Putney J. W., Jr. (1986) Cell Calcium 7, 1–12 [DOI] [PubMed] [Google Scholar]
- 7.Putney J. W. (2009) Immunol. Rev. 231, 10–22 [DOI] [PubMed] [Google Scholar]
- 8.Potier M., Trebak M. (2008) Pflugers Arch. 457, 405–415 [DOI] [PMC free article] [PubMed] [Google Scholar]
- 9.Feske S. (2007) Nat. Rev. Immunol. 7, 690–702 [DOI] [PubMed] [Google Scholar]
- 10.Abdullaev I. F., Bisaillon J. M., Potier M., Gonzalez J. C., Motiani R. K., Trebak M. (2008) Circ. Res. 103, 1289–1299 [DOI] [PMC free article] [PubMed] [Google Scholar]
- 11.Potier M., Gonzalez J. C., Motiani R. K., Abdullaev I. F., Bisaillon J. M., Singer H. A., Trebak M. (2009) FASEB J. 23, 2425–2437 [DOI] [PMC free article] [PubMed] [Google Scholar]
- 12.Bisaillon J. M., Motiani R. K., Gonzalez-Cobos J. C., Potier M., Halligan K. E., Alzawahra W. F., Barroso M., Singer H. A., Jourd'heuil D., Trebak M.Am. J. Physiol. Cell Physiol. 298, 993–1005 [DOI] [PMC free article] [PubMed] [Google Scholar]
- 13.Liou J., Kim M. L., Heo W. D., Jones J. T., Myers J. W., Ferrell J. E., Jr., Meyer T. (2005) Curr. Biol. 15, 1235–1241 [DOI] [PMC free article] [PubMed] [Google Scholar]
- 14.Roos J., DiGregorio P. J., Yeromin A. V., Ohlsen K., Lioudyno M., Zhang S., Safrina O., Kozak J. A., Wagner S. L., Cahalan M. D., Veliçelebi G., Stauderman K. A. (2005) J. Cell Biol. 169, 435–445 [DOI] [PMC free article] [PubMed] [Google Scholar]
- 15.Feske S., Gwack Y., Prakriya M., Srikanth S., Puppel S. H., Tanasa B., Hogan P. G., Lewis R. S., Daly M., Rao A. (2006) Nature 441, 179–185 [DOI] [PubMed] [Google Scholar]
- 16.Vig M., Beck A., Billingsley J. M., Lis A., Parvez S., Peinelt C., Koomoa D. L., Soboloff J., Gill D. L., Fleig A., Kinet J. P., Penner R. (2006) Curr. Biol. 16, 2073–2079 [DOI] [PMC free article] [PubMed] [Google Scholar]
- 17.Zhang S. L., Yeromin A. V., Zhang X. H., Yu Y., Safrina O., Penna A., Roos J., Stauderman K. A., Cahalan M. D. (2006) Proc. Natl. Acad. Sci. U.S.A. 103, 9357–9362 [DOI] [PMC free article] [PubMed] [Google Scholar]
- 18.Gwack Y., Srikanth S., Oh-Hora M., Hogan P. G., Lamperti E. D., Yamashita M., Gelinas C., Neems D. S., Sasaki Y., Feske S., Prakriya M., Rajewsky K., Rao A. (2008) Mol. Cell Biol. 28, 5209–5222 [DOI] [PMC free article] [PubMed] [Google Scholar]
- 19.Vig M., DeHaven W. I., Bird G. S., Billingsley J. M., Wang H., Rao P. E., Hutchings A. B., Jouvin M. H., Putney J. W., Kinet J. P. (2008) Nat. Immunol. 9, 89–96 [DOI] [PMC free article] [PubMed] [Google Scholar]
- 20.Gross S. A., Wissenbach U., Philipp S. E., Freichel M., Cavalié A., Flockerzi V. (2007) J. Biol. Chem. 282, 19375–19384 [DOI] [PubMed] [Google Scholar]
- 21.Gwack Y., Srikanth S., Feske S., Cruz-Guilloty F., Oh-hora M., Neems D. S., Hogan P. G., Rao A. (2007) J. Biol. Chem. 282, 16232–16243 [DOI] [PubMed] [Google Scholar]
- 22.Vig M., Peinelt C., Beck A., Koomoa D. L., Rabah D., Koblan-Huberson M., Kraft S., Turner H., Fleig A., Penner R., Kinet J. P. (2006) Science 312, 1220–1223 [DOI] [PMC free article] [PubMed] [Google Scholar]
- 23.Hoth M., Penner R. (1992) Nature 355, 353–356 [DOI] [PubMed] [Google Scholar]
- 24.Prakriya M., Feske S., Gwack Y., Srikanth S., Rao A., Hogan P. G. (2006) Nature 443, 230–233 [DOI] [PubMed] [Google Scholar]
- 25.Ohana L., Newell E. W., Stanley E. F., Schlichter L. C. (2009) Channels 3, 129–139 [DOI] [PubMed] [Google Scholar]
- 26.Braun A., Varga-Szabo D., Kleinschnitz C., Pleines I., Bender M., Austinat M., Bösl M., Stoll G., Nieswandt B. (2009) Blood 113, 2056–2063 [DOI] [PubMed] [Google Scholar]
- 27.Yu F., Sun L., Machaca K. (2009) Proc. Natl. Acad. Sci. U.S.A. 106, 17401–17406 [DOI] [PMC free article] [PubMed] [Google Scholar]
- 28.Jones B. F., Boyles R. R., Hwang S. Y., Bird G. S., Putney J. W. (2008) Hepatology 48, 1273–1281 [DOI] [PMC free article] [PubMed] [Google Scholar]
- 29.Trebak M., Hempel N., Wedel B. J., Smyth J. T., Bird G. S., Putney J. W., Jr. (2005) Mol. Pharmacol. 67, 558–563 [DOI] [PubMed] [Google Scholar]
- 30.Trebak M., St J., Bird G., McKay R. R., Birnbaumer L., Putney J. W., Jr. (2003) J. Biol. Chem. 278, 16244–16252 [DOI] [PubMed] [Google Scholar]
- 31.Trebak M., Lemonnier L., DeHaven W. I., Wedel B. J., Bird G. S., Putney J. W., Jr. (2009) Pflugers Arch. 457, 757–769 [DOI] [PMC free article] [PubMed] [Google Scholar]
- 32.Trebak M., Bird G. S., McKay R. R., Putney J. W., Jr. (2002) J. Biol. Chem. 277, 21617–21623 [DOI] [PubMed] [Google Scholar]
- 33.DeHaven W. I., Smyth J. T., Boyles R. R., Bird G. S., Putney J. W., Jr. (2008) J. Biol. Chem. 283, 19265–19273 [DOI] [PMC free article] [PubMed] [Google Scholar]
- 34.Schindl R., Bergsmann J., Frischauf I., Derler I., Fahrner M., Muik M., Fritsch R., Groschner K., Romanin C. (2008) J. Biol. Chem. 283, 20261–20267 [DOI] [PubMed] [Google Scholar]
- 35.Peinelt C., Lis A., Beck A., Fleig A., Penner R. (2008) J. Physiol. 586, 3061–3073 [DOI] [PMC free article] [PubMed] [Google Scholar]
- 36.Zhang S. L., Kozak J. A., Jiang W., Yeromin A. V., Chen J., Yu Y., Penna A., Shen W., Chi V., Cahalan M. D. (2008) J. Biol. Chem. 283, 17662–17671 [DOI] [PMC free article] [PubMed] [Google Scholar]
- 37.Prakriya M., Lewis R. S. (2001) J. Physiol. 536, 3–19 [DOI] [PMC free article] [PubMed] [Google Scholar]
- 38.Braun F. J., Aziz O., Putney J. W., Jr. (2003) Mol. Pharmacol. 63, 1304–1311 [DOI] [PubMed] [Google Scholar]
- 39.Chung M. K., Lee H., Mizuno A., Suzuki M., Caterina M. J. (2004) J. Neurosci. 24, 5177–5182 [DOI] [PMC free article] [PubMed] [Google Scholar]
- 40.Gu Q., Lin R. L., Hu H. Z., Zhu M. X., Lee L. Y. (2005) Am. J. Physiol. Lung Cell Mol. Physiol. 288, L932–941 [DOI] [PMC free article] [PubMed] [Google Scholar]
- 41.Colton C. K., Zhu M. X. (2007) Handbook of Experimental Pharmacology, Springer, New York, Vol. 179, pp. 173–187 [DOI] [PMC free article] [PubMed] [Google Scholar]
- 42.Liedtke W., Choe Y., Martí-Renom M. A., Bell A. M., Denis C. S., Sali A., Hudspeth A. J., Friedman J. M., Heller S. (2000) Cell 103, 525–535 [DOI] [PMC free article] [PubMed] [Google Scholar]
- 43.Bakowski D., Parekh A. B. (2002) Cell Calcium 32, 379–391 [DOI] [PubMed] [Google Scholar]
- 44.Bakowski D., Parekh A. B. (2002) Pflugers Arch. 443, 892–902 [DOI] [PubMed] [Google Scholar]
- 45.DeHaven W. I., Smyth J. T., Boyles R. R., Putney J. W., Jr. (2007) J. Biol. Chem. 282, 17548–17556 [DOI] [PubMed] [Google Scholar]
- 46.Yang S., Zhang J. J., Huang X. Y. (2009) Cancer Cell 15, 124–134 [DOI] [PubMed] [Google Scholar]
- 47.Ritchie M. F., Yue C., Zhou Y., Houghton P. J., Soboloff J.J. Biol. Chem. 285, 10591–10596 [DOI] [PMC free article] [PubMed] [Google Scholar]
- 48.Monteith G. R., McAndrew D., Faddy H. M., Roberts-Thomson S. J. (2007) Nat. Rev. 7, 519–530 [DOI] [PubMed] [Google Scholar]
- 49.Schönherr R. (2005) J. Membr. Biol. 205, 175–184 [DOI] [PubMed] [Google Scholar]
Associated Data
This section collects any data citations, data availability statements, or supplementary materials included in this article.
Supplementary Materials
Supplemental Data
