TLR recognition of self nucleic acids hampers glucocorticoid activity in lupus (original) (raw)
. Author manuscript; available in PMC: 2011 Jun 17.
Published in final edited form as: Nature. 2010 Jun 17;465(7300):937–941. doi: 10.1038/nature09102
Abstract
Glucocorticoids are widely used to treat patients with autoimmune diseases such as systemic lupus erythematosus (SLE)1,2. However, regimens used to treat many such conditions cannot maintain disease control in the majority of SLE patients and more aggressive approaches such as high-dose methylprednisolone pulse therapy are used to provide transient reductions in disease activity3,4. The primary anti-inflammatory mechanism of glucocorticoids is thought to be NF-κB inhibition5. Recognition of self nucleic acids by toll-like receptors TLR7 and TLR9 on B cells and plasmacytoid dendritic cells (PDCs) is an important step in the pathogenesis of SLE6, promoting anti-nuclear antibodies and the production of type I interferon (IFN), both correlated with the severity of disease1,7. Following their activation by self-nucleic acid-associated immune complexes, PDCs migrate to the tissues8,9. We demonstrate, in vitro and in vivo, that stimulation of PDCs through TLR7 and 9 can account for the reduced activity of glucocorticoids to inhibit the IFN pathway in SLE patients and in two lupus-prone mouse strains. The triggering of PDCs through TLR7 and 9 by nucleic acid-containing immune complexes or by synthetic ligands activates the NF-κB pathway essential for PDC survival. Glucocorticoids do not affect NF-κB activation in PDCs, preventing glucocorticoid induction of PDC death and the consequent reduction of systemic IFN-α levels. These findings unveil a new role for self nucleic acid recognition by TLRs and indicate that inhibitors of TLR7 and 9 signalling could prove to be effective corticosteroid-sparing drugs.
SLE is an autoimmune disease characterized by chronic stimulation of the innate immune system by endogenous nucleic acids1,6. SLE patients are often treated with strong immunosuppressive regimens, including cytotoxic drugs, antimalarial compounds and glucocorticoids1,2. Type I IFNs are central to disease pathogenesis; increased expression of IFN-regulated genes, termed the IFN-signature, correlates with autoantibodies and disease activity1,7. PDCs are the major source of IFN-α induced by nucleic acid-containing immune complexes6. Once activated by self DNA/chromatin or small nuclear ribonucleoprotein particle (snRNP)-containing immune complex6, PDCs migrate from the blood into inflamed tissues including the skin8 and kidney9.
Glucocorticoids have strong anti-inflammatory effects on both acquired and innate immune functions. They inhibit B and T cell responses and effector functions of monocytes and neutrophils. At the cellular level, glucocorticoids inhibit NF-κB activity, thought to be the main mechanism by which glucocorticoids exert their anti-inflammatory effects5. In lupus, glucocorticoids are typically administered orally on a daily basis, as the typical every other day regimens cannot maintain disease control. When doses greater than 40 mg per day are required, patients receive intravenous methylprednisolone (Solu-Medrol) pulse therapy (30 mg kg−1 up to 1 g day−1). Such treatment can transiently reduce disease activity, but often does not induce remission or prevent end organ damage2–4. The reason why treatment of SLE requires much higher glucocorticoid doses than many other autoimmune diseases is not clear.
Lupus patients without treatment or with maintenance hydroxychloroquine (HCQ) treatment (200–400 mg day−1) display characteristic transcriptional changes in their blood cells (Fig. 1a, left). These changes can be analysed using ‘modules’ of transcriptionally co-regulated genes10. Multiple transcriptional modules normalize in patients receiving oral glucocorticoids (5–20 mg day−1) and/or mycophenolate mofetil (Fig. 1a), reflecting the strong immunosuppressive effect of glucocorticoids. However, the IFN pathway is not affected in patients treated by oral glucocorticoids (Fig. 1a and 71 SLE patients summarized in Fig. 1c). Consistent with this, glucocorticoids do not significantly reduce the production of IFN-α upon PDC activation with the TLR7 and 9 ligands influenza virus (FLU) or a CpG-containing immunostimulatory sequence (CpG-ISS), or with immune complexes from SLE patients (Fig. 1b and Supplementary Fig. 1a). This was confirmed by IFN-α protein levels (Supplementary Fig. 2b). Addition of a bifunctional TLR7 and 9 inhibitor, called immunoregulatory sequence (IRS, dashed line)11 however, was effective at blocking IFN-α production (Fig. 1b and Supplementary Fig. 1a).
Figure 1. Level of expression of the PDC-induced IFN signature in glucocorticoid-treated SLE patients strictly correlates with circulating blood PDCs.
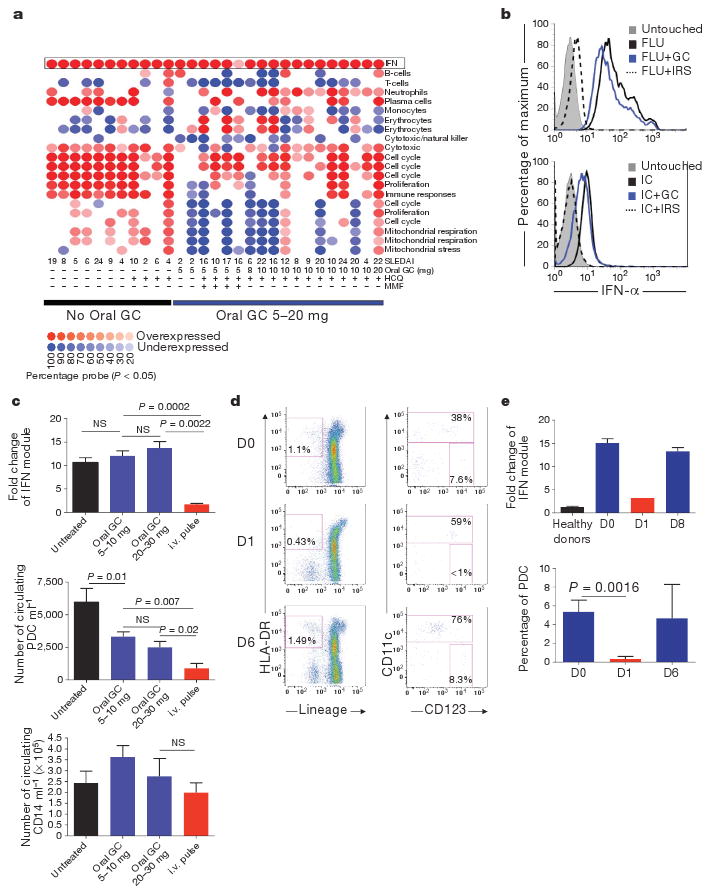
a, Module level analysis from whole blood from 29 SLE patients with (n = 18) or without (n = 11) oral glucocorticoid (GC) treatment as described10. Disease activity index (SLEDAI) and therapy used are indicated at the bottom. HCQ, hydroxychloroquine; MMF, mycophenolate mofetil. b, Purified PDCs were grown alone or with Flu or purified anti-RNP-IC either alone or with glucocorticoids (10−5 M) or IRS and assayed for IFN-α secretion at 3 h. c, Top panel: interferon module expression levels (average from transcripts within the IFN module displayed in a) in SLE patients untreated (n = 30), on 5–10 mg (n = 29) or on 20–30 mg (n = 6) daily oral Prednisone and on intravenous (i.v.) methylprednisolone pulse (three consecutive doses, n = 6). Middle and lower panels: blood PDC and monocyte numbers in SLE patients untreated (n = 13), on 5–10 mg daily oral glucocorticoids (n = 27), oral daily glucocorticoids 20–30 mg (n = 16) and the day after intravenous pulse (n = 6). NS, not significant. d, Representative flow cytometry analysis of PDCs before and 1 and 6 days after intravenous pulse. e, Top: quantification of the average interferon module level expression (Nanostring, see Supplementary Fig. 1) in healthy controls (n = 9), SLE patients before intravenous pulse (n = 26) and at day 1 (n = 1) and day 8 after the pulse (n = 2). Bottom: PDCs frequency in the CD11c population patients before intravenous pulse (D0, n = 10) and at day 1 (n = 9) and day 6 after pulse (n = 2). Data are plotted as mean ± s.e.m.
In contrast, intravenous pulse therapy can normalize the IFN signature (Fig. 1a, c). This correlates with a reduction in PDCs (Fig. 1c) but not other cells, such as CD14+ monocytes, in the blood (Fig. 1c). Similar reduction of PDCs is observed in healthy donors but at much lower glucocorticoid doses (15 mg day−1)12, indicating that continuous triggering of TLR7 and 9 on PDCs by immune complexes in SLE patients counteracts the activity of glucocorticoids on the IFN pathway. The partial reduction in PDC numbers with oral glucocorticoid treatment did not significantly affect IFN module expression, which includes 36 type-I-IFN-inducible transcripts. The inhibition of the IFN-signature by pulse therapy is transient, returning to pre-pulse levels by day 8 (Fig. 1e and Supplementary Fig. 1b). Similarly, the number of PDCs is markedly reduced 1 day after pulse therapy but rebounds by day 6 (Fig. 1d, e).
Glucocorticoids induce apoptosis in many cell types13, including PDCs, where TLR signalling confers partial protection14. Freshly isolated PDCs from healthy donors stimulated with TLR7 or TLR9 ligands were protected from glucocorticoid-induced cell death (Fig. 2a and Supplementary Fig. 2a, b). This dose-dependent protection correlated with the production of IFN-α by PDCs (Supplementary Fig. 2b) supporting our data at a single cell level (Fig. 1b). Blocking this pathway with IRS 954 (ref. 11) restored glucocorticoid sensitivity to PDCs in vitro (Fig. 2a, b) although IRS 954 itself was not cytotoxic (Supplementary Fig. 2c). Likewise, RNP-associated immune complex (RNP-IC) from SLE patients protected PDCs (Fig. 2a), a finding directly relevant to SLE. Type I IFNs were not required for protection by TLR7 and 9 ligands as neutralizing antibodies for type I IFN did inhibit protection (Fig. 2b) and IRS-mediated cell death was not reversed by exogenous IFN-α (Fig. 2b). Thus signalling through TLR7 or TLR9 protects human PDCs from glucocorticoid-induced cell death.
Figure 2. Glucocorticoids do not affect viability of TLR7- and TLR9-activated PDCs because of its lack of activity on TLR-induced NF-κB activation.
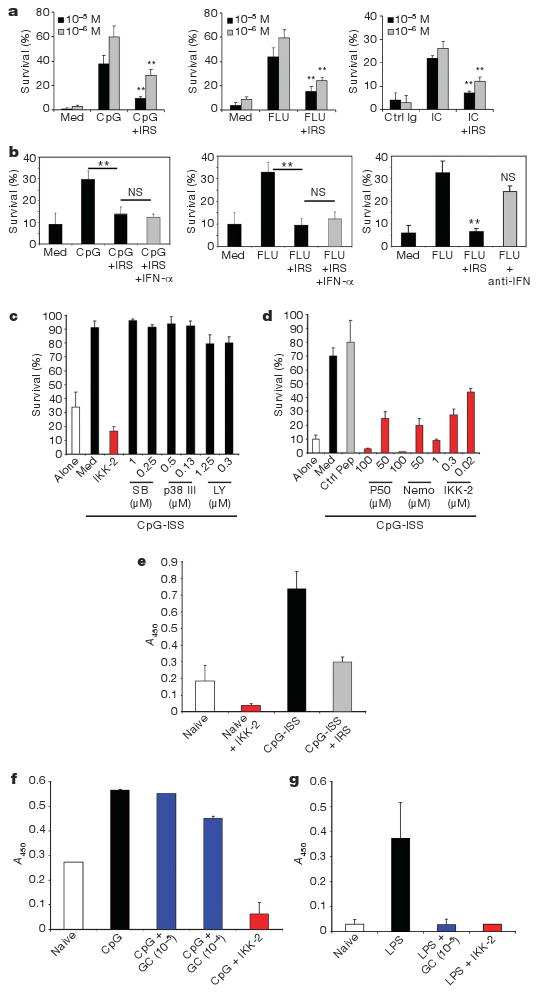
a–d, Purified PDCs were grown in medium (Med) or as indicated and viability was assessed after 24 h. a, Average of 6–12 independent donors is shown ± s.e.m. ** P ≤ 0.01. TLRL (TLR ligand) alone versus grown with IRS. b, PDCs were grown with glucocorticoids (10−5 M) either alone or as indicated. Average of 5–8 independent donors ± s.e.m. c, d, PDCs were grown with CpG-C either alone or with inhibitors of p38 MAPK (SB, SB203580), PI-3 kinase (LY, LY294002)or NF-κB (IKK-2 IV, p50 or NEMO inhibitory peptides). Average of 6–8 independent donors ± s.e.m. is shown. e–g, Nuclear extracts from purified PDCs (e, f) or monocytes (g) were prepared following cultures as indicated and the transcriptional activity of NF-κB was assessed. IKK-2 was used at 0.5 μM. Data are shown as OD values based on absorbance at 450 nm (mean ± s.e.m.) of at least four independent experiments.
The signalling pathway of TLR-mediated PDC survival was examined with specific inhibitors of molecules involved in TLR signalling: phosphatidylinositol-3-OH (PI-3) kinase, p38 mitogen-activated protein kinase (MAPK) and NF-κB15,16. Inhibitors of NF-κB, but not of p38 or PI-3 kinase blocked PDC survival induced by stimulation through TLR9 (Fig. 2c) and TLR7 (not shown). We confirmed this with three different NF-κB inhibitors (Fig. 2d). Exogenous IFN-α had no effect as well (Supplementary Fig. 2e). Increased NF-κB transcriptional activity was observed in TLR9-stimulated PDCs relative to unstimulated cells (Fig. 2e). Although glucocorticoids can inhibit NF-κB in many cellular systems (Fig. 2g and ref. 5), we observed no inhibition of NF-κB measured by DNA-binding activity (Fig. 2f) or p65 phosphorylation after TLR7/9 triggering in PDCs (Supplementary Fig. 3a, b). The inability of glucocorticoids to interfere with the NF-κB pathway in PDCs may explain why TLR-activated PDCs are resistant to glucocorticoid-mediated death.
We next investigated the effect of glucocorticoids on PDCs in mouse models in vivo. In normal mice, PDCs were extremely sensitive to glucocorticoid treatment and promptly disappeared from blood (Fig. 3a) and spleen (Fig. 3b). Other TLR9+ cell types, including conventional dendritic cells (cDC) (CD11c+) and B cells (B220+) were similarly reduced (Fig. 3a, b). In contrast, neutrophils (GR1+) were not responsive to glucocorticoid treatment, consistent with observations that glucocorticoids promote survival, not death, of human neutrophils in vitro17. TLR9 activation in vivo with CpG-ISS afforded significant protection from glucocorticoid-induced cell death to conventional and PDCs in both spleen and blood (Fig. 3c, d). Splenic B cells were similarly protected from death by TLR9 activation, but circulating blood B cells were not (Fig. 3c, d). Co-injection of IRS prevented CpG-ISS-induced activation (Supplementary Fig. 4), resulting in increased glucocorticoid-induced cell death in both blood and spleen (Fig. 3c, d). Thus, naive circulating PDCs are significantly more susceptible to glucocorticoid-induced cell death than TLR-activated PDCs in vivo.
Figure 3. TLR9 activation in vivo renders PDCs more resistant to glucocorticoid treatment.
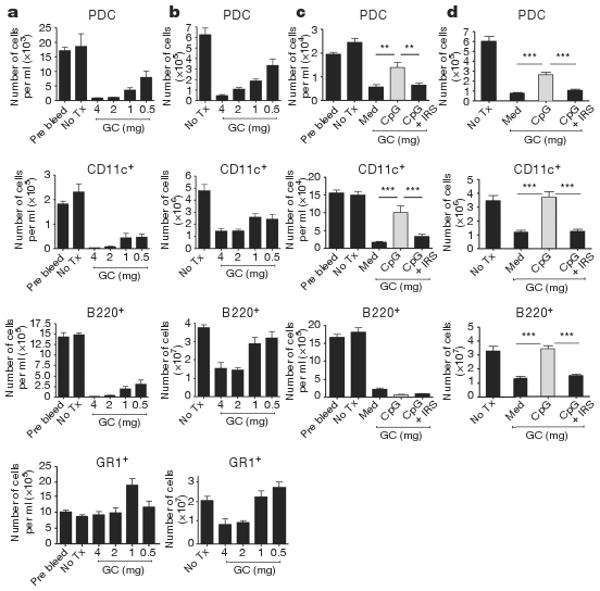
a, b,129 mice had no treatment (No Tx) or were injected with graded doses of dexamethasone and cells prepared from blood (a) or spleens (b) after 18 h. In blood (a), data are expressed as number of cells per ml of blood and as total number of cells in spleens (b). n = 6 mice per group. c, d, 129 mice were either left untreated or treated with 1 mg dexamethasone alone or in the presence of either CpG-C ISS (50 μg per mouse) or with CpG-C ISS plus IRS (100 μg per mouse). Number of cells per ml in blood is shown in (c) and total number of cells in spleen is shown in (d). Cumulative data of two independent experiments; n = 8 mice per group is shown. Plotted data represent averages ± s.e.m. ** P ≤ 0.01, *** P ≤ 0.001.
We studied this phenomenon in a disease model using the lupus-prone mouse strains(NZB×NZW)F1andTLR7.Tg.6.The(NZB×NZW)F1 mice spontaneously develop a disease resembling human SLE with increased nucleic-acid-containing immune complexes. Type I IFNs are associated with development of disease18–21 and blocking TLR7 and 9 reduced autoantibody titres and end-organ damage22. The TLR7.Tg.6 strain displays increased TLR7 expression, accumulation of anti-RNA autoantibodies, upregulation of type I IFN gene signature and an autoimmune syndrome resembling human SLE23. Both strains are models of spontaneous autoimmunity due to recognition of endogenous nucleic acids by TLR7 and 9 as in SLE patients.
Confirming our hypothesis, TLR7 and 9 bearing cells such as PDCs, cDCs and B cells were significantly more resistant to glucocorticoid-induced death in lupus-prone mice compared to normal strains such as 129 or C57BL/6, in which 0.5 mg glucocorticoids induced a 50–75% reduction in live PDCs (Fig. 4a, b). In both lupus strains, as in SLE patients, chronically activated cells thus have a reduced response to glucocorticoid treatment. Blocking TLR7 and 9 in vivo with IRS 954 enhanced the sensitivity to glucocorticoids of PDCs, cDCs and B cells in both spleen (Fig. 4c, d) and blood (Supplementary Fig. 5a, b). The expansion of neutrophils after glucocorticoid treatment (Supplementary Fig. 5a, b) is consistent with the expansion of granulocytes in mice and humans following glucocorticoid administration12,24–26 and with the persistence of a low density neutrophil gene signature after high dose steroids in SLE patients27. Interestingly, we observed a reduction of the glucocorticoid-induced neutrophil expansion after IRS administration (Supplementary Fig. 5a, b) perhaps indicating that blocking TLR7 and 9 could have an impact on the dysregulated granulopoiesis in SLE. Inhibition of TLR7 and 9 was similar in both lupus-prone mouse strains and specific for nucleic acid-induced inflammation as (1) IRS do not induce cell death without glucocorticoids (Supplementary Fig. 6a, b), (2) blocking TLR7 and 9 has no effect on PDCs in normal mice injected with glucocorticoids (Supplementary Fig. 6c) and (3) PDCs from young (NZB×NZW) F1 mice (before disease onset) were more sensitive to glucocorticoids than PDCs from older mice (Supplementary Fig. 6d). The increased glucocorticoid activity in mice pre-treated with IRS was significant at glucocorticoid doses that had no effect on PDC survival in normal mice (Supplementary Fig. 7a). These findings support the hypothesis that innate inflammation through self nucleic acid recognition is a dominant feature in the unresponsiveness of SLE patients to glucocorticoid treatment. As observed in human SLE, type I IFN-regulated genes are stimulated to some extent in both (NZB×NZW)F1 and TLR7.Tg.6 model18,23. In both lupus-prone strains, IRS pre-treatment reduced the expression of IFN-regulated genes but not TNF-α (Supplementary Fig. 7b, c), demonstrating that activation through TLR7 and 9 is central to inflammation in these mice.
Figure 4. PDCs from lupus-prone mice have intrinsic resistance to glucocorticoid-induced cell death compared to normal mice because of TLR7 and 9 activation by self-nucleic acid.
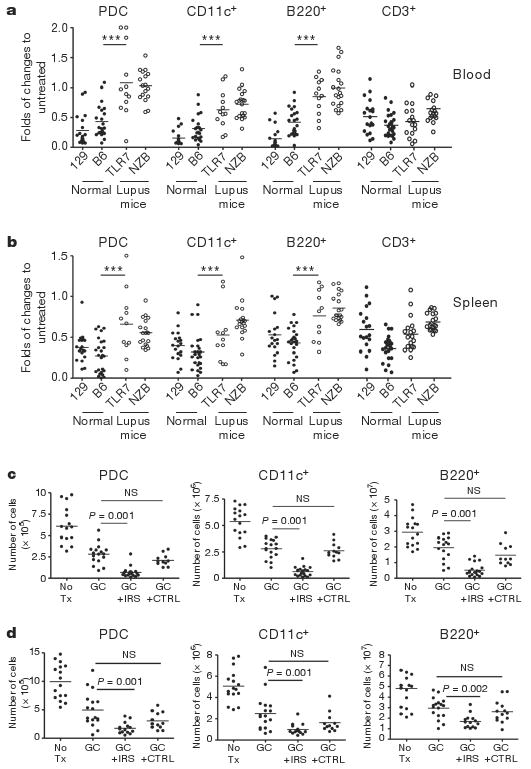
a, b, Normal (closed symbols) and lupus-prone (open symbols) animals were either left untreated or treated with dexamethasone (GC). Cell numbers in blood (a, fold change to pre-bleed) and spleens (b, fold change to untreated) was assessed 18 h later. Cumulative data of at least three independent experiments is shown. *** P ≤ 0.001 indicate differences between both lupus strains from either normal strains. 129 and B6, normal mice; TLR7 and NZB, lupus-prone mice. c, d, (NZB×NZW)F1 and TLR7.Tg.6 mice (c and d, respectively) were left untreated or treated with glucocorticoids alone or in the presence of IRS or control (CTRL) ODN (100 μg per mouse sub-cutaneously) given every 3 days for 10 days before the glucocorticoid treatment. Viability was assessed in the spleen 18 h after DEX. Cumulative data of two independent experiments is shown.
SLE is a complex autoimmune disease and the evaluation of new drugs has proven difficult even for therapeutics approved for other autoimmune diseases. The possibility to reduce glucocorticoid doses in patients while maintaining its cytotoxic activity on PDCs offers significant promise. We show here that the chronic stimulation of PDCs through TLR7 and 9 by circulating self nucleic acid-containing autoantibodies results in the induction of type I IFN, but additionally in the reduced therapeutic activity of glucocorticoids. This provides novel understanding of the role of self recognition of DNA and RNA by TLR as an important inflammatory amplifier in SLE. These data also stress the potential use of bi-functional TLR7 and 9 inhibitors such as IRS as corticosteroid-sparing drugs.
Methods Summary
Reagents
Phosphorothioate oligodeoxynucleotides (ODNs) (CpG-C ISS (C274) as TLR9 ligand and IRS 954 as inhibitor of TLR7 and TLR9, ref. 11) were prepared as described previously28. Heat-inactivated influenza virus (H1N1, strain A/PR/8/34) was obtained from ATCC. Hydrocortisone and dexthametasone (DEX) were purchased from Sigma. Purification of anti-RNP immune complex was performed as described previously11.
Patients and healthy donors
Paediatric patients were recruited at Baylor University Medical Center, Texas Scottish Rite Hospital, and Children's Medical Center, all in Dallas, Texas, USA. The study was approved by the institutional review board of all three institutions. Informed consents were obtained from all patients (legal representatives and patients over 10 years of age). The demographic characteristics of 71 SLE patients are displayed in Supplementary Table 2. Blood samples were analysed by flow cytometry using standard techniques.
A set of transcriptional modules (Supplementary Table 1) was used as a framework for the analysis of microarray data as reported previously10. In some cases, we used the nCounter Analysis System (NanoString Technologies) as described previously29.
Isolation and in vitro stimulation of purified PDCs and measurement of cell survival
Buffy coats were obtained from the Stanford Blood Center and cells were used under internal Institutional Review Board-approved protocols. PDCs were isolated as previously described30. For assessing the viability of PDCs, we used flow cytometry and the Invitrogen “live or dead cell viability kit” according to manufacturer instructions.
Treatment of mice and cellular analysis
Mice used were 8–12-weeks-old C57BL/6 and 129 mice as well as 16–17-weeks-old (NZB×NZW)F1 female and the recently described TLR7.6 transgenic mice overexpressing TLR7 (ref. 23) used at 8 weeks of age. Mice were analysed after 18 h from DEX administration by flow cytometry using standard techniques and gene expression was performed using real-time quantitative PCR (TaqMan) analysis.
Supplementary Material
Supplementary Figure 1: Transient levels of the PDC-induced IFN signature in GC-treated SLE patients.
(A) Purified human PDC were cultured alone or in the presence of Flu (2 MOI) or purified anti-RNP IC isolated from SLE patients either alone or combined with GC (10-5M or 10-6M or IRS (0.5 μM). After 3 hr, cells were assayed for IFN-α secretion and cumulative data of five donors shown as MFI (mean ± standard error of the mean). (B) Nanostring nCounter system was used to assess the longitudinal blood gene expression levels in healthy donors and SLE patients. Probes corresponding to 12 IFN-inducible genes were included in Nanostring codeset (see supplemental table 1). Gene expression levels were normalized to control genes and to healthy donors. Heatmap (log 2 scale) corresponding to 8 SLE patient longitudinal samples (individual columns) is shown. Samples corresponding to patients SLE184, 190, 212, 252, 133 and 231 were obtained at 2-3 month intervals. These patients were receiving oral GC but no IV Methylprednisolone pulses. SLE 242 was analyzed the day before an IV pulse, 8 days after 2 independent IV pulses (marked as ∇), and 2 additional times while on oral GC. SLE 249 was analyzed the day before and the day after an IV pulse (marked as *), and two additional times while on oral GC. Only the day after IV pulse there was a decrease in the expression levels of IFN-inducible genes. Red: over expression. Blue: under expression.
Supplementary Figure 2: TLR-induced signal protect PDC from GC-induced cell death. IRS inhibits IFN-α production in TLR7/9 stimulated human PDC but does not induce cell death and exogenous IFN-α does not rescue PDC in absence of NF-kB activation.
(A) Purified human PDC were cultured with CpG-C ISS (0.5 μM), IL-3 (5 ng/ml), TNF-α (20 ng/ml), IL-7 (10 ng/ml), FTL-3L (10 ng/ml) alone (white bar) or in the presence of GC (10-5M) (black bar). Viability was assessed after 24 hr. Average of 10 (left panel) and 13 (right panel) independent donors ± standard error of the mean in five independent experiments is shown ** p≤ 0.01, *** p≤ 0.001. P values are between CpG + GC and cytokines + GC groups. (B) Purified human PDC were cultured with CpG-C ISS (0.5 μM), Flu (2 MOI) either alone or in combination with various concentration of GC. Viability and production of IFN-α was assessed after 24 hr. Average of 10 independent donors is shown. (C, D) Purified PDC were cultured with CpG-C ISS (0.5 μM), Flu (2 MOI) or RNP-IC (0.5 mg/ml) either alone or in the presence of IRS (1μM) (C) Viability was assessed after 24 hr. (D) IFN-α was measured by ELISA. Cumulative data of three independent experiments is shown. _n_=10. (E) Purified PDC were cultured with CpG-C ISS (0.5 μM) with or without soluble IFN-α (20 ng/ml) either alone or in the presence of the NF-kB inhibitor IKK-2 at the indicated concentrations. Viability was assessed after 24 hr. Average ± standard error of the mean of 10 independent donors is shown.
Supplementary Figure 3: GC do not affect TLR-induced p65 phosphorylation in PDC
Negatively purified PDC were either left untreated or cultured with CpG-C ISS (0.5 μM) (A), Flu (2 MOI) (B) either alone or in the presence of GC (10-5M) or NF-kB inhibitor IKK-2 (0.5 μM) for 90 min after which cells were fixed immediately permabilized with PermBuffer III for 30 minutes on ice and stained with either Alexa-647 anti-human NF-kB p65 (pS529) (BD bioscience) and then analyzed by flow cytometry. Representative histograms of at least three separate experiments.
Supplementary Figure 4: IRS significantly reduce CpG-C ISS-mediated induction of cytokines in vivo
129 mice were either left untreated or treated with CpG-C ISS (50 μg/mice) alone or with IRS (50 μg/mice) and serum was collected 6 hr later. IFN-α and IL-6 was evaluated by ELISA. _n_=6 mice per group ± standard error of the mean.
Supplementary Figure 5: Increased resistance of PDC in lupus-prone mice is due to TLR7&9 stimulation
(A) (NZB×NZW)F1 and (B) TLR7.Tg.6 mice were left untreated or treated with GC (0.5 mg) alone or with IRS. IRS (100 μg/mice s.c.) was administered every 3 days for 10 days prior to the GC treatment. Viability of the different cell subsets was assessed 18 hr after the injection of GC. Data refers to cell number/ml in the blood. Cumulative data ± standard error of the mean of two independent experiments n= 8-12 mice/group.
Supplementary Figure 6: Treatment of lupus-prone mice with TLR inhibitors does not affect viability in vivo in absence of GC in lupus-prone mice and does not have any effect on GC-treated WT mice. Resistance of PDC to GC-induced cell death in lupus mice require cellular activation.
(A) (NZB×NZW)F1 or (B) TLR7.Tg.6 were either left untreated or treated every 3 days for 10 days with IRS (100 μg/mice s.c.) and the cell number was measured by flow cytometry in the spleen 18 hr after last IRS administration. Data refers to the average ± standard error of the mean of the total cell number in spleens _n_=6 mice per group. Similar data were obtained in the blood stream (not shown). (C) 129 mice were left untreated or treated with GC 0.5 mg or GC plus IRS (100 μg/mice s.c.) as described in figure 4. Viability of PDC was assessed 18 hr after the injection of GC. _n_=6 mice per group. (D) 129 or the (NZB×NZW)F1 lupus-prone animals (3 weeks or 16 weeks old) were either left untreated or treated with GC as in figure 4. Here, the dose of GC was adjusted based on weight of mice and 3 weeks old mice received 0.25 mg while adult mice received 0.5 mg. PDC cell numbers in blood and spleens was assessed 18 hr later. Data are expressed as fold of change to untreated mice for each mouse.
Supplementary Figure 7: Treatment of lupus-prone mice with TLR inhibitors reduces levels of IFN-inducible genes
(A) (NZB×NZW)F1 mice were treated as described in figure 4 but when mice received IRS, we used different doses of GC (in mg per mouse here) (B) (NZB×NZW)F1 and (C) TLR7.Tg.6 mice were left untreated or treated with IRS (100 μg/mice s.c) every 3 days for 10 days and spleens were harvested 18 hr after the last IRS injection. RNA was prepared from the spleens of the animals and the levels of type I IFN-regulated genes were measured by quantitative analysis (Taqman). Averages ± standard error of the mean for _n_=6-10 mice per group.
Supplementary Table 1: IFN Module Gene list
Supplementary Table 2: Patient information
Acknowledgments
We would like to thank A. O'Garra, G. Trinchieri, J.-L. Casanova and our colleagues at Dynavax Technologies for their critical reading of the manuscript. We thank S. Noonan and H. Lopez (Murigenics) for invaluable assistance with animal work. This work was supported by NIH grants P50-ARO54083-01CORT, U19-AI082715-01, The Alliance for Lupus Research, The Mary Kirkland Foundation (to V.P.) and SBIR grant 2R44AI066483-02 (to R.L.C.).
Footnotes
Author Contributions: C.G. and F.J.B. designed the study; C.G., M.Go., Z.X., M.Gi., T.M. and J.H.C. performed experiments; D.C., V.P., C.G. and F.J.B. collected and analysed data; S.B. provided the mice; T.W. and M.P. followed the cohort of patients and provided clinical samples; C.G., Z.X., R.L.C., V.P. and F.J.B wrote the manuscript; V.S., J.B. and R.L.C. gave conceptual advice.
Author Information Reprints and permissions information is available at www.nature.com/reprints. The authors declare competing financial interests: details accompany the full-text HTML version of the paper at www.nature.com/nature. Readers are welcome to comment on the online version of this article at www.nature.com/nature.
References
- 1.Hahn BH. Antibodies to DNA. N Engl J Med. 1998;338:1359–1368. doi: 10.1056/NEJM199805073381906. [DOI] [PubMed] [Google Scholar]
- 2.Chatham WW, Kimberly RP. Treatment of lupus with corticosteroids. Lupus. 2001;10:140–147. doi: 10.1191/096120301675075008. [DOI] [PubMed] [Google Scholar]
- 3.Franchin G, Diamond B. Pulse steroids: how much is enough? Autoimmun Rev. 2006;5:111–113. doi: 10.1016/j.autrev.2005.08.003. [DOI] [PubMed] [Google Scholar]
- 4.Parker BJ, Bruce IN. High dose methylprednisolone therapy for the treatment of severe systemic lupus erythematosus. Lupus. 2007;16:387–393. doi: 10.1177/0961203307079502. [DOI] [PubMed] [Google Scholar]
- 5.De Bosscher K, Vanden Berghe W, Haegeman G. The interplay between the glucocorticoid receptor and nuclear factor-κB or activator protein-1: molecular mechanisms for gene repression. Endocr Rev. 2003;24:488–522. doi: 10.1210/er.2002-0006. [DOI] [PubMed] [Google Scholar]
- 6.Barrat FJ, Coffman RL. Development of TLR inhibitors for the treatment of autoimmune diseases. Immunol Rev. 2008;223:271–283. doi: 10.1111/j.1600-065X.2008.00630.x. [DOI] [PubMed] [Google Scholar]
- 7.Banchereau J, Pascual V. Type I interferon in systemic lupus erythematosus and other autoimmune diseases. Immunity. 2006;25:383–392. doi: 10.1016/j.immuni.2006.08.010. [DOI] [PubMed] [Google Scholar]
- 8.Wenzel J, Tüting T. An IFN-associated cytotoxic cellular immune response against viral, self-, or tumor antigens is a common pathogenetic feature in “interface dermatitis”. J Invest Dermatol. 2008;128:2392–2402. doi: 10.1038/jid.2008.96. [DOI] [PubMed] [Google Scholar]
- 9.Tucci M, et al. Glomerular accumulation of plasmacytoid dendritic cells in active lupus nephritis: role of interleukin-18. Arthritis Rheum. 2008;58:251–262. doi: 10.1002/art.23186. [DOI] [PubMed] [Google Scholar]
- 10.Chaussabel D, et al. A modular analysis framework for blood genomics studies: application to systemic lupus erythematosus. Immunity. 2008;29:150–164. doi: 10.1016/j.immuni.2008.05.012. [DOI] [PMC free article] [PubMed] [Google Scholar]
- 11.Barrat FJ, et al. Nucleic acids of mammalian origin can act as endogenous ligands for Toll-like receptors and may promote systemic lupus erythematosus. J Exp Med. 2005;202:1131–1139. doi: 10.1084/jem.20050914. [DOI] [PMC free article] [PubMed] [Google Scholar]
- 12.Shodell M, Shah K, Siegal FP. Circulating human plasmacytoid dendritic cells are highly sensitive to corticosteroid administration. Lupus. 2003;12:222–230. doi: 10.1191/0961203303lu362xx. [DOI] [PubMed] [Google Scholar]
- 13.Montague JW, Cidlowski JA. Glucocorticoid-induced death of immune cells: mechanisms of action. Curr Top Microbiol Immunol. 1995;200:51–65. doi: 10.1007/978-3-642-79437-7_4. [DOI] [PubMed] [Google Scholar]
- 14.Boor PP, et al. Prednisolone suppresses the function and promotes apoptosis of plasmacytoid dendritic cells. Am J Transplant. 2006;6:2332–2341. doi: 10.1111/j.1600-6143.2006.01476.x. [DOI] [PubMed] [Google Scholar]
- 15.Takauji R, et al. CpG-DNA-induced IFN-α production involves p38 MAPK-dependent STAT1 phosphorylation in human plasmacytoid dendritic cell precursors. J Leukoc Biol. 2002;72:1011–1019. [PubMed] [Google Scholar]
- 16.Guiducci C, et al. PI3K is critical for the nuclear translocation of IRF-7 and type I IFN production by human plasmacytoid predendritic cells in response to TLR activation. J Exp Med. 2008;205:315–322. doi: 10.1084/jem.20070763. [DOI] [PMC free article] [PubMed] [Google Scholar]
- 17.Strickland I, et al. High constitutive glucocorticoid receptor β in human neutrophils enables them to reduce their spontaneous rate of cell death in response to corticosteroids. J Exp Med. 2001;193:585–594. doi: 10.1084/jem.193.5.585. [DOI] [PMC free article] [PubMed] [Google Scholar]
- 18.Rozzo SJ, et al. Evidence for an interferon-inducible gene, Ifi202, in the susceptibility to systemic lupus. Immunity. 2001;15:435–443. doi: 10.1016/s1074-7613(01)00196-0. [DOI] [PubMed] [Google Scholar]
- 19.Santiago-Raber ML, et al. Type-I interferon receptor deficiency reduces lupus-like disease in NZB mice. J Exp Med. 2003;197:777–788. doi: 10.1084/jem.20021996. [DOI] [PMC free article] [PubMed] [Google Scholar]
- 20.Mathian A, Weinberg A, Gallegos M, Banchereau J, Koutouzov S. IFN-α induces early lethal lupus in preautoimmune (New Zealand Black × New Zealand White)F1 but not in BALB/c mice. J Immunol. 2005;174:2499–2506. doi: 10.4049/jimmunol.174.5.2499. [DOI] [PubMed] [Google Scholar]
- 21.Agrawal H, et al. Deficiency of type I IFN receptor in lupus-prone New Zealand mixed 2328 mice decreases dendritic cell numbers and activation and protects from disease. J Immunol. 2009;183:6021–6029. doi: 10.4049/jimmunol.0803872. [DOI] [PMC free article] [PubMed] [Google Scholar]
- 22.Barrat FJ, Meeker T, Chan JH, Guiducci C, Coffman RL. Treatment of lupus-prone mice with a dual inhibitor of TLR7 and TLR9 leads to reduction of autoantibody production and amelioration of disease symptoms. Eur J Immunol. 2007;37:3582–3586. doi: 10.1002/eji.200737815. [DOI] [PubMed] [Google Scholar]
- 23.Deane JA, et al. Control of Toll-like receptor 7 expression is essential to restrict autoimmunity and dendritic cell proliferation. Immunity. 2007;27:801–810. doi: 10.1016/j.immuni.2007.09.009. [DOI] [PMC free article] [PubMed] [Google Scholar]
- 24.Athens JW, et al. Leukokinetic studies. IV. The total blood, circulating and marginal granulocyte pools and the granulocyte turnover rate in normal subjects. J Clin Invest. 1961;40:989–995. doi: 10.1172/JCI104338. [DOI] [PMC free article] [PubMed] [Google Scholar]
- 25.Laakko T, Fraker P. Rapid changes in the lymphopoietic and granulopoietic compartments of the marrow caused by stress levels of corticosterone. Immunology. 2002;105:111–119. doi: 10.1046/j.1365-2567.2002.01346.x. [DOI] [PMC free article] [PubMed] [Google Scholar]
- 26.Trottier MD, Newsted MM, King LE, Fraker PJ. Natural glucocorticoids induce expansion of all developmental stages of murine bone marrow granulocytes without inhibiting function. Proc Natl Acad Sci USA. 2008;105:2028–2033. doi: 10.1073/pnas.0712003105. [DOI] [PMC free article] [PubMed] [Google Scholar]
- 27.Bennett L, et al. Interferon and granulopoiesis signatures in systemic lupus erythematosus blood. J Exp Med. 2003;197:711–723. doi: 10.1084/jem.20021553. [DOI] [PMC free article] [PubMed] [Google Scholar]
- 28.Duramad O, et al. Inhibitors of TLR-9 act on multiple cell subsets in mouse and man in vitro and prevent death in vivo from systemic inflammation. J Immunol. 2005;174:5193–5200. doi: 10.4049/jimmunol.174.9.5193. [DOI] [PubMed] [Google Scholar]
- 29.Geiss GK, et al. Direct multiplexed measurement of gene expression with color-coded probe pairs. Nature Biotechnol. 2008;26:317–325. doi: 10.1038/nbt1385. [DOI] [PubMed] [Google Scholar]
- 30.Guiducci C, et al. Properties regulating the nature of the plasmacytoid dendritic cell response to Toll-like receptor 9 activation. J Exp Med. 2006;203:1999–2008. doi: 10.1084/jem.20060401. [DOI] [PMC free article] [PubMed] [Google Scholar]
Associated Data
This section collects any data citations, data availability statements, or supplementary materials included in this article.
Supplementary Materials
Supplementary Figure 1: Transient levels of the PDC-induced IFN signature in GC-treated SLE patients.
(A) Purified human PDC were cultured alone or in the presence of Flu (2 MOI) or purified anti-RNP IC isolated from SLE patients either alone or combined with GC (10-5M or 10-6M or IRS (0.5 μM). After 3 hr, cells were assayed for IFN-α secretion and cumulative data of five donors shown as MFI (mean ± standard error of the mean). (B) Nanostring nCounter system was used to assess the longitudinal blood gene expression levels in healthy donors and SLE patients. Probes corresponding to 12 IFN-inducible genes were included in Nanostring codeset (see supplemental table 1). Gene expression levels were normalized to control genes and to healthy donors. Heatmap (log 2 scale) corresponding to 8 SLE patient longitudinal samples (individual columns) is shown. Samples corresponding to patients SLE184, 190, 212, 252, 133 and 231 were obtained at 2-3 month intervals. These patients were receiving oral GC but no IV Methylprednisolone pulses. SLE 242 was analyzed the day before an IV pulse, 8 days after 2 independent IV pulses (marked as ∇), and 2 additional times while on oral GC. SLE 249 was analyzed the day before and the day after an IV pulse (marked as *), and two additional times while on oral GC. Only the day after IV pulse there was a decrease in the expression levels of IFN-inducible genes. Red: over expression. Blue: under expression.
Supplementary Figure 2: TLR-induced signal protect PDC from GC-induced cell death. IRS inhibits IFN-α production in TLR7/9 stimulated human PDC but does not induce cell death and exogenous IFN-α does not rescue PDC in absence of NF-kB activation.
(A) Purified human PDC were cultured with CpG-C ISS (0.5 μM), IL-3 (5 ng/ml), TNF-α (20 ng/ml), IL-7 (10 ng/ml), FTL-3L (10 ng/ml) alone (white bar) or in the presence of GC (10-5M) (black bar). Viability was assessed after 24 hr. Average of 10 (left panel) and 13 (right panel) independent donors ± standard error of the mean in five independent experiments is shown ** p≤ 0.01, *** p≤ 0.001. P values are between CpG + GC and cytokines + GC groups. (B) Purified human PDC were cultured with CpG-C ISS (0.5 μM), Flu (2 MOI) either alone or in combination with various concentration of GC. Viability and production of IFN-α was assessed after 24 hr. Average of 10 independent donors is shown. (C, D) Purified PDC were cultured with CpG-C ISS (0.5 μM), Flu (2 MOI) or RNP-IC (0.5 mg/ml) either alone or in the presence of IRS (1μM) (C) Viability was assessed after 24 hr. (D) IFN-α was measured by ELISA. Cumulative data of three independent experiments is shown. _n_=10. (E) Purified PDC were cultured with CpG-C ISS (0.5 μM) with or without soluble IFN-α (20 ng/ml) either alone or in the presence of the NF-kB inhibitor IKK-2 at the indicated concentrations. Viability was assessed after 24 hr. Average ± standard error of the mean of 10 independent donors is shown.
Supplementary Figure 3: GC do not affect TLR-induced p65 phosphorylation in PDC
Negatively purified PDC were either left untreated or cultured with CpG-C ISS (0.5 μM) (A), Flu (2 MOI) (B) either alone or in the presence of GC (10-5M) or NF-kB inhibitor IKK-2 (0.5 μM) for 90 min after which cells were fixed immediately permabilized with PermBuffer III for 30 minutes on ice and stained with either Alexa-647 anti-human NF-kB p65 (pS529) (BD bioscience) and then analyzed by flow cytometry. Representative histograms of at least three separate experiments.
Supplementary Figure 4: IRS significantly reduce CpG-C ISS-mediated induction of cytokines in vivo
129 mice were either left untreated or treated with CpG-C ISS (50 μg/mice) alone or with IRS (50 μg/mice) and serum was collected 6 hr later. IFN-α and IL-6 was evaluated by ELISA. _n_=6 mice per group ± standard error of the mean.
Supplementary Figure 5: Increased resistance of PDC in lupus-prone mice is due to TLR7&9 stimulation
(A) (NZB×NZW)F1 and (B) TLR7.Tg.6 mice were left untreated or treated with GC (0.5 mg) alone or with IRS. IRS (100 μg/mice s.c.) was administered every 3 days for 10 days prior to the GC treatment. Viability of the different cell subsets was assessed 18 hr after the injection of GC. Data refers to cell number/ml in the blood. Cumulative data ± standard error of the mean of two independent experiments n= 8-12 mice/group.
Supplementary Figure 6: Treatment of lupus-prone mice with TLR inhibitors does not affect viability in vivo in absence of GC in lupus-prone mice and does not have any effect on GC-treated WT mice. Resistance of PDC to GC-induced cell death in lupus mice require cellular activation.
(A) (NZB×NZW)F1 or (B) TLR7.Tg.6 were either left untreated or treated every 3 days for 10 days with IRS (100 μg/mice s.c.) and the cell number was measured by flow cytometry in the spleen 18 hr after last IRS administration. Data refers to the average ± standard error of the mean of the total cell number in spleens _n_=6 mice per group. Similar data were obtained in the blood stream (not shown). (C) 129 mice were left untreated or treated with GC 0.5 mg or GC plus IRS (100 μg/mice s.c.) as described in figure 4. Viability of PDC was assessed 18 hr after the injection of GC. _n_=6 mice per group. (D) 129 or the (NZB×NZW)F1 lupus-prone animals (3 weeks or 16 weeks old) were either left untreated or treated with GC as in figure 4. Here, the dose of GC was adjusted based on weight of mice and 3 weeks old mice received 0.25 mg while adult mice received 0.5 mg. PDC cell numbers in blood and spleens was assessed 18 hr later. Data are expressed as fold of change to untreated mice for each mouse.
Supplementary Figure 7: Treatment of lupus-prone mice with TLR inhibitors reduces levels of IFN-inducible genes
(A) (NZB×NZW)F1 mice were treated as described in figure 4 but when mice received IRS, we used different doses of GC (in mg per mouse here) (B) (NZB×NZW)F1 and (C) TLR7.Tg.6 mice were left untreated or treated with IRS (100 μg/mice s.c) every 3 days for 10 days and spleens were harvested 18 hr after the last IRS injection. RNA was prepared from the spleens of the animals and the levels of type I IFN-regulated genes were measured by quantitative analysis (Taqman). Averages ± standard error of the mean for _n_=6-10 mice per group.
Supplementary Table 1: IFN Module Gene list
Supplementary Table 2: Patient information