Novel common copy number variation for early onset extreme obesity on chromosome 11q11 identified by a genome-wide analysis (original) (raw)
Abstract
Heritability of obesity is substantial and recent meta-analyses of genome-wide association studies (GWASs) have been successful in detecting several robustly associated genomic regions for obesity using single-nucleotide polymorphisms (SNPs). However, taken together, the SNPs explain only a small proportion of the overall heritability. Copy number variations (CNVs) might contribute to the ‘missing heritability’. We searched genome-wide for association between common CNVs and early-onset extreme obesity. Four hundred and twenty-four case-parents obesity trios and an independent sample of 453 extremely obese children and adolescents and 435 normal-weight and lean adult controls were genotyped by the Affymetrix Genome-Wide Human SNP Array 6.0. We detected 20 common copy number variable regions (CNVRs) which were associated with obesity. The most promising CNVRs were followed-up in an independent sample of 365 obesity trios, confirming the association for two candidate CNVRs. We identified a common CNVR exclusively covering the three olfactory receptor genes OR4P4, OR4S2 and OR4C6 to be associated with obesity (combined _P_-value = 0.015 in a total of 789 families; odds ratio for the obesity effect allele = 1.19; 95% confidence interval = 1.016–1.394). We also replicated two common deletions (near NEGR1 and at chromosome 10q11.22) that have previously been reported to be associated with body weight. Additionally, we support a rare CNV on chromosome 16 that has recently been reported by two independent groups. However, rare CNVs had not been the focus of our study. We conclude that common CNVs are unlikely to contribute substantially to the genetic basis of early-onset extreme obesity.
INTRODUCTION
Obesity is a heritable complex trait (1,2). Genome-wide association studies (GWASs) led to the identification of various common single-nucleotide polymorphisms (SNPs) for human obesity (3–8). Although most of the results of GWASs have been highly reproducible, they explain only a minor fraction of the variance of body mass index (BMI) when compared with the total expected heritability of BMI [∼50%, (9)]. Hence, a substantial ‘missing heritability' (10) becomes obvious, which might in part be explained by copy number variants (CNVs). CNVs are by definition chromosomal regions with sizes of 1kb to several megabases (Mb) being interindividually present in variable numbers. At a genome-wide level, thousands of CNVs have already been identified. Owing to resolution of the current technology, most of these CNVs are >5 kb (11). The database of Genomic Variants (http://projects.tcag.ca/variation/) currently lists 57 829 CNVs at 14 478 CNV loci and half of these CNVs are of sizes from 1 to 10 kb. The frequency spectrum and the precise structure of CNVs are closely related to the technical and algorithmic methods applied (12,13). Specific CNVs have been related to a number of complex traits–examples are psoriasis (14), schizophrenia (15), autism (16), developmental disorders (17) or HIV1/AIDS susceptibility (18). In some instances, particular CNVs were related to certain disorders as de novo events [e.g. schizophrenia (15)].
Currently, two common CNV regions have been described for BMI and obesity. At first, association of a common deletion near the neuronal growth regulator 1 gene (NEGR1) with BMI was reported (8). Some CNVs are in strong linkage disequilibrium with adjacent SNPs; therefore, this CNV was detected in a meta-analysis of SNP data of 15 GWAS comprising more than 32 000 individuals. Recently, another common CNV (chromosome 10p11.22) was shown to be associated with BMI (19) in a Chinese sample (nominal _P_-value = 0.011).
In addition to these common CNVs, three recent reports (20–22) underlined the importance of rare, large CNVs for body weight regulation. Two of these studies (20,21) depicted a genomic region on chromosome 16p11.2 which harbours highly penetrant microdeletions (∼500 kb) associated with (extreme) obesity. This region was previously reported to be associated with autism and mental retardation (20,21,23); in fact, some of the obese patients analysed by Bochukova et al. (20) additionally had developmental disorders. However, the association of these microdeletions and obesity was also found in individuals ascertained for obesity only (21), suggesting a possible direct association of the deletions at 16p11.2 with obesity apart from the cognitive phenotype. Wang et al. (22) performed a genome-wide CNV survey focusing on large (>1 Mb) CNVs, which were found to be over-represented in case versus control subjects. However, to explain a substantial part of the ‘missing heritability’, thousands of such rare CNVs have to be assumed. Recent considerations (24,25) showed that even meta-analyses of large-scale consortia will be underpowered to detect most of these multiple, rare variants.
The potential of common CNVs has until recently (11,26) been largely neglected despite the fact that power issues to detect common CNVs will be less extreme when compared with rare CNVs. The main reason might be that samples have often been genotyped by arrays not designed for the detection of common CNVs. As an example, following recent reports (13), 44% of the common CNVs detectable by the more recent Affymetrix Genome-Wide Human SNP Array 6.0 would not have been detected by a previous Affymetrix chip (Affymetrix 500K Mapping Array Set).
Here we focus on common CNVs and report a genome-wide CNV detection and association analysis for early-onset extreme obesity using two GWAS discovery data sets (family-based and case–control, altogether 2160 genotyped individuals) and an additional replication sample of 365 independent obesity trios (Fig. 1).
Figure 1.

Study design to discover CNVRs associated with (early-onset extreme) obesity.
RESULTS
Genome-wide CNV analyses
We observed 244 autosomal common CNVRs; out of which 240 were at least partially listed in the Database of Genomic Variants (http://projects.tcag.ca/variation). The four yet-unknown CNVRs are positioned on chromosomes 1q25.1 (at position 173 063 167–173 068 476 bp, hg18), 3p12.1 (84 782 436–84 784 839 bp; hg18), 4q27 (122 501 906–122 504 445 bp; hg18) and 14q11.1 (18 072 112–18 183 975 bp; hg18). With an average and median size of 183.92 and 13.97 kb, respectively, these 244 common CNVRs cover 1.56% (44.88 Mb) of the human genome (Table 1).
Table 1.
Basic properties of all 244 inferred common CNVRs in our two discovery GWAS (family-based and case–control) samples
| Chromosome | Total number of CNVRs | Minimal size of CNVRs (kb) | Median size of CNVRs (kb) | Mean size of CNVRs (kb) | Maximal size of CNVRs (kb) | Minimal number of CNV markers per CNVR | Median number of CNV markers per CNVR | Mean number of CNV markers per CNVR | Maximal number of CNV markers per CNVR |
|---|---|---|---|---|---|---|---|---|---|
| 1 | 23 | 1.451 | 17.515 | 97.760 | 775.519 | 3 | 29 | 39.7 | 187 |
| 2 | 17 | 2.154 | 10.183 | 47.467 | 386.727 | 7 | 23 | 34.6 | 158 |
| 3 | 16 | 2.230 | 11.595 | 37.124 | 212.426 | 3 | 37 | 34.6 | 76 |
| 4 | 23 | 1.619 | 7.540 | 54.584 | 504.752 | 3 | 20 | 24.4 | 91 |
| 5 | 11 | 2.520 | 7.656 | 151.529 | 1440.276 | 6 | 18 | 18.9 | 52 |
| 6 | 12 | 4.137 | 18.423 | 33.696 | 123.822 | 3 | 22 | 33.2 | 106 |
| 7 | 18 | 0.183 | 12.632 | 34.166 | 170.721 | 3 | 21 | 21.8 | 44 |
| 8 | 18 | 0.202 | 8.552 | 105.523 | 829.942 | 3 | 23 | 37.8 | 188 |
| 9 | 10 | 2.333 | 77.910 | 2514.878 | 20 528.869 | 3 | 12 | 35.6 | 156 |
| 10 | 13 | 0.228 | 10.488 | 106.870 | 570.609 | 3 | 27 | 33.7 | 161 |
| 11 | 5 | 9.682 | 21.760 | 31.977 | 79.570 | 15 | 46 | 40.6 | 58 |
| 12 | 13 | 1.739 | 5.994 | 25.991 | 115.563 | 4 | 22 | 22.1 | 41 |
| 13 | 6 | 0.254 | 9.287 | 10.321 | 20.136 | 4 | 17.5 | 18.7 | 37 |
| 14 | 8 | 19.882 | 52.329 | 173.045 | 1007.047 | 9 | 18.5 | 37.5 | 147 |
| 15 | 11 | 4.290 | 43.871 | 220.162 | 1768.491 | 3 | 21 | 59.7 | 371 |
| 16 | 8 | 12.351 | 35.853 | 298.688 | 1778.141 | 5 | 24.5 | 70.9 | 283 |
| 17 | 6 | 9.933 | 83.082 | 148.805 | 585.266 | 5 | 26 | 38.7 | 129 |
| 18 | 5 | 1.224 | 3.084 | 3.416 | 6.489 | 4 | 19 | 17.0 | 25 |
| 19 | 9 | 0.570 | 12.381 | 42.795 | 165.484 | 4 | 13 | 22.1 | 62 |
| 20 | 2 | 3.049 | 19.867 | 19.867 | 36.685 | 26 | 44 | 44.0 | 62 |
| 21 | 4 | 3.389 | 25.750 | 82.108 | 273.541 | 4 | 9 | 24.5 | 76 |
| 22 | 6 | 1.675 | 43.806 | 71.533 | 204.480 | 3 | 22 | 21.5 | 37 |
| 1-22 | 244 | 0.183 | 13.969 | 183.919 | 20 528.869 | 3 | 22 | 33.0 | 371 |
Among the 244 common CNVRs, we detected 25 regions that showed suggestive evidence for an association to (extreme) obesity in the family-based GWAS discovery sample (two-sided asymptotic _P_-value in the family-based association test for CNVs [CNV-FBAT] ≤ 0.05; Table 2 and Fig. 2). To assess the overall impact of the 25 CNVRs on obesity, we contrasted the effects of their correspondingly involved CNV markers to those of randomly sampled sets of CNV markers chosen from all CNV markers covering the analysed 244 common CNVRs. In a QQ plot (Supplementary Material, Fig. S1), we compared the distribution of the observed association _P_-values for the 1314 CNV markers covering the 25 detected CNVRs to the distribution of 1000 random sets of _P_-values for 1314 CNV markers each (expectation under the null hypothesis). We observed stronger obesity association signals for the 25 detected CNVRs when compared with the random distribution (Supplementary Material, Fig. S1).
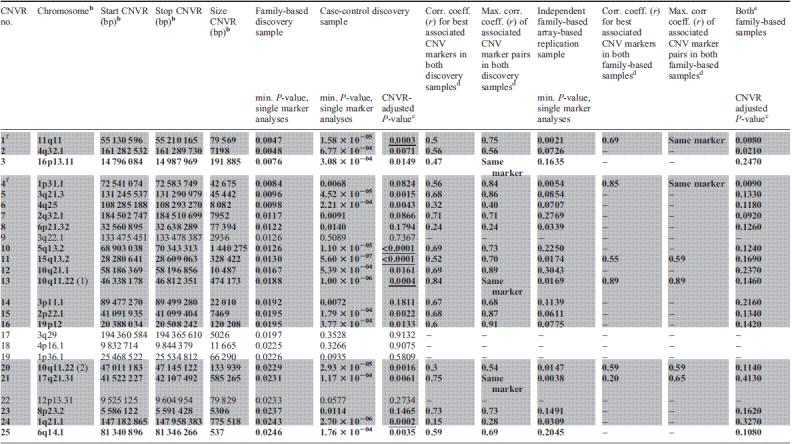
Table 2.
Characteristicsa of the 25 CNVRs related to obesity which were derived from the family-based GWAS discovery sample and sorted by minimal _P_-value
 |
|---|
Figure 2.

Genome-wide distribution of the 244 common CNVRs estimated in our discovery GWAS (family-based and case–control) samples. CNVRs are graphically represented by black bars according to their chromosomal position and size (genome build hg 18).
These 25 CNVRs were followed up by investigating an independent case–control GWAS sample: 20 of the 25 CNVRs also indicated evidence for a directionally consistent association with obesity (one-sided P ≤ 0.025; 5 of the 20 CNVRs with a Bonferroni-corrected CNVR-adjusted one-sided P ≤ 0.025; Table 2). Performing 10 000 permutations of the case–control status, we observed only two permutation samples with 20 or more of such directionally consistent associations with obesity (empirical _P_-value 2 × 10−04). For 3 of the 20 CNVRs [CNVR 10q11.22 (1), CNVR 16p13.11 and CNVR 17q21.31], association signals for obesity were found at exactly the same CNV marker in both GWAS discovery samples. In the remaining 17 CNVRs, at least one CNV marker showed evidence for an association with obesity in the family-based GWAS sample, while at least one other correlated CNV marker in the case–control GWAS sample similarly showed evidence for an obesity association signal. The maximal pairwise correlation coefficient between each of these two CNV markers associated with obesity ranged from 0.24 to 0.91 as estimated in the parents, whereas the range of pairwise correlations between those two markers with minimal _P_-values in the family-based and in the case–control GWAS discovery sample was 0.15–0.84. Among the 20 CNVRs associated with obesity, reduced copy numbers (deletions) were associated with obesity in 18 CNVRs (Table 2).
For replication analysis of the signals in the 20 CNVRs with evidence for an association in both GWAS samples, we focused on a CNVR-tagging SNP approach (see Materials and Methods section). For two (CNVR 11q11 and CNVR 1p31.1) of these regions, a tagging SNP could be identified, which has been analysed in a third independent sample of 365 obesity trios. In addition, we also screened the 20 CNVRs in a subsample of the 365 obesity trios (281 obesity trios) using additional Affymetrix Genome-Wide Human SNP Array 6.0 data (array-based replication).
Replication and exploration of CNVR 11q11
The CNVR on chromosome 11q11 (CNVR 11q11) was the best CNVR (according to _P_-value in the family-based GWAS sample; min. _P_family-based = 0.0047) among the set of 20 CNVRs which were directionally consistently associated with obesity in both GWAS discovery samples (with correlation coefficients up to r = 0.75 for pairs of associated CNV markers in the two samples; Table 2). CNVR 11q11 was similarly supported in the multi-marker analysis (min. P = 8.66 × 10⁻⁴; Fig. 3). This CNVR represents a locus previously not reported to be associated with obesity. It is located between 55 130 596 and 55 210 165 bp spanning ∼80 kb. Interestingly, the region exclusively covers three olfactory receptor (OLR) genes: OR4P4, OR4S2 and OR4C6 (according to RefSeq of UCSC hg18; http://genome.ucsc.edu/) all belonging to the OLR family 4.
Figure 3.

Results for CNVR 11q11 in the family-based (filled circles) and in the case–control (open circles) GWAS discovery sample. Additionally, multi-marker FBAT results are plotted as grey lines representing the _P_-values achieved in the test incorporating each CNV marker covered by the line.
We followed CNVR 11q11 up in the replication sample of 365 independent obesity trios due to the availability of a CNV-tagging SNP (rs9804659) and observed a directionally consistent trend for an association to obesity with a one-sided _P_-value of 0.076 [odds ratio for the obesity effect allele (OR) = 1.188; 95% confidence interval (CI) = 0.939–1.502]. The maximal squared Pearson correlation (_r_2) between rs9804659 and any of the CNV markers in CNVR 11q11 was 0.65, while _r_2 was 0.53 between rs9804659 and the best associated CNV marker (minimal _P_-value in the family-based discovery sample; Table 3). Thus CNVR 11q11 is not that well tagged by rs9804659, which might explain why the _P_-value in the replication is an order of magnitude lower than in the discovery sample.
Table 3.
Results of the replication analyses for CNVR-tagging SNPs in 365 independent case-parents obesity trios.
| CNVR no. | Chromosome | Start – stop CNVR in BP | Tagging SNP | Position of tagging SNP in BP | Max. squared correlation (_r_2), SNP – CNVR (tagging direction)a | Squared correlation (_r_2), SNP – CNV marker with min. _p_family-based (tagging direction)b | SNP obesity effect allelec | SNP other allele | Frequency of obesity effect allele in parents | Odds ratio (95% CId) | _P_-valuee |
|---|---|---|---|---|---|---|---|---|---|---|---|
| 1 | 11q11 | 55 130 596–55 210 165 | rs9804659 | 55 078 787 | 0.65 (−) | 0.53 (−) | G | A | 27% | 1.188 (0.939–1.502) | 0.076 |
| 4 | 1p31.1 | 72 541 074–72 583 749 | rs2815752 | 72 585 028 | 0.79 (+) | 0.56 (+) | T | C | 66% | 1.277 (1.021–1.597) | 0.016 |
Consequently, given this moderate correlation, for technical validation and further analyses, we re-assessed CNVR 11q11 by quantitative real-time polymerase chain reaction (qPCR) in the family-based GWAS discovery sample and in the family-based replication sample of 365 case-parents obesity trios. On the basis of the qPCR findings, we validated CNVR 11q11 as a biallelic deletion region with a minor allele frequency of 28% in the set of all 789 parental pairs. We observed 7.71% homozygotes and 40.35% heterozygotes for the deletion in the parents. In obese offspring, we detected 9.72% homozygotes and 40.03% heterozygotes. Thus, the number of homozygous deletions was slightly increased in the obese offspring, which was consistent with the observed transmission disequilibrium. The analysis of the qPCR-validated copy number calls in the family-based GWAS discovery sample indicated a trend towards preferable transmission of the 11q11 deletion to obese children (OR = 1.171; 95% CI = 0.947–1.448; one-sided P = 0.066). A similar qPCR-based analysis in the replication sample revealed a directionally consistent finding (OR = 1.214; 95% CI = 0.959–1.537; one-sided P = 0.056). Finally, we performed a joint analysis of all case-parents trios (discovery and replication sample) to increase the precision of the estimator, resulting in an OR of 1.190 for the deletion allele (95% CI = 1.016–1.394; one-sided P = 0.015).
Array-based replication analysis
All 20 CNVRs with evidence for an association with obesity in both GWAS discovery samples were followed up in 281 independent obesity trios (a subsample of the 365 independent obesity trios analysed at the two tagging SNPs) that were very recently genotyped (Affymetrix Genome-Wide Human SNP Array 6.0). Six of the 20 CNVRs again showed evidence for a directionally consistent association with obesity (one-sided CNV-FBAT _P_-value ≤ 0.025; Table 2). These six CNVRs involve those two CNVRs that are also supported by the tagging SNP approach. Furthermore, association signals for only these two CNVRs were found at exactly the same CNV markers as in the family-based discovery GWAS sample. Neither in the family-based discovery nor in the array-based replication sample did any of the CNVRs achieve significant CNVR-adjusted _P_-values (all >0.025; data not shown). However, in a combined analysis of both family-based samples, three CNVRs presented at least nominally significant CNVR-adjusted one-sided _P_-values (≤0.025; Table 2). None of these CNVR associations remained significant after strict Bonferroni correction, which may potentially be due to an insufficient sample size. Among the three CNVRs with nominally significant CNVR-adjusted _P_-values, again those two CNVRs tagged by SNPs were found. Additional support was given for CNVR 4q32.1, which does not comprise any gene.
Previously reported CNVs in our genome-wide CNV analysis
CNVR 1p31.1 (Table 2) 20 kb upstream of NEGR1 was the only CNV associated with BMI in a meta-analysis of 15 GWAS (8). Identification of the CNV was based on SNP tagging in a large meta-analysis of population-based samples of European origin. We were able to confirm this CNVR in both of our GWAS discovery samples (min. _P_family-based = 0.0084; min. _P_cc = 0.0068 for different CNV markers) while we observed stronger signals in the family-based GWAS sample (Fig. 4). Moreover, CNVR 1p31.1 is one of the two CNVRs (out of 20) that could be tagged by an SNP (rs2815752). The major allele T of rs2815752 is tagging the deletion allele of CNVR 1p31.1. Analysis of the CNVR-tagging SNP in the replication sample (365 independent obesity trios) again underlined the obesity association (OR = 1.277; 95% CI = 1.021–1.597; one-sided _P_-value = 0.0157; Table 3). In a joint analysis of the two family-based samples at rs2815752, we estimated an OR of 1.214 (95% CI = 1.046–1.408, one-sided _P_-value = 0.0052). Additional support for this CNVR was provided by the array-based replication analysis (see above).
Figure 4.

Results for CNVR 1p31.1 (20 kb upstream of NEGR1) in the family-based (filled circles) and in the case–control (open circles) GWAS discovery sample. Additionally, multi-marker FBAT results are plotted as grey lines representing the _P_-values achieved in the test incorporating each CNV marker covered by a line.
In addition to CNVR 1p31.1, the other previously reported common CNVR associated with BMI (nominal _P_-value 0.011) was located on chromosome 10q11.22 which was initially described in an adult Chinese population-based sample (19). In our study, this CNVR [CNVR 10q11.22 (1)] was also among those 20 candidates with evidence for association with obesity in both GWAS discovery samples. In addition, this CNVR is among those three candidates with evidence for association at exactly the same CNV marker (located between 46 478 786 to 46 478 811 bp with a combined _P_-value = 1.13 × 10⁻⁶ in the two GWAS samples). In the case–control GWAS sample, the number of associated CNV markers was relatively large (47 of 161 CNV markers with P ≤ 0.025; Fig. 5). Moreover, CNVR 10q11.22 (1) is among those 6 CNVRs with a minimal one-sided CNV-FBAT _P_-value ≤ 0.025 in the array-based replication analyses. CNVR 10q11.22 (1) (Table 2) covers four genes: (i) the pancreatic polypeptide receptor 1 (PPYR1) was a member of the seven transmembrane domain-G-protein-coupled receptor family and pancreatic polypeptide (PP) is a potent anti-obesity agent known to inhibit food intake (27), (ii) Synaptotagmin XV (SYT15), (iii) the G protein regulated inducer of neurite outgrowth 2 (GPRIN2) and (iv) the heterogeneous nuclear ribonucleoprotein A1 pseudogene (LOC728643).
Figure 5.

Results for CNVR 10q11.22 (1) in the family-based (filled circles) and in the case–control (open circles) GWAS discovery sample. Additionally, multi-marker FBAT results are plotted as grey lines representing the _P_-values achieved in the test incorporating each CNV marker covered by a line.
Beyond the focus of this study on common CNVRs for early-onset (extreme) obesity, we also explored selected regions harbouring rare CNVs (20,21). First, we looked at deletions on chromosome 16p11.2 (28.4–31.0 Mb) of at least 593 kb in both of our GWAS samples (21). In the family-based GWAS sample, we exclusively found one obese patient with a heterozygous de novo deletion of 709 kb. Moreover, in the case–control GWAS sample, four obese cases but none of the controls were called for heterozygous deletions with sizes between 709 and 894 kb (one-sided _P_-value of Fisher's exact test = 0.13). Secondly, we compared the list of rare recurrent CNVs found in patients with severe early-onset obesity (20) to the common CNVRs determined here. We observed no exact overlap, which was not unexpected given our focus on common CNVs. However, 2 of the 12 CNVs reported for patients with severe early-onset extreme obesity (20) were 133 kb downstream and 66 kb upstream of the CNVRs detected here (CNVR 3p11.1 and CNVR 15q13.2; Table 2). Both these CNVRs showed evidence for association with obesity in both of our GWAS discovery samples (3p11.1: min. _P_family-based = 0.019; min. _P_cc = 0.0072 for different CNV markers with maximum correlation r = 0.68; 15q13.2: min. _P_family-based = 0.013; min. _P_cc = 5.5 × 10⁻⁷ for different CNV markers with maximum correlation r = 0.70).
DISCUSSION
We performed a genome-wide analysis of common copy number variations (CNVs) in two discovery samples ascertained for early-onset (extreme) obesity. We observed 244 CNVRs that covered ∼1.56% of the genome-most of these regions were already known from databases. Among the 244 CNVRs, we detected 20 regions that were directionally consistently associated with obesity in both discovery samples.
Among these 20 associated regions, we identified a new CNVR 11q11 associated with early-onset (extreme) obesity. While the presence of copy number variability at CNVR 11q11 is well established (28–30), its relationship to obesity has not been described before. CNVR 11q11 covers the three protein coding genes OR4P4, OR4S2, OR4C6 (according to RefSeq of UCSC hg18; http://genome.ucsc.edu/) of the OLR family 4. OLRs interact with odorant molecules in the nose, to initiate a neuronal response that triggers the perception of a smell. They form the largest mammalian protein superfamily. There is a high percentage (∼55%) of human pseudogenes (29). The OLR proteins are members of the family of G-protein-coupled receptors arising from single-coding exon genes.
It was hypothesized that CNVs play an important role in the evolution of the human olfactory repertoire (29). About half of the CNVs affecting the human OLR repertoire involve more than one OLR. It was also observed that CNVs were more frequent among pseudogenes of OLRs than among functional genes (29). Comparison to the chimpanzee, reference genome revealed that all of the detected deletion alleles are human derived. This indicated a profound effect of human-specific deletions on the individual OLR gene content. It was suggested that these deletion alleles may be used in future genetic association studies of olfactory inter-individual differences (29). Evidence was provided for OLR enrichment in CNVs not being due to positive selection but due to the dominance of OLR in segmentally duplicated regions (30). Additionally, purifying selection against CNVs is lower in regions containing OLRs than in regions containing essential genes (30). A possible link between OLRs and obesity has previously been suggested based on the observation of altered olfactory acuity in morbidly obese patients (31).
Additionally, within the 20 associated regions, we confirmed two previously published obesity associations: CNVR 1p31.1 20 kb upstream of NEGR1 (7,8) and CNVR 10q11.22 (1) covering the four genes SYT15, GPRIN2, LOC728643 and PPYR1 (19) with PPYR1 being the most interesting candidate, given its role in energy homeostasis and regulation of food intake (27,32). PPYR1 null animals have, for instance, a reduced body weight. PP reduces food intake predominantly via stimulation of the anorexigenic melanocortinergic pathway. This effect is mediated by direct action on local PPYR1 within the arcuate nucleus (32). PP binds to the PPYR1. In our study as well as in the previous study which initially described the association of CNVR 10p11.22 (1) with BMI (19), the loss of a PPYR1 gene copy number was associated with obesity. Among those individuals (n = 57) of our two GWAS discovery samples that were called for the loss of a PPYR1 gene copy number, only one was homozygous for the deletion. One can only speculate about these seemingly contradictory findings between studies in human and mice. Several mechanisms might explain the difference: (i) mice may not be the most appropriate model to understand the function of the human PPYR1, as mice express a functional Y6 receptor (in humans only an non-functional pseudo gene exists) and this receptor could explain some of the results of the Ppyr1 knockout mice. (ii) Sequence identity between mice Ppyr1 amino acid sequence is only 76% compared with human PPYR1. The high variability of PPYR1 across species might explain its different roles among species. (iii) Ppyr1 knockout mice are hyperphagic but nonetheless lean (27). If the gene has a slightly altered function in humans, hyperphagia is potentially retained but not the lean phenotype. (iv) Compared with the 56 studied subjects who are hemizygous for the PPYR1 gene, Ppyr1 knockout mice have neither copy of the gene nor corresponding gene expression products. Thus, subjects with only one copy of PPYR1 may produce less protein, which will regulate energy homeostasis through agonists or other pathways to inhibit obesity. In contrast, knockout mice have neither copy of the gene nor the corresponding gene expression products, which may also explain the difference between human studies and mice experiments.
While the replications of previous findings underline the strength of our study, the focus on consistently associated common CNVs for early-onset (extreme) obesity using an agnostic genome-wide approach is also accompanied by weaknesses. First of all, our follow-up/replication step using tagging SNPs has focused on only 2 of all 20 candidate CNVRs-albeit those with the strongest association signals. Thus, it is conceivable that additional regions could be true positive findings. However, given their weaker association signals in both of our deletion samples, larger replication samples than the one used by us will be required to rule out false-negative findings. This is underlined by the results of our array-based replication analyses supporting four additional CNVRs of all 20 candidate CNVRs. Secondly, our study clearly has limited detection power to comprehensively assess CNV at a genome-wide level. None of the tested CNVs achieved a stringent genome-wide significance level and for those that could be replicated only moderate effects (odds ratio of ∼1.2) were observable. Thus, our observation for early-onset (extreme) obesity underlines the recent finding that common CNVs are unlikely candidates to explain larger parts of the ‘missing heritability’ (26). Finally, it has to be underlined that the focus on CNVRs is accompanied by (a) the difficulty to define the CNV markers that make up a CNV and (b) the difficulty to assess when and if association signals in different samples pertain to the same source. Here both problems have been dealt with by providing upper limits of correlations among associated CNVs of independent samples and by omitting combined _P_-values across samples.
Since we replicated two CNVRs using tagging SNPs, their association could have already been detected by genome-wide SNP association studies. Indeed, rs2815752 (tagging CNVR 1p31.1) near NEGR1 is a well-known and well-replicated BMI locus (8,33). In contrast, for rs9804659 (tagging CNVR 11q11), no association to obesity, BMI or waist–hip ratio has yet been reported in the primarily population-based genetic association studies of adults (33,34).
Very recently, another 21-kb CNV that lies 50 kb upstream of the gene GPRC5B has been reported to be associated with BMI (33). The identification of this CNV was based on the tagging SNP rs12444979 in a large meta-analysis for population-based samples, whereas the deletion allele of the CNV is tagged by the non-risk allele of the SNP. We could also identify this CNV as one of the 244 common CNVRs analysed here. However, a significant association with early-onset (extreme) obesity was observed only in our case–control GWAS discovery sample (one-sided min. _P_CC = 0.0066 and min. _P_family-based = 0.0408 for the non-deletion direction).
Owing to our focus on common CNVs, the role of rare deletions or duplications has only been addressed here, by exploring selected loci harbouring known rare CNVs in extreme obese patients (20,21). In order to comprehensively investigate whether certain rare CNVs [e.g. large (>1 Mb) CNVs (cf. 22)] predispose to obesity, a more comprehensive quality control (QC) and validation of each single CNV call as well as a much larger adequately powered analysis sample is needed. It is conceivable that such assessments will become feasible within large-scale consortia such as GIANT [Genetic Investigation of ANthropometric Traits (8)].
In summary, we provide evidence for a new common CNVR for early-onset (extreme) obesity on chromosome 11q11 covering the coding regions of OLR genes. Moreover, we confirmed two previously described common CNVRs for obesity. Overall, however, common CNVRs seem to be of minor importance to account for the ‘missing heritability’ of early-onset (extreme) obesity.
MATERIALS AND METHODS
Study subjects
Detection of common CNVRs and initial association analyses were based on two GWAS discovery samples both genotyped by the Affymetrix Genome-Wide Human SNP Array 6.0. The family-based GWAS sample (Sample 1) consists of 424 obesity trios, i.e. one (extremely) obese child or adolescent and both biological parents (Supplementary Material, Table S1). The second GWAS sample (Sample 2) consists of 453 (extremely) obese children and adolescents and 435 normal-weight or lean adult controls (Supplementary Material, Table S1). For replication of the association of certain CNVs with obesity as derived from both GWAS samples, we analysed a third independent sample of 365 obesity trios (Sample 3) which was recruited similarly as the family-based GWAS sample (Supplementary Material, Table S1). Additional array-based replication analyses were performed in a subsample of Sample 3 consisting of 281 obesity trios for which genome-wide genotyping data (Affymetrix Genome-Wide Human SNP Array 6.0) became available very recently (Sample 3a).
In all three samples, the measured BMI (in kg/m2) was assessed for extremeness using age- and sex-specific percentile criteria for the German population (35). According to this reference population, all cases (cases of the case–control sample and offspring of the two family-based samples) were at least overweight (percentile ≥ 90th). Most of the cases were extremely obese (percentile ≥ 97th): 93.6% of the index cases of the family-based GWAS sample, 92.5% of the cases in the case–control GWAS sample as well as 91.5% of the offspring from the family-based replication sample.
Written informed consent was given by all participants and, in case of minors, by their parents. The study was approved by the Ethics Committees of the Universities of Marburg and Essen and conducted in accordance with the Declaration of Helsinki.
CNVs calling and CNVRs determination
CNVs calling
In both GWAS discovery samples, genotyping was carried out using the Affymetrix Genome-Wide Human SNP Array 6.0. Besides 906 703 SNP probes (869 747 autosomal), this chip contains 943 390 non-polymorphic additional probes (888 023 autosomal) for copy number analyses (http://www.affymetrix.com). The autosomal fluorescent intensities at the non-polymorphic probes were used as a measure of copy number variance for the primary statistical analysis. This was done to avoid the loss of information and power related to CNV calling (36,37). The intensity values were extracted from the individual CEL files utilizing the R-package ‘affxparser’. We normalized the raw intensities of the case–control GWAS sample by performing quantile normalization (38) to address potential chip effects. In case of the family-based GWAS sample, we analysed the raw fluorescent intensities since the family-based design allows for controlling the inter-individual variability.
As secondary sensitivity analysis in both GWAS discovery samples, we investigated the called CNV states at a genome-wide level, i.e. the unphased total number of copies at a genomic locus. We determined CNV calls for each individual and each marker using the Affymetrix Genotyping Console 3.0. In particular, we applied a five-state hidden Markov model (HMM) (39) to smooth and segment the data with default values of 0.2 for each prior probability and 1000 Mb as a transition decay. The five possible HMM copy number states (CNS) were: 0, homozygous deletions; 1, heterozygous deletions; 2, (normal) diploid case; 3, single copy gains; 4+, cases of four or more copies. The CNV calling requires comparison of individual signal intensities against a reference sample. Owing to computational constraints, we processed a reference sample of 106 parental pairs from the family-based GWAS sample. To check whether and to what extent the choice of the reference sample had an impact on CNS calling, we decided to choose two different reference samples, each comprising 106 parental pairs. Reference Sample 1 was a random sample of all parental pairs, whereas reference Sample 2 was based on those 106 parental pairs with the lowest mean BMI standard deviation score values out of all non-obese parental pairs (percentiles < 90th) in our sample (see Supplementary Material, Table S1 for details). In both GWAS discovery samples, we performed CNV calling based on either of the two reference samples and proceeded only those variations that were consistently assigned via both approaches (see QC and association testing section).
CNVRs determination
A CNV has been defined as a DNA segment that is 1 kb or larger and is present at variable copy numbers in comparison with a reference genome (40). Copy number variable regions (CNVRs) are regions covered by overlapping CNVs (41). The copy number characterization of 270 HapMap samples showed that ∼80% of observed copy number differences between pairs of individuals were due to common CNVs with an allele frequency of >5%, and >99% were derived from inheritance rather than from new duplication/deletion events (13). According to published recommendations (13,41), we defined common CNVRs as regions covering at least three consecutive CNV markers showing deletions or duplications in at least 5% of each set of GWAS cases, parents and controls. Thus, if several individual CNVs overlapped, we merged them in the same CNVR, so that most CNVRs represent a union of overlapping CNVs (19,42). For details on the resulting 244 CNVRs based on 8051 CNV markers with genomic positions based on genome build hg 18 (March 2006), see Table 1 and Figure 2.
CNV validation and replication
Validation of CNVR 11q11 by qPCR
The most promising new region detected in the two GWAS samples, a CNVR at chromosome 11q11 (CNVR 11q11), was technically validated in the family-based GWAS sample using qPCR to ensure reliability of the chip-based CNVR detection and for additional analyses based on precise individual copy number calls. In more detail, we applied real-time quantitative PCR, using a Duplex TaqMan CNV assay (Applied Biosystems, Germany; assay Hs03802074_cn at chr11:55 203 791 ± 50 bp) as described previously (43). Briefly, every reaction was performed as a triplicate and the results for the qPCR were analysed using the software CopyCaller 1.0 (Applied Biosystems). Overall, the correlation between continuous intensity-based CNV calls used for association testing and continuous qPCR predicted calls was estimated to be 0.87 (Pearson correlation coefficient). Using qPCR approximately half of the individuals of the family-based sample were identified as carriers of a heterozygous or homozygous deletion at CNVR 11q11. Regarding called CNS the data were not readily comparable. Hence, all called 105 homozygous deletions at CNVR 11q11 were called by both qPCR and Affymetrix CNV markers whereas the overlap for called heterozygous deletions (n = 510 called by qPCR) was exceedingly lower (only 3% of all 510 heterozygous deletions were calculated as CNS = 1 by the HMM applied to the Affymetrix CNV markers). Taken together, the latter observation corresponds to the results of others (44) and underlines the benefits of using intensities as compared to the use of called CNVs.
For further analysis of the CNVR 11q11 signal, in the independent sample of 365 obesity trios copy number status was also assessed by the qPCR assay described above, resulting in similar proportions for heterozygous and homozygous deletion carriers.
CNVR-tagging by SNPs
CNVRs and the surrounding ± 500 kb DNA segments with evidence for an association to obesity as based on the CNV-FBAT (family-based GWAS sample; at least one marker with a two-sided asymptotic _P_-value ≤ 0.05) and with additional evidence for association as based on the logistic regression (case-control GWAS sample; at least one marker with a directionally consistent two-sided asymptotic _P_-value ≤ 0.05), were analysed with the aim to identify SNPs that are in linkage disequilibrium with the involved CNVs (see 26). It was reported that CNVs that were well genotyped were frequently tagged by SNPs (26). Again circumventing the calling, we determined Pearson correlations of intensity values for CNVs and SNPs in the set of all 424 parental pairs of the GWAS trios. For a CNVR-tagging SNP we required that the squared Pearson correlation coefficient (_r_2) of intensities had to be >0.6 for at least three consecutive CNV markers. CNVR-tagging SNPs were detected for two of the 20 CNVRs assessed. These two SNPs (rs9804659, rs2815752) were followed-up for replication association analyses in the sample of 365 independent case-parents obesity trios.
QC and association testing
Quality control
All individuals of both GWAS samples underwent SNP marker QC as described previously (4,45). In detail, QC filters for individuals were checked for Mendelian inconsistencies in the family-based GWAS sample (>5% of all SNPs), the application of an SNP call rate of 95% and a minimum genotyping quality as assessed by Affymetrix Contrast QC > 0.4.
Regarding QC of the CNVR determination, we limited our analyses to CNVRs for which the genomic variability-irrespective of phenotype (i.e. in cases, controls, parents and offspring)-was at least 5% based on each of the two reference samples used for copy number calling (Supplementary Material, Table S1). The mean individual concordance rates between the use of both reference samples for called CNSs 0, 1, 3 and 4+ were 97.83% (range: 84.67–99.90%) in the family-based GWAS sample and 94.53% (range: 83.61–99.79%) in the case–control GWAS sample.
Concerning the genome-wide agreement between CNVR calling in both discovery GWAS samples, a total of 880 CNVRs with frequencies >1% which cover ≈15% of the genome have been called in the family-based discovery GWAS sample. Of these CNVRs, 97.04% were again called as CNVRs in the case–control discovery GWAS sample. Even among those CNVRs that were found in at least two individuals (6473) in the family-based discovery GWAS sample, 83.5% were redetected as CNVRs in the case–control discovery GWAS sample. CNVRs called in just one individual are more likely false positives compared with CNVRs identified in several individuals and are thus neglected here.
When focusing on CNVRs, comparability of association findings across samples needs to be addressed as different individual CNV markers might contribute to the association in different samples. We determined pairwise Pearson correlations between pairs of selected CNV marker intensity values in each of the two discovery GWAS samples. The selection was based on the presence of some evidence for an association with obesity for the CNVR (family-based GWAS: two-sided asymptotic _P_-value in CNV-FBAT ≤ 0.05; case–control GWAS: directionally consistent two-sided asymptotic _P_-value in logistic regression ≤ 0.05). We report the maximal Pearson correlation coefficient (r) computed from the set of selected CNV markers (Table 2, 10th column). For comparability, we also report the Pearson correlation coefficient (r) for those two CNV markers with minimal _P_-values in the family-based and in the case–control discovery GWAS samples, respectively (Table 2, 9th column).
Concerning the QC related to the qPCR experiments for CNVR 11q11, only those copy number calls with a confidence value (by CopyCaller 1.0) of at least 0.98 without evidence for Mendelian inconsistencies were followed-up. Subsequently, the full set of all 772 families successfully assessed by qPCR was analysed for deviations from Hardy–Weinberg equilibrium (46) resulting in a two-sided exact _P_-value of 0.95 in the parents.
For QC of the CNVR-tagging SNP genotypes (at rs9804659 and rs2815752) in the replication sample of 365 case-parents obesity trios, an exact test for deviations from Hardy–Weinberg equilibrium (46) was performed in the set of parents (minimal two-sided exact _P_-value across both SNPs = 0.33).
Association testing
In each sample, we analysed the association between CNVs and (extreme) obesity. All primary analyses of the GWAS discovery samples were based on fluorescent intensities which represent the copy numbers. For the family-based GWAS sample, we applied the CNV-FBAT methodology (37) to test the raw intensities for association with the phenotype obesity. We based our association tests on the raw intensities in order to avoid the known loss of information and statistical power resulting from classifying raw copy number measurements into discrete classes, i.e. CNV calls (36,37). To reduce the number of statistical tests and to minimize the risk of false-positive findings, the CNV-FBAT association tests were limited to the common CNVRs derived as described above. Additionally, we performed multi-marker FBATs (35) incorporating all possible marker combinations in a specific CNVR. The case–control GWAS sample was analysed by logistic regression with the predictors normalized intensities, sex and age.
Regarding the study design we focused on CNV testing in the family-based discovery sample as a first step while using the case–control discovery GWAS sample as secondary discovery filter. The focus on our family-based sample has several advantages: (i) the known robustness of the family-based design against population stratification; (ii) better control for biases (e.g. plate effects) due to the within-family comparisons; (iii) due to the incorporation of only one affected offspring per pedigree, the CNV-FBAT leads to quite conservative results, which lowers the risk of false positives. The conservativeness of the CNV-FBAT is displayed in the QQ plots for the two discovery samples (Supplementary Material, Fig. S2). In contrast to the CNV-FBAT, the results for the case–control analyses are too liberal although we performed normalizations of the intensity signals to, for example, address technical problems (e.g. plate effects).
To derive CNVRs for replication using CNVR-tagging SNPs, we first focused on those estimated CNVRs which showed some evidence for association to obesity in the family-based GWAS sample (CNV-FBAT test; at least one marker with a two-sided asymptotic _P_-value ≤ 0.05). Taking into account whether this CNVR indicated gain or loss for the obesity association, we then calculated CNV marker-specific one-sided _P_-values for the tests in the case–control GWAS sample. For clarity (if not stated otherwise), all reported _P_-values are one-sided, nominal, i.e. unadjusted for multiple testing, and asymptotic.
In the independent replication sample of obesity trios, we genotyped the two identified CNVR-tagging SNPs. For detailed analysis of the CNVR 11q11, this was additionally genotyped by qPCR in the family-based replication sample. For the CNVR-tagging SNPs, we applied the classical transmission disequilibrium test (TDT) (47). Replication analysis of the qPCR-typed CNVR 11q11 was performed by application of the CNV-FBAT on the derived copy number calls. Odds ratios (ORs) were calculated by applying the haplotype relative risk method (48), which uses the transmitted parental alleles as a case sample and the untransmitted parental alleles as a control sample.
For additional array-based replication analyses of the 20 discovered CNVRs in a sample of 281 independent obesity trios, intensity values for each involved marker were again extracted with the R-package ‘affxparser’. As for the family-based discovery GWAS sample, the CNV-FBAT methodology was applied to the raw intensities afterwards. Finally, one-sided _P_-values were calculated by taking into account the estimated CNVR effect direction as based on the family-based discovery GWAS sample.
Permutation and multiple testing
Under the null hypothesis of no marker-phenotype associations, the intensity distribution at each marker is independent of the family status (i.e. father, mother, child) in the family-based samples and independent of the affection status (i.e. case, control) in the case–control sample. Thus, in order to simulate the test statistics distributions under the null hypothesis, we permuted family status (and family labels) or affection status, respectively, several times; each time storing the corresponding test statistics. Following this procedure, marker-wise approximate exact _P_-values were then calculated by dividing the number of observed permutations achieving an equal or higher test statistic for this marker than the actually observed one by the number of permutations performed. The QQ plots in Supplementary Material, Figure S3 demonstrate the validity of this approach and of the asymptotical _P_-values by comparing the quantiles of the 8051 true (asymptotic) observed _P_-values in the 244 common CNVRs with those quantiles of approximate exact _P_-values based on 1000 permutations in the case–control sample and the family-based sample, respectively. Note that here, deviations from the diagonal line for the case–control sample result from the limited number of permutations performed. CNVR-wise approximate exact (called CNVR-adjusted) _P_-values were calculated analogously by taking into account that several CNV markers have been tested for each CNVR. Thus here, for each permutation and each CNVR, the maximum over all CNV markers test statistics was compared with the maximum of the observed test statistic. In order to achieve one-sided exact _P_-values, we additionally stored and compared the direction of the effect.
To address the genome-wide multiple testing problem of our report, we also performed additional analyses. First, to address the impact of the 25 CNVRs detected in the family-based GWAS discovery sample, we stored the CNV-FBAT _P_-values of the respective 1314 CNV markers (those with two-sided asymptotic _P_-values ≤ 0.05; Table 2). Next, we drew 1000 random sets of 1314 CNV markers out of the 244 analysed CNVRs (8051 CNV markers) to derive the distribution of _P_-values under the null hypothesis. Next, both the quantiles of –log10 _P_-values of observed association signals and the corresponding 97.5, 50 and 2.5% percentiles of the 1000 random sets of equal size were plotted against the expected quantiles (from a uniform distribution) in a QQ plot (Supplementary Material, Fig. S1). While both the observed and sampled results indicated the conservativeness of the family-based discovery GWAS approach, the smaller _P_-values of the observed signals justify our subsequent proceeding.
Secondly, in the case–control GWAS discovery sample, we performed 10 000 permutations of the case–control status to see how often we get directionally consistent nominal minimal one-sided _P_-values of ≤0.025 as observed for 20 out of the 25 CNVRs detected in the family-based discovery GWAS sample. In none of the permutations we observed more than 20 such directionally consistent CNVR findings; in two permutation samples, we observed exactly 20 (taken together resulting in an empirical _P_-value of 2 × 10⁻⁴); the median was 10 directionally consistent CNVR findings in the 10 000 permutations.
Thirdly, in order to account for multiple testing in the case–control GWAS discovery sample, we also performed Bonferroni corrections for the 25 CNVRs tested. Five of the 25 CNVRs followed-up in the case–control GWAS discovery sample achieved one-sided _P_-values of <0.025.
ACCESSION NUMBERS
OR4P4; HGNC: 15180, Entrez Gene: 81300, Ensembl: ENSG00000181927, UniProtKB: Q8NGL7.
OR4S2; HGNC: 15183, Entrez Gene: 219431, Ensembl: ENSG00000174982, UniProtKB: Q8NH73.
OR4C6; HGNC: 14743, Entrez Gene: 219432, Ensembl: ENSG00000181903, UniProtKB: Q8NH72.
AUTHORS' CONTRIBUTIONS
I.J., J.H., A.H., A.S. conceived and designed the experiments, C.V. performed the replication and validation experiments, I.J. analysed the data, J.H., A.H., S.S., H.S. contributed to reagents/materials/analysis tools and I.J., J.H., A.H., A.S. wrote the manuscript. All others reviewed and approved the manuscript.
SUPPLEMENTARY MATERIAL
Supplementary Material is available at HMG online.
Supplementary Data
FUNDING
This study was supported by grants of the German Federal Ministry of Education and Research (BMBF 01KU0903; NGFNplus: 01GS0830, 01GS0820). The funders had no role in study design, data collection and analysis, decision to publish, or preparation of the manuscript. Funding to pay the Open Access publication charges for this article was provided by grants of the German Federal Ministry of Education and Research, NGFNplus: 01GS0830.
ACKNOWLEDGEMENTS
We thank the probands and their families for their participation and support.
Conflict of Interest statement. None declared.
REFERENCES
- 1.Friedman J.M. Obesity in the new millennium. Nature. 2000;404:632–634. doi: 10.1038/35007504. [DOI] [PubMed] [Google Scholar]
- 2.Walley A.J., Asher J.E., Froguel P. The genetic contribution to non-syndromic human obesity. Nat. Rev. Genet. 2009;10:431–442. doi: 10.1038/nrg2594. doi:10.1038/nrg2594. [DOI] [PubMed] [Google Scholar]
- 3.Herbert A., Gerry N.P., McQueen M.B., Heid I.M., Pfeufer A., Illig T., Wichmann H.E., Meitinger T., Hunter D., Hu F.B., et al. A common genetic variant is associated with adult and childhood obesity. Science. 2006;312:279–283. doi: 10.1126/science.1124779. doi:10.1126/science.1124779. [DOI] [PubMed] [Google Scholar]
- 4.Hinney A., Nguyen T.T., Scherag A., Friedel S., Brönner G., Müller T.D., Grallert H., Illig T., Wichmann H.E., Rief W., et al. Genome wide association (GWA) study for early onset extreme obesity supports the role of fat mass and obesity associated gene (FTO) variants. PLoS One. 2007;2:e1361. doi: 10.1371/journal.pone.0001361. doi:10.1371/journal.pone.0001361. [DOI] [PMC free article] [PubMed] [Google Scholar]
- 5.Loos R.J., Lindgren C.M., Li S., Wheeler E., Zhao J.H., Prokopenko I., Inouye M., Freathy R.M., Attwood A.P., Beckmann J.S., et al. Common variants near MC4R are associated with fat mass, weight and risk of obesity. Nat. Genet. 2008;40:768–775. doi: 10.1038/ng.140. doi:10.1038/ng.140. [DOI] [PMC free article] [PubMed] [Google Scholar]
- 6.Meyre D., Delplanque J., Chèvre J.C., Lecoeur C., Lobbens S., Gallina S., Durand E., Vatin V., Degraeve F., Proença C., et al. Genome-wide association study for early-onset and morbid adult obesity identifies three new risk loci in European populations. Nat. Genet. 2009;41:157–159. doi: 10.1038/ng.301. doi:10.1038/ng.301. [DOI] [PubMed] [Google Scholar]
- 7.Thorleifsson G., Walters G.B., Gudbjartsson D.F., Steinthorsdottir V., Sulem P., Helgadottir A., Styrkarsdottir U., Gretarsdottir S., Thorlacius S., Jonsdottir I., et al. Genome-wide association yields new sequence variants at seven loci that associate with measures of obesity. Nat. Genet. 2009;41:18–24. doi: 10.1038/ng.274. doi:10.1038/ng.274. [DOI] [PubMed] [Google Scholar]
- 8.Willer C.J., Speliotes E.K., Loos R.J., Li S., Lindgren C.M., Heid I.M., Berndt S.I., Elliott A.L., Jackson A.U., Lamina C., et al. Six new loci associated with body mass index highlight a neuronal influence on body weight regulation. Nat. Genet. 2009;41:25–34. doi: 10.1038/ng.287. doi:10.1038/ng.287. [DOI] [PMC free article] [PubMed] [Google Scholar]
- 9.Hinney A., Vogel C.I., Hebebrand J. From monogenic to polygenic obesity, recent advances. Eur. Child. Adolesc. Psychiatry. 2010;19:297–310. doi: 10.1007/s00787-010-0096-6. doi:10.1007/s00787-010-0096-6. [DOI] [PMC free article] [PubMed] [Google Scholar]
- 10.Manolio T.A., Collins F.S., Cox N.J., Goldstein D.B., Hindorff L.A., Hunter D.J., McCarthy M.I., Ramos E.M., Cardon L.R., Chakravarti A., et al. Finding the missing heritability of complex diseases. Nature. 2009;461:747–753. doi: 10.1038/nature08494. doi:10.1038/nature08494. [DOI] [PMC free article] [PubMed] [Google Scholar]
- 11.Conrad D.F., Pinto D., Redon R., Feuk L., Gokcumen O., Zhang Y., Aerts J., Andrews T.D., Barnes C., Campbell P., et al. Origins and functional impact of copy number variation in the human genome. Nature. 2010;464:704–712. doi: 10.1038/nature08516. doi:10.1038/nature08516. [DOI] [PMC free article] [PubMed] [Google Scholar]
- 12.Ionita-Laza I., Rogers A.J., Lange C., Raby B.A., Lee C. Genetic association analysis of copy-number variation (CNV) in human disease pathogenesis. Genomics. 2009;93:22–26. doi: 10.1016/j.ygeno.2008.08.012. doi:10.1016/j.ygeno.2008.08.012. [DOI] [PMC free article] [PubMed] [Google Scholar]
- 13.McCarroll S.A., Kuruvilla F.G., Korn J.M., Cawley S., Nemesh J., Wysoker A., Shapero M.H., deBakker P.I., Maller J.B., Kirby A., et al. Integrated detection and population-genetic analysis of SNPs and copy number variation. Nat. Genet. 2008;40:1166–1174. doi: 10.1038/ng.238. doi:10.1038/ng.238. [DOI] [PubMed] [Google Scholar]
- 14.McCarroll S.A. Copy-number analysis goes more than skin deep. Nat. Genet. 2008;40:5–6. doi: 10.1038/ng0108-5. doi:10.1038/ng0108-5. [DOI] [PubMed] [Google Scholar]
- 15.Stefansson H., Rujescu D., Cichon S., Pietiläinen O.P., Ingason A., Steinberg S., Fossdal R., Sigurdsson E., Sigmundsson T., Buizer-Voskamp J.E., et al. Large recurrent microdeletions associated with schizophrenia. Nature. 2008;455:232–236. doi: 10.1038/nature07229. doi:10.1038/nature07229. [DOI] [PMC free article] [PubMed] [Google Scholar]
- 16.Sebat J., Lakshmi B., Malhotra D., Troge J., Lese-Martin C., Walsh T., Yamrom B., Yoon S., Krasnitz A., Kendall J., et al. Strong association of de novo copy number mutations with autism. Science. 2007;316:445–449. doi: 10.1126/science.1138659. doi:10.1126/science.1138659. [DOI] [PMC free article] [PubMed] [Google Scholar]
- 17.Lee J.A., Lupski J.R. Genomic rearrangements and gene copy-number alterations as a cause of nervous system disorders. Neuron. 2006;52:103–121. doi: 10.1016/j.neuron.2006.09.027. doi:10.1016/j.neuron.2006.09.027. [DOI] [PubMed] [Google Scholar]
- 18.Gonzalez E., Kulkarni H., Bolivar H., Mangano A., Sanchez R., Catano G., Nibbs R.J., Freedman B.I., Quinones M.P., Bamshad M.J., et al. The influence of CCL3L1 gene-containing segmental duplications on HIV-1/AIDS susceptibility. Science. 2005;307:1434–1440. doi: 10.1126/science.1101160. doi:10.1126/science.1101160. [DOI] [PubMed] [Google Scholar]
- 19.Sha B.Y., Yang T.L., Zhao L.J., Chen X.D., Guo Y., Chen Y., Pan F., Zhang Z.X., Dong S.S., Xu X.H., Deng H.W. Genome-wide association study suggested copy number variation may be associated with body mass index in the Chinese population. J. Hum. Genet. 2009;54:199–202. doi: 10.1038/jhg.2009.10. doi:10.1038/jhg.2009.10. [DOI] [PMC free article] [PubMed] [Google Scholar]
- 20.Bochukova E.G., Huang N., Keogh J., Henning E., Purmann C., Blaszczyk K., Saeed S., Hamilton-Shield J., Clayton-Smith J., O'Rahilly S., et al. Large, rare chromosomal deletions associated with severe early-onset obesity. Nature. 2010;463:666–670. doi: 10.1038/nature08689. doi:10.1038/nature08689. [DOI] [PMC free article] [PubMed] [Google Scholar]
- 21.Walters R.G., Jacquemont S., Valsesia A., deSmith A.J., Martinet D., Andersson J., Falchi M., Chen F., Andrieux J., Lobbens S., et al. A new highly penetrant form of obesity due to deletions on chromosome 16p11.2. Nature. 2010;463:671–675. doi: 10.1038/nature08727. doi:10.1038/nature08727. [DOI] [PMC free article] [PubMed] [Google Scholar]
- 22.Wang K., Li W.D., Glessner J.T., Grant S.F., Hakonarson H., Price R.A. Large copy number variations are enriched in cases with moderate to extreme obesity. Diabetes. 2010;59:2960–2964. doi: 10.2337/db10-0192. [DOI] [PMC free article] [PubMed] [Google Scholar]
- 23.Weiss L.A., Shen Y., Korn J.M., Arking D.E., Miller D.T., Fossdal R., Saemundsen E., Stefansson H., Ferreira M.A., Green T., et al. Association between microdeletion and microduplication at 16p11.2 and autism. N. Engl. J. Med. 2008;358:667–675. doi: 10.1056/NEJMoa075974. doi:10.1056/NEJMoa075974. [DOI] [PubMed] [Google Scholar]
- 24.Park J.H., Wacholder S., Gail M.H., Peters U., Jacobs K.B., Chanock S.J., Chatterjee N. Estimation of effect size distribution from genome-wide association studies and implications for future discoveries. Nat. Genet. 2010;42:570–575. doi: 10.1038/ng.610. doi:10.1038/ng.610. [DOI] [PMC free article] [PubMed] [Google Scholar]
- 25.Yang J., Benyamin B., McEvoy B.P., Gordon S., Henders A.K., Nyholt D.R., Madden P.A., Heath A.C., Martin N.G., Montgomery G.W., et al. Common SNPs explain a large proportion of the heritability for human height. Nat. Genet. 2010;42:565–569. doi: 10.1038/ng.608. doi:10.1038/ng.608. [DOI] [PMC free article] [PubMed] [Google Scholar]
- 26.Craddock N., Hurles M.E., Cardin N., Pearson R.D., Plagnol V., Robson S., Vukcevic D., Barnes C., Conrad D.F., Giannoulatou E., et al. Genome-wide association study of CNVs in 16,000 cases of eight common diseases and 3,000 shared controls. Nature. 2010;464:713–720. doi: 10.1038/nature08979. doi:10.1038/nature08979. [DOI] [PMC free article] [PubMed] [Google Scholar]
- 27.Sainsbury A., Baldock P.A., Schwarzer C., Ueno N., Enriquez R.F., Couzens M., Inui A., Herzog H., Gardiner E.M. Synergistic effects of Y2 and Y4 receptors on adiposity and bone mass revealed in double knockout mice. Mol. Cell. Biol. 2003;23:5225–5233. doi: 10.1128/MCB.23.15.5225-5233.2003. doi:10.1128/MCB.23.15.5225-5233.2003. [DOI] [PMC free article] [PubMed] [Google Scholar]
- 28.Wong K.K., deLeeuw R.J., Dosanjh N.S., Kimm L.R., Cheng Z., Horsman D.E., MacAulay C., Ng R.T., Brown C.J., Eichler E.E., Lam W.L. A comprehensive analysis of common copy-number variations in the human genome. Am. J. Hum. Genet. 2007;80:91–104. doi: 10.1086/510560. doi:10.1086/510560. [DOI] [PMC free article] [PubMed] [Google Scholar]
- 29.Hasin Y., Olender T., Khen M., Gonzaga-Jauregui C., Kim P.M., Urban A.E., Snyder M., Gerstein M.B., Lancet D., Korbel J.O. High-resolution copy-number variation map reflects human olfactory receptor diversity and evolution. PLoS Genet. 2008;4:e1000249. doi: 10.1371/journal.pgen.1000249. doi:10.1371/journal.pgen.1000249. [DOI] [PMC free article] [PubMed] [Google Scholar]
- 30.Young J.M., Endicott R.M., Parghi S.S., Walker M., Kidd J.M., Trask B.J. Extensive copy-number variation of the human olfactory receptor gene family. Am. J. Hum. Genet. 2008;83:228–242. doi: 10.1016/j.ajhg.2008.07.005. doi:10.1016/j.ajhg.2008.07.005. [DOI] [PMC free article] [PubMed] [Google Scholar]
- 31.Richardson B.E., VanderWoude E.A., Sudan R., Thompson J.S., Leopold D.A. Altered olfactory acuity in the morbidly obese. Obes. Surg. 2004;14:967–969. doi: 10.1381/0960892041719617. doi:10.1381/0960892041719617. [DOI] [PubMed] [Google Scholar]
- 32.Sainsbury A., Shi Y.C., Zhang L., Aljanova A., Lin Z., Nguyen A.D., Herzog H., Lin S. Y4 receptors and pancreatic polypeptide regulate food intake via hypothalamic orexin and brain-derived neurotropic factor dependent pathways. Neuropeptides. 2010;44:261–268. doi: 10.1016/j.npep.2010.01.001. doi:10.1016/j.npep.2010.01.001. [DOI] [PubMed] [Google Scholar]
- 33.Speliotes E.K., Willer C.J., Berndt S.I., Monda K.L., Thorleifsson G., Jackson A.U., Allen H.L., Lindgren C.M., Luan J., Mägi R., et al. Association analyses of 249,796 individuals reveal 18 new loci associated with body mass index. Nat. Genet. 2010;42:937–948. doi: 10.1038/ng.686. [DOI] [PMC free article] [PubMed] [Google Scholar]
- 34.Heid I.M., Jackson A.U., Randall J.C., Winkler T.W., Qi L., Steinthorsdottir V., Thorleifsson G., Zillikens M.C., Speliotes E.K., Mägi R., et al. Meta-analysis identifies 13 new loci associated with waist-hip ratio and reveals sexual dimorphism in the genetic basis of fat distribution. Nat. Genet. 2010;42:949–960. doi: 10.1038/ng.685. [DOI] [PMC free article] [PubMed] [Google Scholar]
- 35.Hebebrand J., Heseker H., Himmelmann G.W., Schäfer H., Remschmidt H. Altersperzentilen für den Body Mass Index aus Daten der Nationalen Verzehrstudie einschließlich einer Übersicht zu relevanten Einflussfaktoren. Aktuel. Ernährungsmed. 1994;19:259–265. [Google Scholar]
- 36.McCarroll S.A., Altshuler D.M. Copy-number variation and association studies of human disease. Nat. Genet. 2007;39:37–42. doi: 10.1038/ng2080. doi:10.1038/ng2080. [DOI] [PubMed] [Google Scholar]
- 37.Ionita-Laza I., Perry G.H., Raby B.A., Klanderman B., Lee C., Laird N.M., Weiss S.T., Lange C. On the analysis of copy-number variations in genome-wide association studies, a translation of the family-based association test. Genet. Epidemiol. 2008;32:273–284. doi: 10.1002/gepi.20302. doi:10.1002/gepi.20302. [DOI] [PubMed] [Google Scholar]
- 38.Bolstad B.M., Irizarry R.A., Astrand M., Speed T.P. A comparison of normalization methods for high density oligonucleotide array data based on variance and bias. Bioinformatics. 2003;19:185–193. doi: 10.1093/bioinformatics/19.2.185. doi:10.1093/bioinformatics/19.2.185. [DOI] [PubMed] [Google Scholar]
- 39.Fridlyand J., Snijders A.M., Pinkel D., Albertson D.G., Jain A.N. Hidden Markov models approach to the analysis of array CGH data. J. Multivar. Anal. 2004;90:132–153. doi:10.1016/j.jmva.2004.02.008. [Google Scholar]
- 40.Redon R., Ishikawa S., Fitch K.R., Feuk L., Perry G.H., Andrews T.D., Fiegler H., Shapero M.H., Carson A.R., Chen W., et al. Global variation in copy number in the human genome. Nature. 2006;444:444–454. doi: 10.1038/nature05329. doi:10.1038/nature05329. [DOI] [PMC free article] [PubMed] [Google Scholar]
- 41.Marioni J.C., Thorne N.P., Valsesia A., Fitzgerald T., Redon R., Fiegler H., Andrews T.D., Stranger B.E., Lynch A.G., Dermitzakis E.T., et al. Breaking the waves, improved detection of copy number variation from microarray-based comparative genomic hybridization. Genome Biol. 2007;8:R228. doi: 10.1186/gb-2007-8-10-r228. doi:10.1186/gb-2007-8-10-r228. [DOI] [PMC free article] [PubMed] [Google Scholar]
- 42.deSmith A.J., Tsalenko A., Sampas N., Scheffer A., Yamada N.A., Tsang P., Ben-Dor A., Yakhini Z., Ellis R.J., Bruhn L.,, et al. Array CGH analysis of copy number variation identifies 1284 new genes variant in healthy white males, implications for association studies of complex diseases. Hum. Mol. Genet. 2007;16:2783–2794. doi: 10.1093/hmg/ddm208. doi:10.1093/hmg/ddm208. [DOI] [PubMed] [Google Scholar]
- 43.deKovel C.G., Trucks H., Helbig I., Mefford H.C., Baker C., Leu C., Kluck C., Muhle H., vonSpiczak S., Ostertag P., et al. Recurrent microdeletions at 15q11.2 and 16p13.11 predispose to idiopathic generalized epilepsies. Brain. 2010;133:23–32. doi: 10.1093/brain/awp262. doi:10.1093/brain/awp262. [DOI] [PMC free article] [PubMed] [Google Scholar]
- 44.Winchester L., Yau C., Ragoussis J. Comparing CNV detection methods for SNP arrays. Brief Funct. Genomic Proteomic. 2009;8:353–366. doi: 10.1093/bfgp/elp017. doi:10.1093/bfgp/elp017. [DOI] [PubMed] [Google Scholar]
- 45.Scherag A., Dina C., Hinney A., Vatin V., Scherag S., Vogel C.I., Müller T.D., Grallert H., Wichmann H.E., Balkau B., et al. Two new loci for body-weight regulation identified in a joint analysis of genome-wide association studies for early-onset extreme obesity in French and German study groups. PLoS Genet. 2010;6:e1000916. doi: 10.1371/journal.pgen.1000916. doi:10.1371/journal.pgen.1000916. [DOI] [PMC free article] [PubMed] [Google Scholar]
- 46.Schaid D.J., Batzler A.J., Jenkins G.D., Hildebrandt M.A. Exact tests of Hardy–Weinberg equilibrium and homogeneity of disequilibrium across strata. Am. J. Hum. Genet. 2006;79:1071–1080. doi: 10.1086/510257. doi:10.1086/510257. [DOI] [PMC free article] [PubMed] [Google Scholar]
- 47.Spielman R.S., McGinnis R.E., Ewens W.J. Transmission test for linkage disequilibrium, the insulin gene region and insulin-dependent diabetes mellitus (IDDM) Am. J. Hum. Genet. 1993;52:506–516. [PMC free article] [PubMed] [Google Scholar]
- 48.Falk C.T., Rubinstein P. Hyplotype relative risks, an easy reliable way to construct a proper control sample for risk calculations. Ann. Hum. Genet. 1987;51:227–233. doi: 10.1111/j.1469-1809.1987.tb00875.x. doi:10.1111/j.1469-1809.1987.tb00875.x. [DOI] [PubMed] [Google Scholar]
Associated Data
This section collects any data citations, data availability statements, or supplementary materials included in this article.
Supplementary Materials
Supplementary Data