Oxidative stress in cancer associated fibroblasts drives tumor-stroma co-evolution: A new paradigm for understanding tumor metabolism, the field effect and genomic instability in cancer cells (original) (raw)
Abstract
Loss of stromal fibroblast caveolin-1 (Cav-1) is a powerful single independent predictor of poor prognosis in human breast cancer patients, and is associated with early tumor recurrence, lymph node metastasis and tamoxifen-resistance. We developed a novel co-culture system to understand the mechanism(s) by which a loss of stromal fibroblast Cav-1 induces a “lethal tumor microenvironment.” Here, we propose a new paradigm to explain the powerful prognostic value of stromal Cav-1. In this model, cancer cells induce oxidative stress in cancer-associated fibroblasts, which then acts as a “metabolic” and “mutagenic” motor to drive tumor-stroma co-evolution, DNA damage and aneuploidy in cancer cells. More specifically, we show that an acute loss of Cav-1 expression leads to mitochondrial dysfunction, oxidative stress and aerobic glycolysis in cancer associated fibroblasts. Also, we propose that defective mitochondria are removed from cancer-associated fibroblasts by autophagy/mitophagy that is induced by oxidative stress. As a consequence, cancer associated fibroblasts provide nutrients (such as lactate) to stimulate mitochondrial biogenesis and oxidative metabolism in adjacent cancer cells (the “Reverse Warburg effect”). We provide evidence that oxidative stress in cancer-associated fibroblasts is sufficient to induce genomic instability in adjacent cancer cells, via a bystander effect, potentially increasing their aggressive behavior. Finally, we directly demonstrate that nitric oxide (NO) over-production, secondary to Cav-1 loss, is the root cause for mitochondrial dysfunction in cancer associated fibroblasts. In support of this notion, treatment with anti-oxidants (such as N-acetyl-cysteine, metformin and quercetin) or NO inhibitors (L-NAME) was sufficient to reverse many of the cancer-associated fibroblast phenotypes that we describe. Thus, cancer cells use “oxidative stress” in adjacent fibroblasts (1) as an “engine” to fuel their own survival via the stromal production of nutrients and (ii) to drive their own mutagenic evolution towards a more aggressive phenotype, by promoting genomic instability. We also present evidence that the “field effect” in cancer biology could also be related to the stromal production of ROS and NO species. eNOS-expressing fibroblasts have the ability to downregulate Cav-1 and induce mitochondrial dysfunction in adjacent fibroblasts that do not express eNOS. As such, the effects of stromal oxidative stress can be laterally propagated, amplified and are effectively “contagious”—spread from cell-to-cell like a virus—creating an “oncogenic/mutagenic” field promoting widespread DNA damage.
Key words: caveolin-1, cancer associated fibroblasts, oxidative stress, reactive oxygen species (ROS), mitochondrial dysfunction, autophagy, nitric oxide (NO), DNA damage, aneuploidy, genomic instability, anti-oxidant cancer therapy, the “field effect” in cancer biology
Introduction
Caveolin-1 (Cav-1) is the principal structural component of caveolae, specialized omega-shaped plasma membrane invaginations. Cav-1 is highly expressed in terminally differentiated mesenchymal cells, such as fibroblasts, adipocytes and endothelial cells. Cav-1 is downregulated in transformed fibroblasts, in response to numerous oncogenic stimuli, such as H-Ras mutations, loss of p53 and c-Myc overexpression.1–3 Extensive data from cellular and animal models has shown that Cav-1 behaves as a transformation suppressor protein in fibroblasts.4–6
In breast cancer, a loss of stromal Cav-1 expression is one of the most important stromal biomarkers described to date, and is associated with a poor clinical prognosis. Patients that lack stromal Cav-1 have a 20% 5-year survival rate, as compared with an 80% 5-year survival rate for patients that are positive for stromal Cav-1.7 Importantly, the predictive value of stromal Cav-1 in breast cancer is independent of the status of other known epithelial breast cancer markers (ER, PR or HER2).7,8
The predictive value of stromal Cav-1 has been validated also in ductal carcinoma in situ (DCIS) patients and in triple-negative breast cancer patients. In DCIS patients, a lack of stromal Cav-1 is associated with a high-risk of early recurrence and with an 80% incidence of progression towards invasive breast cancer.9 Triple negative patients with a loss of stromal Cav-1 show a 10% 5-year survival rate, as compared with a 75.5% 5-year survival rate for patients that are positive for stromal Cav-1.10 Lack of stromal Cav-1 is also associated with poor prognosis in prostate cancer patients.11
Cancer associated fibroblasts (CAFs) are stromal cells found in cancerous tissues, which support and promote tumor growth.12 CAFs are activated cells that display myo-fibroblast features and secrete high levels of extracellular matrix proteins. Previous studies have shown that a loss of Cav-1 expression is a hallmark of the aggressive CAF phenotype.13 Mammary fibroblasts derived from Cav-1 null (−/−) mice display several CAF-like features, with enhanced contraction-retraction and increased secretion of HGF, PDGF, VEGF and collagen-I.14 Finally, transient siRNA-mediated knock-down of Cav-1 in fibroblasts is sufficient to promote a CAF-like phenotype, with activated TGFbeta signaling.15
Cav-1 is a potent inhibitor of nitric oxide (NO) synthase (NOS). Cav-1 binds to and inhibits NOS activity, thus dampening NO release in a tonic fashion.16–18 Interestingly, NOS expression is enhanced in fibroblasts during wound healing, and high iNOS expression in the stroma correlates with local and/or distant metastasis.19 NO plays important physiological roles in vascular function and the inflammatory response. However, NO over-production induces DNA damage, mitochondrial uncoupling and increased reactive oxygen species (ROS). ROS form as byproducts of oxygen metabolism in the mitochondria during electron transfer through the respiratory chain complexes.20–22 Normally, oxygen (O2) serves as the final electron acceptor and is reduced to H2O. However, occasionally during these electron transfer reactions, partially reduced or highly reactive molecules of O2 may be generated. Under normal physiological conditions, ROS are eliminated by anti-oxidant enzymes, such as superoxide dismutases, the peroxiredoxins and glutathione peroxidases.
High ROS levels may result in significant cellular damage and induce oxidative stress, which is an imbalance between ROS production and the anti-oxidant capacity of the cell. ROS and NO both potently trigger activation of hypoxia inducible factor 1α (HIF-1α), leading to hypoxic signaling, such as increased VEGF production and enhanced glycolysis. ROS-mediated HIF-1α induction is dependent on oxygen levels, whereas NO induces HIF-1α independently of oxygen levels.23–25
Glycolysis, the conversion of glucose to pyruvate, is an essential step in the metabolic pathways of mammalian cells. When oxygen levels are normal, pyruvate enters the mitochondria, is converted into acetyl-CoA by pyruvate dehydrogenase (PDH), and serves as substrate of the TCA cycle. However, when oxygen levels decrease, cells need to rely upon glycolysis for ATP production. In the 1930s, Warburg observed that cancer cells favor glycolysis even in the presence of high oxygen (aerobic glycolysis or “the Warburg effect”), thus producing high lactate levels. The Warburg effect still remains puzzling, as it is unclear why cancer cells that are in extreme need of energy would adopt an inefficient way of producing ATP. Recently, several findings have challenged the Warburg hypothesis. For example, the ability of melanoma cells to form tumors and to induce metastasis was shown to be dependent on functional mitochondria.26 When induced to depend on glycolysis by depletion of mitochondrial DNA, melanoma cells (B16ρ°) showed delayed tumor formation and complete inhibition of lung metastasis in a xenograft tumor model, suggesting that glycolysis in cancer cells does not support aggressive tumor growth.
We have recently proposed a novel model to explain tumor metabolism, termed “The Reverse Warburg Effect.”27,28 According to “The Reverse Warburg Effect,” during tumor formation, cancer cells and stromal fibroblasts dynamically co-evolve and become metabolically coupled.27,28 Cancer cells induce aerobic glycolysis in stromal fibroblasts. As a consequence, these CAFs secrete high levels of energy-rich metabolites (such as lactate and pyruvate) that are directly absorbed by tumor cells and used for efficient ATP production via oxidative phosphorylation.27,28 Thus, a loss of Cav-1 expression may be a “hallmark” of aerobic glycolysis in fibroblasts.27,28
Here, we aimed to investigate the mechanism(s) by which a loss of stromal Cav-1 exacerbates tumor cell behavior. As Cav-1 is a potent NOS inhibitor, we hypothesized that a loss of Cav-1 may trigger NO production, leading to mitochondrial dysfunction, oxidative stress and a glycolytic phenotype in CAFs. In support of this hypothesis, gene expression profiling and proteomic analysis of Cav-1 (−/−) null stromal cells have shown the upregulation of anti-oxidant pathways, suggesting that a loss of Cav-1 may induce oxidative stress.28
In this report, we evaluate how increased oxidative stress and glycolysis in the tumor microenvironment can affect cancer cell behavior. To address these issues, we have developed a novel co-culture system, consisting of normal human fibroblasts and MCF7 breast cancer cells. We have shown that in this co-culture model, MCF7 cells promote a CAF-like phenotype in adjacent fibroblasts, associated with a loss of stromal Cav-1 expression, increased expression of myofibroblast markers and increased extracellular matrix remodeling.15 To establish direct cause-effect relationships and to induce an acute loss of Cav-1, complementary experiments were also performed using an siRNA-mediated Cav-1 knock-down approach.
Based on these co-culture studies, we propose a new paradigm to explain the powerful prognostic value of stromal Cav-1. In this model, cancer cells induce oxidative stress in cancer-associated fibroblasts, which then acts as a “metabolic” and “mutagenic” motor to drive tumor-stroma co-evolution, DNA damage and aneuploidy in cancer cells. We also present compelling evidence that the “field effect” in cancer biology is related to the stromal production of ROS and NO species. As such, the effects of stromal oxidative stress can be laterally propagated, amplified and are effectively “contagious”.
Results
Cancer cells induce oxidative stress in adjacent fibroblasts: A feed-forward mechanism for Cav-1 downregulation.
The mechanism(s) by which epithelial cancer cells induce a loss of stromal Cav-1 protein expression remain unknown. Here, we employed a co-culture system consisting of (i) human breast cancer cells (MCF7) and (ii) human fibroblasts (immortalized with hTERT) to study this phenomenon. In this co-culture system, MCF7 cells acutely induce the downregulation of Cav-1 expression,15 mimicking what occurs in the tumor stroma in high-risk breast cancer patients. Interestingly, we were not able to detect a loss of stromal Cav-1 levels when fibroblasts and MCF7 cells were physically separated, using Transwell cell culture inserts or when fibroblasts were cultured in conditioned media from MCF7 cells. These results suggest that such cross-talk between fibroblasts and cancer cells is mediated either by cell-cell contact or by transient diffusible factors with a very short half-life.
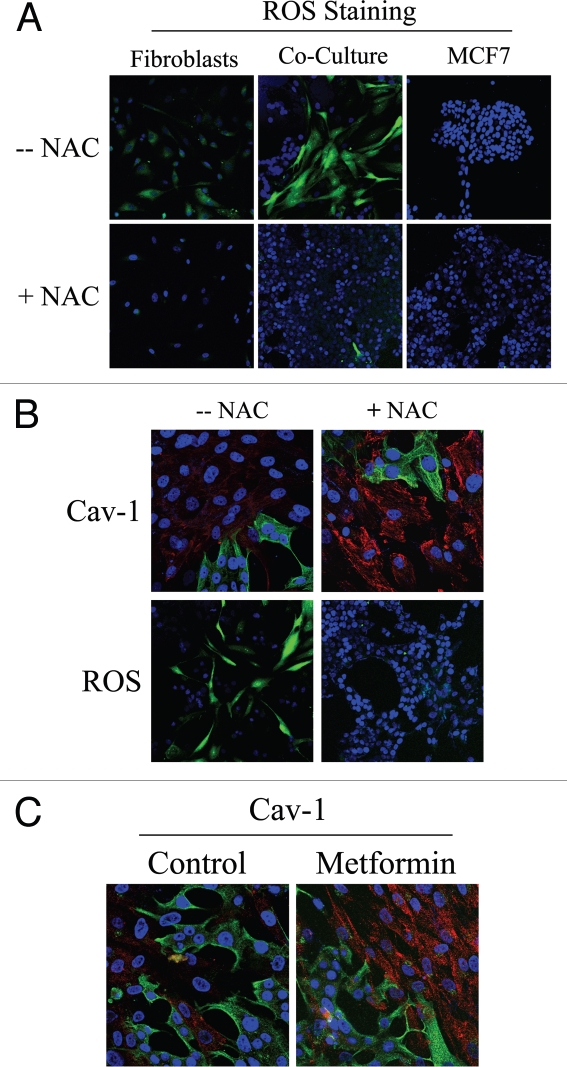
As gene expression profiling and proteomic analysis of Cav-1 (−/−) null stromal cells showed the upregulation of anti-oxidant enzymes, we tested the hypothesis that stromal Cav-1 downregulation promotes oxidative stress in CAFs. For this purpose, we evaluated if co-cultured fibroblasts exhibit increased ROS levels. DCFDA staining is a widely used method to measure intracellular ROS. DCFDA staining was performed on fibroblast-epithelial co-cultures, as well as on homotypic cultures of fibroblasts and MCF7 cells. Figure 1A shows that ROS levels are greatly increased in fibroblasts in co-culture, as compared to homotypic cultures of fibroblasts or MCF7 cells alone (upper panels). These results directly demonstrate that tumor cells promote oxidative stress in adjacent fibroblasts. Importantly, we show that ROS accumulation is abolished by treatment with the ROS scavenger, N-Acetyl-Cysteine (NAC) (Fig. 1A, lower panels).
Figure 1.
Cancer cells induce ROS production in fibroblasts, driving stromal Cav-1 downregulation: Rescue with anti-oxidants. (A) ROS are elevated in fibroblasts co-cultured with MCF7 cells. To detect ROS generation, CM-H2DCFDA staining (green) was performed on hTERT-fibroblasts co-cultured with MCF7 cells. Also, mono-cultures of hTERT-fibroblasts and MCF7 cells were stained in parallel. Cells were counterstained with Hoechst nuclear stain (blue). Samples were then immediately imaged using a 488 nm excitation wavelength. As a critical control, in a parallel set of experiments, cells were pre-incubated with the ROS scavenger NAC. Note that ROS are generated mainly in co-cultured fibroblasts (upper middle panel) and NAC treatment completely abrogates ROS production. Minimal amounts of ROS were detected in singly cultured cells. Importantly, images were acquired using identical exposure settings. Original magnification, 20x. (B) Treatment with the ROS scavenger NAC restores Cav-1 expression in co-cultured fibroblasts. Day 5 fibroblast-MCF7 co-cultures were incubated with the ROS scavenger NAC (10 mM, right panels) or with vehicle alone (left panels). Upper panels. Co-cultures were fixed and immunostained with anti-Cav-1 (red) and anti-K8/18 (green, detecting tumor epithelial cells) antibodies. DAPI was used to stain nuclei (blue). Note that Cav-1 levels are decreased in fibroblasts in co-culture (left upper panel) and the ROS scavenger NAC blocks the Cav-1 downregulation (right upper panel). Lower panels. In a parallel experiment, CM-H2DCFDA (green) was used to detect ROS generation. Cells were stained with Hoechst nuclear stain (blue). Importantly, images were acquired using identical exposure settings. Original magnification, 40x for upper panels, 20x for lower panels. (C) Treatment with the antioxidant metformin upregulates Cav-1 in co-cultured fibroblasts. Day 5 hTERT-fibroblast-MCF7 cell co-cultures were incubated with metformin or with vehicle alone (control). Co-cultures were fixed and immunostained with anti-Cav-1 (red) and anti-K8/18 (green) antibodies. DAPI was used to stain nuclei (blue). Note that metformin blocks the Cav-1 downregulation that normally occurs in fibroblasts in co-culture. Importantly, images were acquired using identical exposure settings. Original magnification, 40x.
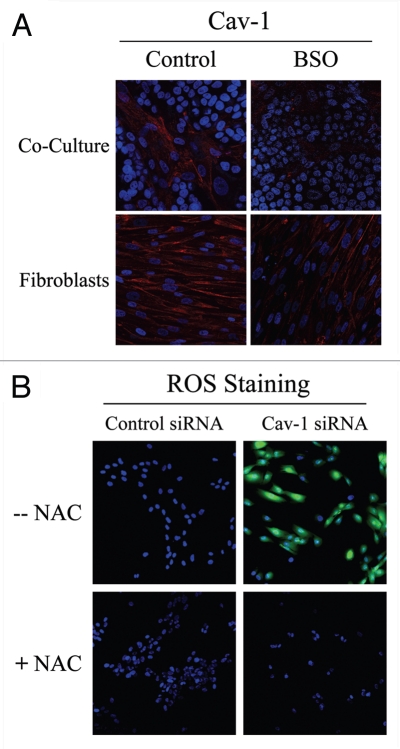
To determine if Cav-1 levels are downregulated by oxidative stress, we next assessed if treatment with the ROS scavenger NAC prevents Cav-1 downregulation. For this purpose, fibroblast-MCF7 co-cultures were treated with NAC (10 mM) or vehicle alone for 16 hours prior to either Cav-1 or ROS staining. Figure 1B shows that NAC treatment restores Cav-1 expression in co-cultured fibroblasts, as compared to controls. As expected, NAC treatment abolishes ROS staining. Similarly, Cav-1 expression was restored when co-cultures were incubated with the antioxidant metformin (50 µM) for 24 hours (Fig. 1C). Previous studies have shown that metformin is a complex I inhibitor that blocks mitochondrial-dependent ROS production.29,30 Opposite effects were observed upon treatment with the pro-oxidant buthionine sulfoximine (BSO), a potent inhibitor of glutathione synthesis. Figure 2A shows that Cav-1 is downregulated in co-cultured fibroblasts and in fibroblasts alone, upon incubation with 1 µM BSO, suggesting that ROS are sufficient to induce Cav-1 downregulation.
Figure 2.
Glutathione depletion is sufficient to induce Cav-1 downregulation and Cav-1 knock-down induces ROS production: A feed-forward mechanism for oxidative stress. (A) treatment with the glutathione synthase inhibitor BSO downregulates Cav-1 in fibroblasts. Fibroblast-MCF7 co-cultures and hTERT-fibroblast homotypic cultures were incubated with vehicle alone (control) or with the glutathione synthaset inhibitor BSO (1 µM), which generates ROS via glutathione depletion. Cells were fixed and immuno-stained with anti-Cav-1 (red) antibodies. DAPI was used to stain nuclei (blue). Note that BSO treatment decreases Cav-1 levels in co-cultured fibroblasts and homotypic cultures. Importantly, images were acquired using identical exposure settings. original magnification, 40x. (B) Cav-1 knock-down induces ROS production. CM-H2DCFDA staining (green) was performed on hTERT-fibroblasts treated with Cav-1 siRNA (right) or control siRNA (left). Cells were counterstained with Hoechst nuclear stain (blue). Samples were then immediately imaged using a 488 nm excitation wavelength. As a critical control, cells were pre-incubated with the ROS scavenger NAC in parallel. Note that Cav-1 knock-down greatly promotes ROS generation. As expected, NAC blocks ROS accumulation. Importantly, images were acquired using identical exposure settings. Original magnification, 20x.
To evaluate if loss of Cav-1 is sufficient to induce a rise in ROS levels, we performed DCFDA staining on hTERT-fibroblasts treated with Cav-1 siRNA or control siRNA. As a control, cells were incubated with NAC in parallel. Interestingly, Figure 2B shows that Cav-1 knock-down induces a dramatic rise in ROS levels, which is abolished by NAC treatment. Conversely, ROS staining is undetectable in control siRNA-treated cells. Taken together, our results from the co-culture model and Cav-1 knockdown experiments demonstrate that Cav-1 expression and ROS levels are under “positive feed-forward control”, such that a rise in ROS levels decreases Cav-1 expression and reduced Cav-1 levels are sufficient to drive further ROS generation.
Cancer cells promote DNA damage in CAFs via Cav-1 downregulation.
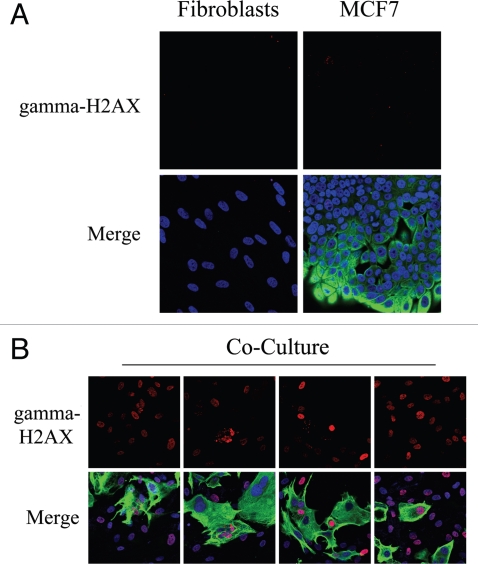
High levels of ROS promote DNA damage.31 As co-cultured fibroblasts display increased ROS levels, we next immuno-stained fibroblast-MCF7 co-cultures with an antibody directed against a marker of DNA-double-strand breaks, namely gamma-H2AX (H2AX phosphorylated at S139). Figure 3A shows that gamma-H2AX is undetectable in homotypic cultures of fibroblasts and MCF7 cells. However, in co-cultures, gamma-H2AX is highly induced in most fibroblasts, which are the main site of ROS accumulation, as well as in many adjacent MCF7 cells (Fig. 3B). These results suggest that in tumors, oxidative stress promotes DNA double strand breaks in CAFs.
Figure 3.
Fibroblast-MCF7 co-cultures show increased DNA damage, as evidenced by DNA double strand break foci. (A and B) Increased gamma-H2AX staining in co-cultured fibroblasts. To detect DNA double strand breaks, co-cultures of hteRt-fibroblasts and MCF7 cells and corresponding homotypic cultures were immunostained with anti-gamma-H2AX (red) and anti-K8/18 (green, detecting tumor epithelial cells) antibodies. DAPI was used to stain nuclei (blue). Importantly, images were acquired using identical exposure settings. Upper panels show only the red channel to appreciate gamma-H2AX staining, while the lower panels show the merged images. (A) Gamma-H2AX is undetectable in mono-cultures of fibroblasts and MCF7 cells. (B) High levels of DNA double strand breaks are detected in most co-cultured fibroblasts and in many MCF7 cells. Original magnification, 40x.
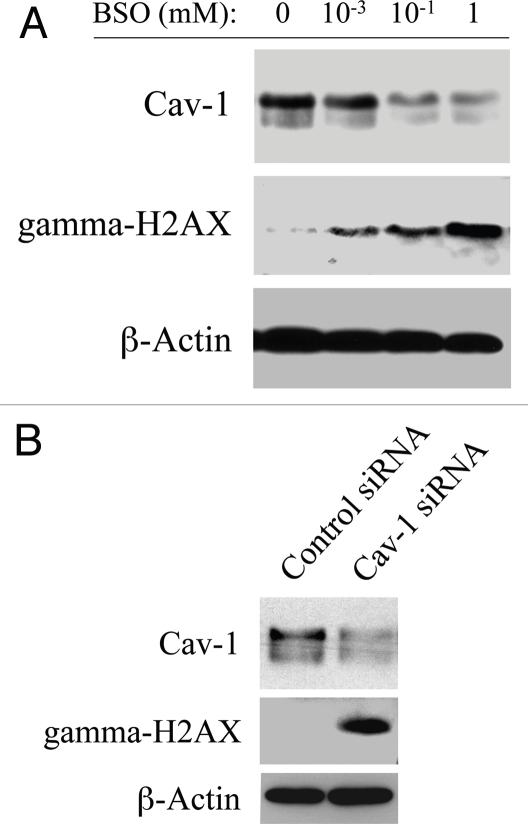
To mimic oxidative stress, hTERT-fibroblasts were treated with increasing concentrations of the glutathione inhibitor (BSO) or with vehicle alone for 24–48 hours. Then, cells were subjected to western blot analysis with antibodies directed against Cav-1 and gamma-H2AX. Figure 4A shows that BSO-treatment downregulates Cav-1 expression and increases gamma-H2AX levels in a concentration-dependent fashion, suggesting a correlation between Cav-1 downregulation and the generation of DNA double strand breaks. To clearly demonstrate a cause-effect relationship, hTERT-fibroblasts treated with Cav-1 siRNA or control siRNA were subjected to western blot analysis using antibodies against Cav-1 and gamma-H2AX. Figure 4B shows that siRNA-mediated Cav-1 downregulation is sufficient to greatly promote DNA double strand breaks. These results suggest that cancer cells induce Cav-1 downregulation in adjacent fibroblasts, leading to oxidative stress and DNA damage.
Figure 4.
Loss of Cav-1 and oxidative stress both induce DNA damage in fibroblasts. (A) BSO promotes Cav-1 downregulation and DNA double strand breaks. To induce oxidative stress, hTERT-fibroblasts were grown in 10% NuSerum and treated with increasing concentrations of the glutathione synthase inhibitor BSO or with vehicle alone (H2O) for 24–48 hours. Then, cells were subjected to western blot analysis with antibodies against Cav-1 and gamma-H2AX. β-actin was used as an equal loading control, and remained unchanged after 24 and 48 hours of BSO treatment. Note that BSO treatment downregulates Cav-1 expression levels and promotes DNA double strand breaks in a concentration-dependent fashion. Consistent with the idea that Cav-1 has a very long half-life, Cav-1 downregulation is detected only after 48 hours of BSO treatment. Conversely, gamma-H2AX levels are increased already after 24 hours of BSO treatment. (B) Cav-1 knock-down promotes DNA double strand breaks. hTERT-fibroblasts treated with Cav-1 siRNA or control siRNA were subjected to Western blot analysis using antibodies against Cav-1 and gamma-H2AX. β-actin was used as an equal loading control. Note that siRNA-mediated Cav-1 downregulation is sufficient to greatly induce DNA double strand breaks.
Fibroblasts induce aneuploidy in co-cultured MCF7 cells.
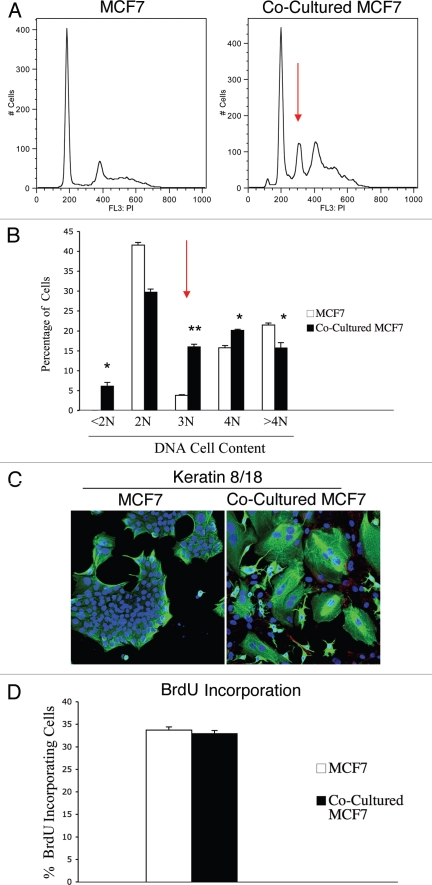
Increased ROS levels are known to promote genetic instability and induce aneuploidy in tumor cells.31 As we demonstrated above, that our co-culture system displays increased ROS levels, we also evaluated if fibroblasts promote genetic changes in co-cultured MCF7 cells. To this end, we monitored the DNA cell content of co-cultured MCF7 cells compared to homotypic cultures. GFP tagged-MCF7 cells were co-cultured with hTERT-fibroblasts for 48 hours and sorted to purify the GFP (+) population. Sorted cells were then stained with PI and analyzed by FACS analysis. As a critical control, homotypic cultures of GFP tagged-MCF7 cells were sorted and stained with PI in parallel. Figure 5A shows that the co-cultured MCF7 cells display a strong aneuploidy peak (abnormal DNA cell content) of ∼3N, as compared to MCF7 cells cultured alone. Quantification of the percentage of cells with a given DNA cell content is shown in Figure 5B. Co-cultured MCF7 cells show a greater than 4-fold increase in the 3N population. In addition, co-cultured MCF7 cells exhibit an increase in the 4N population, suggesting either higher proliferation or higher rates of endomitosis (nuclear division without cellular division). To discriminate among these two possibilities, we first immuno-stained fibroblast-MCF7 co-cultures with antibodies against keratin 8/18 (K8/18), to visualize MCF7 cells morphology, and Cav-1, to visualize CAFs. Figure 5C shows that co-culture with fibroblasts generates giant MCF7 cells and induces multi-nucleation in MCF7 cells. Co-cultured fibroblasts displayed very low Cav-1 levels, as expected.
Figure 5.
Fibroblasts induce aneuploidy in co-cultured MCF7 cells. (A and B) DNA cell content analysis. GFp (+) MCF7 cells were plated in mono-culture or in co-culture with hteRt-fibroblasts. the day after, media was changed to DMEM with 10% NuSerum and cells were grown for 48 hours. then, to isolate the GFP (+) MCF7 cell population from the fibroblasts, co-cultured cells were FACS-sorted using a 488 nm laser. As a critical control, mono-cultures of GFP (+) MCF7 cells were sorted in parallel. Then, sorted cells were fixed and stained with PI. DNA cell content was analyzed by flow cytometry. (A) Representative traces. Note that co-culture with fibroblasts induces the appearance of a large aneuploid peak (cells with an abnormal DNA content of ∼3N) in MCF7 cells (red arrow). In addition, a larger population of cells with DNA content of 4N is detected in co-cultured MCF7 cells compared to MCF7 cell mono-cultures. (B) Cell numbers with a given DNA cell content were determined and graphed as a percentage of the total population. *p < 0.01, **p < 0.0000003. (C) Immunofluorescence. MCF7 cells were grown in mono-culture or in co-culture with hTERT-fibroblasts for 5 days. Then, cells were fixed and immunostained with antibodies directed against Cav-1 (red, labeling fibroblasts) and K8/18 (green, labeling MCF7 cells). Nuclei were counterstained with DAPI (blue). Note that many MCF7 cells in co-culture are multinucleated, suggesting that in co-culture a sub-population of MCF7 cells undergo nuclear, but not cellular division. Note also that Cav-1 expression is very low in co-cultured fibroblasts, as expected. original magnification, 20x. (D) BrdU incorporation. To evaluate proliferation, GFP (+) MCF7 cells were grown in co-culture with hTERT-fibroblasts or in mono-culture for 48 hours. Then, cells were pulsed-labeled with BrdU for one hour, sorted to purify the GFP (+) cells and fixed overnight. BrdU incorporation was analyzed by flow cytometry. Co-culture with fibroblasts does not affect proliferation of MCF7 cells. Columns, relative BrdU incorporation from at least three independent experiments; bars, SEM.
To evaluate proliferation rates, GFP (+) MCF7 cells were co-cultured with hTERT-fibroblasts for 48 hours or cultured alone, incubated with BrdU for 1 hour and then sorted to isolate the GFP (+) population. BrdU incorporation was assessed by FACS analysis. Figure 5D shows that co-culture with fibroblasts does not affect the proliferation rates of MCF7 cells. Take together, these results suggest that CAFs are sufficient to mutagenize adjacent cancer cells, and to promote the formation of giant multi-nucleated cells, without affecting proliferation rates.
Co-cultured MCF7 cells mount an anti-oxidant defense which protects them from apoptosis.
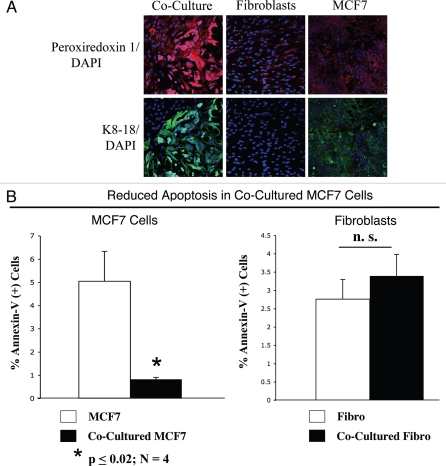
Excessive oxidative stress may induce cellular damage. Thus, we evaluated if cancer cells in co-culture adopted compensatory mechanisms, with the upregulation of anti-oxidant enzymes, such as peroxiredoxin-1. Previous studies have shown that peroxiredoxin-1 protects against oxidative-stress induced apoptosis in MCF7 cells.32 To this end, fibroblast-MCF7 co-cultures and corresponding homotypic cultures were immunostained with an anti-peroxiredoxin-1 antibody. Figure 6A shows that mono-cultures of fibroblasts and MCF7 cells display very low expression levels of peroxiredoxin-1. However, peroxiredoxin-1 levels are greatly increased in co-cultured MCF7 cells and only slightly increased also in co-cultured fibroblasts. These results suggest that tumor cells react to oxidative stress by the compensatory upregulation of anti-oxidant enzymes, such as peroxiredoxin-1, preventing apoptosis.
Figure 6.
MCF7 cancer cells mount an anti-oxidant defense when co-cultured with fibroblasts, protecting them from apoptosis. (A) Increased expression of peroxiredoxin-1 in co-cultured MCF7 cells. Day 5 co-cultures of hTERT-fibroblasts and MCF7 cells and the corresponding homotypic cultures were immunostained with anti-peroxiredoxin-1 (red) and anti-K8/18 (green, detecting tumor epithelial cells) antibodies. DAPI was used to stain nuclei (blue). Upper panels show only the red channel to appreciate peroxiredoxin 1 staining, while the lower panels show the merged images. Note that the expression level of peroxiredoxin-1 is very low in homotypic cultures of fibroblasts and MCF7 cells. However, peroxiredoxin-1 levels are greatly increased in co-cultured MCF7 cells. Importantly, images were acquired using identical exposure settings. Original magnification, 20x. (B) Reduced apoptosis in MCF7 co-cultures. Co-cultures of hTERT-fibroblasts and GFP (+) MCF7 cells and the corresponding homotypic cultures were subjected to annexin-V staining and then analyzed by FACS. Thus, the GFP (+) and GFP (−) cells represent MCF7 cells and hTERT-fibroblasts, respectively. Note that MCF7 cells maintained in co-culture show an ∼6-fold reduction in apoptosis, as compared to MCF7 cells cultured alone. Although co-cultured fibroblasts do not show a significant change in apoptosis rates, there still must be a high level of protection, as the co-cultured fibroblasts show the largest increases in ROS production and DNA damage, without any increases in apoptosis.
To test this hypothesis directly, co-cultures of hTERT-fibroblasts and GFP (+) MCF7 cells and the corresponding homotypic cultures were subjected to annexin-V staining and then analyzed by FACS. Thus, the GFP(+) and GFP(−) cells represent MCF7 cells and hTERT-fibroblasts, respectively. Importantly, Figure 6B shows that MCF7 cells maintained in co-culture demonstrate a 6-fold reduction in apoptosis, as compared to MCF7 cells cultured alone. In contrast, co-cultured fibroblasts do not show a significant change in apoptosis rates. However, there still must be a high level of protection against apoptosis, as the co-cultured fibroblasts show the largest increases in ROS production (Fig. 1A) and DNA damage (Fig. 3B), without any increases in apoptosis.
Cav-1 knock-down leads to mitochondrial dysfunction in fibroblasts.
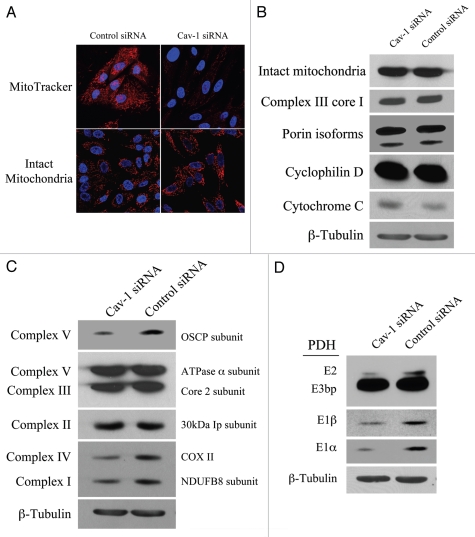
Our results above show that in the co-culture system, Cav-1 is downregulated, inducing oxidative stress. As the mitochondrial respiratory chain is a major source of intracellular ROS, we assessed if a loss of Cav-1 affects mitochondrial function in fibroblasts. To this end, Cav-1 siRNA or control siRNA treated hTERT-fibroblasts were stained either with the mitochondrial dye MitoTracker (which exclusively detects functional mitochondria with an active membrane potential) or with an antibody directed against a mitochondrial membrane marker (MAB1273, detects mitochondrial mass, independently of activation). Figure 7A shows that transient Cav-1 knock-down induces a large decrease in mitochondrial activity (MitoTracker staining), without affecting mitochondrial mass (intact mitochondria antibody). To further validate that Cav-1 knock-down does not impair mitochondrial integrity, western blot analysis was performed on Cav-1 siRNA or control siRNA treated hTERT-fibroblasts with a panel of antibodies raised against proteins of different mitochondrial compartments. Figure 7B shows that Cav-1 knock-down does not affect the expression levels of molecules at the surface of intact mitochondria (MAB1273), the inner mitochondrial membrane (complex III Core1), the outer mitochondrial membrane protein (porin isoforms), the matrix space (cyclophilin D), and the intermembrane space (cytochrome C).
Figure 7.
Loss of Cav-1 induces mitochondrial dysfunction in fibroblasts. (A) Cav-1 knock-down decreases mitochondrial activity. hTERT-fibroblasts were treated with Cav-1 siRNA (right) or control siRNA (left). Then, functional mitochondria with active membrane potential were visualized using MitoTracker staining (red, upper panels). In parallel, to visualize mitochondrial mass, cells were fixed and immunostained with an anti-intact mitochondrial membrane antibody (Red, lower panels). DAPI was used to stain nuclei (blue). Note that transient Cav-1 knock-down greatly decreases mitochondrial activity, without affecting mitochondrial biogenesis. Importantly, paired images were acquired using identical exposure settings. original magnification, 63x. (B) Cav-1 knock-down does not affect mitochondrial structural integrity. hTERT-fibroblasts treated with Cav-1 siRNA or control siRNA were subjected to Western blot analysis using a panel of antibodies evaluating the mitochondrial membrane integrity. This panel includes antibodies against the surface of intact mitochondria, the inner mitochondrial membrane (complex III Core1), the outer mitochondrial membrane protein (porin isoforms), the matrix space (cyclophilin D) and the intermembrane space (cytochrome C). β-tubulin was used as an equal loading control. Note that Cav-1 knock-down does not affect the status of the mitochondrial membrane integrity. (C) Cav-1 knock-down impairs oxidative phosphorylation in fibroblasts. The oxidative phosphorylation (OXPHOS) profile was evaluated by Western blot analysis on hTERT-fibroblasts treated with Cav-1 siRNA or control siRNA. The OXPHOS panel includes antibodies against the subunits of complexes (I–V) that are labile when the respective complex is improperly assembled. β-tubulin was used as an equal loading control. Note that the levels of the subunits of complex I, IV and V are decreased in Cav-1 knock-down cells. (D) Cav-1 knock-down downregulates PDH subunits in fibroblasts. hTERT-fibroblasts treated with Cav-1 siRNA or control siRNA were analyzed by Western blot using antibodies against PDH subunits. β-tubulin was used as an equal loading control. Note that Cav-1 knock-down decreases the expression of three PDH subunits (E1α, E1β and E2).
To assess if Cav-1 regulates mitochondrial function, we evaluated the status of oxidative phosphorylation in hTERT-fibroblasts treated with Cav-1 siRNA or control siRNA. To this end, we performed western blot analysis with a panel of antibodies (OXPHOS, oxidative phosphorylation) against subunits that are labile when the respiratory chain complexes they belong to are not properly assembled. Thus, it is believed that altered expression levels of these subunits reflect defects in the assembly of the respective complex. Figure 7C shows that the subunits of complex I, complex IV and complex V are significantly decreased in Cav-1 knock-down fibroblasts, suggesting that those complexes are somehow dysfunctional.
PDH catalyzes the oxidative de-carboxylation of pyruvate to acetyl-CoA, allowing the TCA cycle to proceed. Cells with impaired oxidative phosphorylation frequently have decreased PDH activity. To determine if a loss of Cav-1 impairs PDH activity, we assessed expression levels of PDH subunits on fibroblasts treated with Cav-1 siRNA or control siRNA. Figure 7D shows that Cav-1 knock-down decreases the levels of E1alpha, E1beta and E2 subunits of the PDH complex, suggesting that a loss of Cav-1 is associated with decreased PDH enzymatic function.
Cav-1 downregulation drives aerobic glycolysis in fibroblasts.
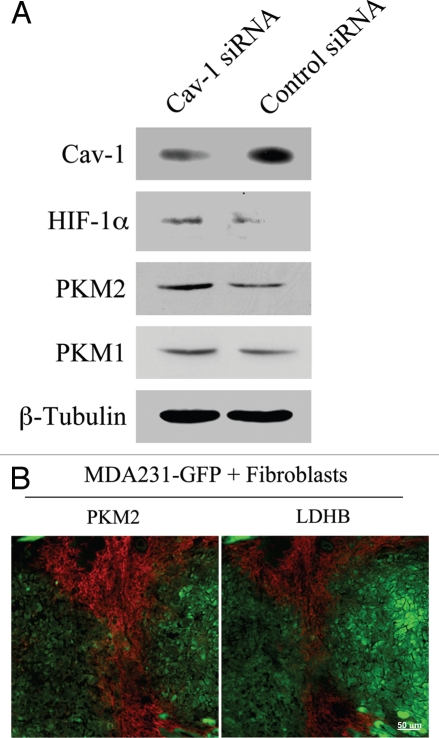
Oxidative stress induces HIF-1α activation and aerobic glycolysis. As loss of Cav-1 leads to impaired mitochondrial activity and increased ROS levels, we next asked if Cav-1 knock-down drives increased glycolysis in fibroblasts. To this end, Cav-1 siRNA or control siRNA treated hTERT-fibroblasts were analyzed by western blot using antibodies against two master regulators of glycolysis, HIF-1α and pyruvate kinase M2 (PKM2). HIF-1α is a transcription factor that drives glycolytic metabolism during hypoxia. PKM is the rate-limiting enzyme of glycolysis generating pyruvate. PKM2 is the fetal isoform expressed in tumors, whereas PKM1 is the isoform expressed in normal adult tissues. PKM2 is required for aerobic glycolysis (the Warburg effect) and was shown to promote tumor growth.33 Figure 8A shows that the levels of HIF-1α and PKM2, but not PKM1, are significantly increased in Cav-1 knock-down cells, suggesting that a loss of Cav-1 drives a glycolytic-switch in fibroblasts.
Figure 8.
Cancer associated fibroblasts undergo a glycolytic switch in vitro and in vivo. (A) Cav-1 knock-down induces increased expression of glycolysis regulators in fibroblasts. hTERT-fibroblasts treated with Cav-1 siRNA or control siRNA were subjected to Western blot analysis with antibodies against HIF-1α, PKM2 and PKM1. Note that Cav-1 knock-down increases the expression of HIF-1α and PKM2, two master regulators of aerobic glycolysis in tumors. No significant differences in PKM1 levels were detected. β-tubulin was used as an equal loading control. (B) PKM2 and LDHB are expressed in the stroma of MDA-MB-231 cell xenografts. hTERT-fibroblasts and the highly aggressive human breast cancer cell line (MDA-MB-231) were co-injected in nude mice. After 2 weeks, xenograft tumors were harvested and analyzed by immunohistochemistry using PKM2 and LDHB antibodies (red). The MDA-MB-231 tumor cells were GFp (+) (green) and were detected by autofluorescence. Note that the two glycolytic enzymes PKM2 and LDHB are preferentially expressed in the tumor stroma. Consecutive frozen sections were stained in parallel
To assess if a glycolytic switch also occurs in vivo in the tumor stroma, GFP(+) MDA-MB-231 breast cancer cells were co-injected with hTERT-fibroblasts in nude mice. After 2 weeks, tumors were collected and analyzed by immunohistochemistry for the expression of glycolytic enzymes. Figure 8B shows high expression of PKM2 and lactic dehydrogenase B (LDHB) in the stroma of human tumor xenografts. These results directly demonstrate that in vivo two key glycolytic enzymes PKM2 and LDHB are preferentially expressed in CAFs, strongly indicating that glycolysis preferentially occurs in the tumor's stromal compartment. Thus, our data indicate that tumor cells induce important changes in adjacent fibroblasts, including a loss of Cav-1, oxidative stress and metabolic alterations, with inhibition of mitochondrial function and enhanced glycolysis.
Fibroblast-MCF7 co-cultures show dramatic changes in mitochondrial mass: Evidence that the Warburg effect in cancer cells is an in vitro artifact.
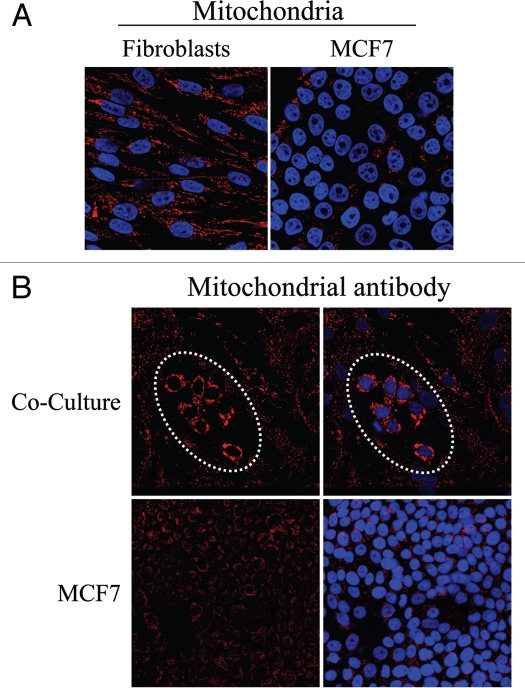
As Cav-1 knock-down impairs mitochondrial activity while promoting glycolysis, we next evaluated the status of mitochondrial mass in fibroblast-MCF7 co-cultures, where Cav-1 is downregulated in fibroblasts. To this end, fibroblast-MCF7 co-cultures and corresponding mono-cultures were immuno-stained with an antibody directed against the intact mitochondrial membrane (MAB1273). Figure 9A shows that mono-cultures of fibroblasts display a high mitochondrial mass, while homotypic cultures of MCF7 cells exhibit low mitochondrial mass. This is consistent with the “traditional view” that cancer cells undergo aerobic glycolysis and repress mitochondrial function (the Warburg effect).
Figure 9.
Fibroblasts induce increased mitochondrial mass in co-cultured MCF7 cells: Evidence that the conventional Warburg effect is an artifact. (A) In mono-cultures, mitochondria mass is lower in MCF7 cells as compared to fibroblasts. Homotypic cultures of MCF7 cells and hTERT-fibroblasts were immunostained with antibodies against an anti-intact mitochondrial membrane antibody (red). DAPI was used to stain nuclei (blue). Note that the mitochondrial mass is lower in mono-cultures of MCF7 cells, as compared to fibroblasts. Importantly, images were acquired using identical exposure settings. Original magnification, 40x. (B) Fibroblasts increase mitochondrial mass in co-cultured MCF7 cells. Co-cultures of hTERT-fibroblasts and MCF7 cells were fixed and immunostained with anti-intact inner mitochondrial membrane (red) antibody. DAPI was used to stain nuclei (blue). Note that co-culture with fibroblasts induces a significant increase in mitochondrial mass in the “central MCF7 cell colony”, encircled by a white dotted oval. Importantly, images were acquired using identical exposure settings. Original magnification, 20x.
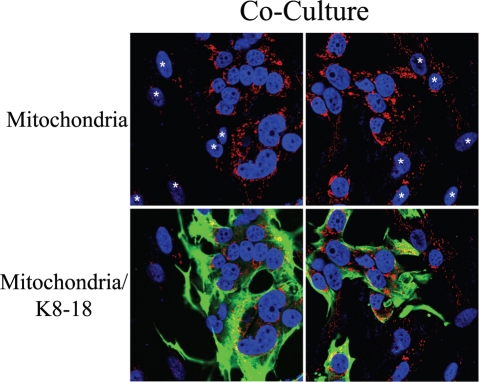
However, Figure 9B shows that in co-culture, MCF7 cells exhibit very high levels of mitochondrial staining, as compared to the surrounding fibroblasts. To directly identify MCF7 cells, fibroblast-MCF7 co-cultures were immuno-stained with antibodies directed against the intact mitochondrial membrane (MAB1273) and K8/18. Figure 10 corroborates the idea that in co-culture, mitochondria are very abundant in MCF7 cells as compared to adjacent fibroblasts. We also observe that mitochondria in co-cultured MCF7 cells are greatly increased, as compared to homotypic cultures of MCF7 cells (compare Fig. 9A and 10, which were acquired using identical settings). Conversely, mitochondria are decreased in co-cultured fibroblasts compared to homotypic cultures (compare again Fig. 9A and 10). These results indicate that in the co-culture model, that mimics the tumor microenvironment, fibroblasts inactivate oxidative respiration and undergo a glycolytic switch, while MCF7 cells expand their mitochondrial mass to satisfy an increased metabolic demand. These results are consistent with a novel view of tumor metabolism, which we have termed the “Reverse Warburg Effect”. According to this novel hypothesis, cancer-associated fibroblasts, not neoplastic cells, undergo aerobic glycolysis to generate energy-rich metabolites (such as lactate and pyruvate), which are directly used by tumor cells to efficiently support their oxidative phosphorylation.
Figure 10.
Fibroblasts induce increased mitochondrial mass in co-cultured MCF7 cells: Double-labeling with keratin shows co-segregation with mitochondrial mass. Mitochondrial mass is low in fibroblasts and elevated in MCF7 cells in co-culture. Co-cultures of hTERT-fibroblasts and MCF7 cells were fixed and immunostained with anti-intact inner mitochondrial membrane (red) and anti-K8/18 (green) antibodies. DAPI was used to stain nuclei (blue). Note that in co-culture the mitochondrial mass is low in fibroblasts but elevated in MCF7 cells. Stars denote fibroblast nuclei. Importantly, images were acquired using identical exposure settings used in Figure 9. original magnification, 63x.
To dissect the mechanisms by which co-cultured fibroblasts lose their mitochondria, we investigated the possibility that autophagy decreases mitochondrial mass in fibroblasts. To this end, fibroblast-MCF7 co-cultures and corresponding mono-cultures were immuno-stained with an antibody directed against LC3A/B, a marker of autophagy. Upon stimulation, cytosolic LC3 is known to be activated and translocates to autophagosomal vesicles. Note that none or very little LC3A/B staining is detected in homotypic cultures of fibroblasts and cancer cells (Fig. 11A). Conversely, Figure 11B shows that LC3A/B is clearly localized to autophagocytic vesicles in co-cultured fibroblasts, suggesting that autophagy may play a role in decreasing mitochondrial mass in the tumor microenvironment. In this context, it is important to note that oxidative stress and HIF-activation are both known to be sufficient to induce the autophagic destruction of mitochondria, by a process called mitophagy. So, autophagy in stromal fibroblasts may be operating to allow the “glycolytic switch” to occur.
Figure 11.
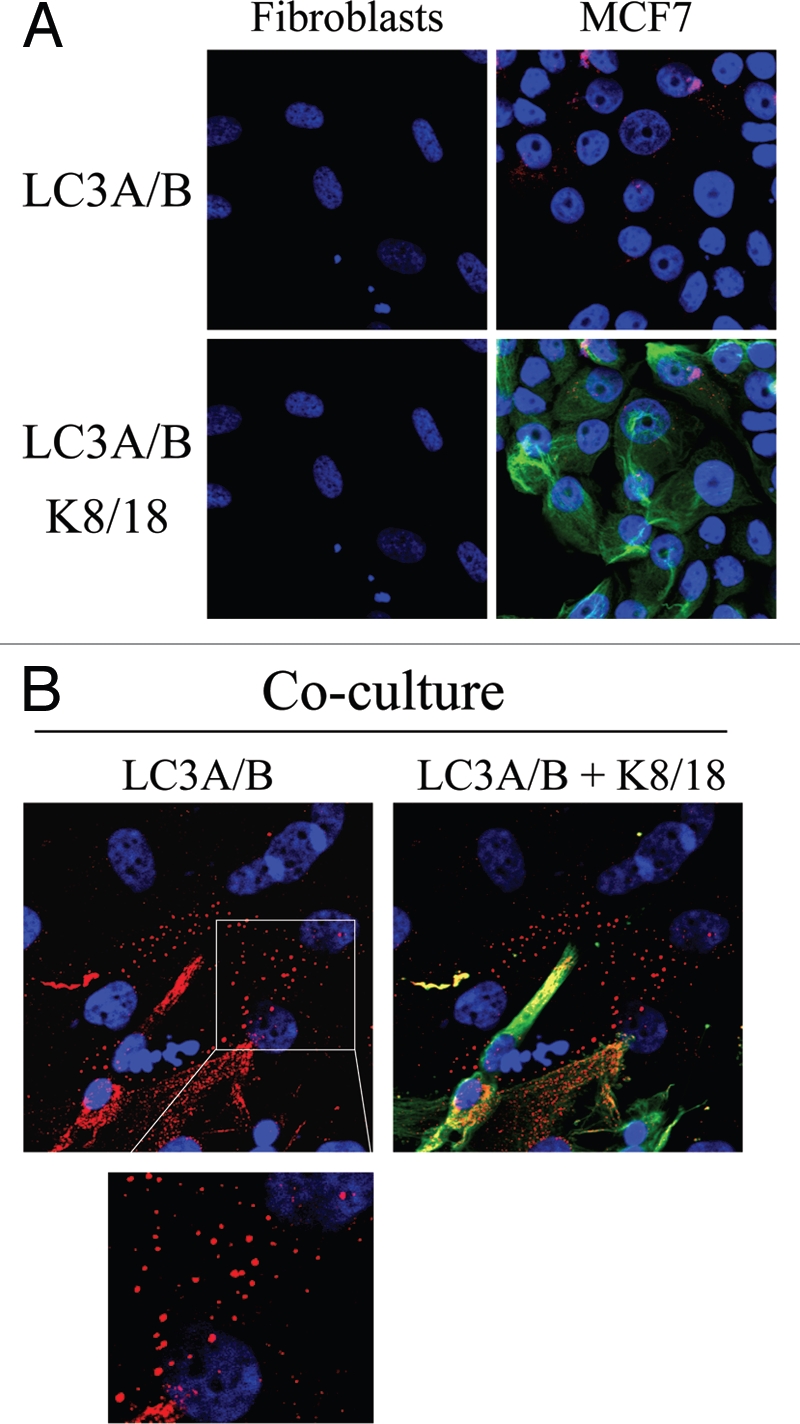
Possible role of stromal autophagy in decreasing mitochondrial mass in co-cultured fibroblasts. (A and B). hTERT-fibroblast-MCF7 cell co-cultures and corresponding mono-cultures were fixed and immunostained with anti-LC3 (red) and anti-K8/18 (green) antibodies. DAPI was used to stain nuclei (blue). (A) None or very little LC3A/B staining is detected in homotypic cultures of fibroblasts and MCF7 cells. (B) Note that LC3 is localized to autophagocytic vesicles in co-cultured fibroblasts, suggesting that mitochondrial loss could be mediated by autophagy. Original magnification, 63x.
Lactate administration promotes mitochondrial biogenesis in MCF7 cells.
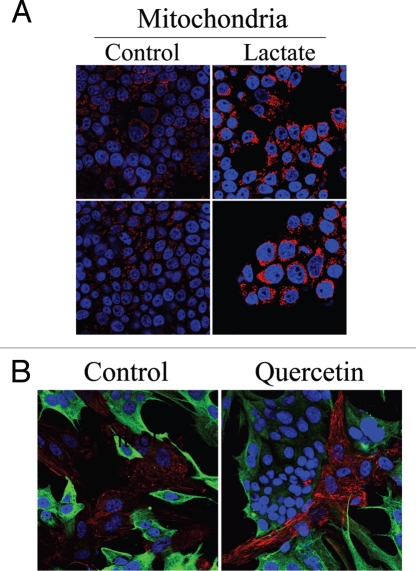
We have shown above that co-culture with fibroblasts is sufficient to expand mitochondrial mass in MCF7 cells. Previous gene profiling studies of Cav-1 (−/−) null stromal cells have shown high expression levels of the monocarboxylate transporter-1 (MCT-1; a lactate transporter) and of several glycolytic enzymes,28 suggesting that Cav-1 (−/−) null fibroblasts preferentially utilize aerobic glycolysis and secrete high levels of lactate. Thus, we evaluated if the increased mitochondrial mass in co-cultured MCF7 cells could be pheno-copied by lactate administration. To this end, homotypic cultures of MCF7 cells were treated with lactate (10 mM) for 48 hours and immunostained with an antibody against the intact mitochondrial membrane (MAB1273). Figure 12A shows that lactate administration greatly increases mitochondrial mass in MCF7 cells, as predicted. These results suggest that both (1) co-culture with fibroblasts and (2) lactate administration similarly promote mitochondrial biogenesis in MCF7 cells.
Figure 12.
Lactate treatment promotes mitochondrial biogenesis in MCF7 cells. (A) Lactate administration increases the mitochondrial mass of MCF7 cells. Homotypic cultures of MCF7 cells were treated with 10 mM L-lactate or vehicle alone (H2O) for 48 hours. Cells were fixed and immunostained with an anti-intact mitochondrial membrane antibody (red). DAPI was used to stain nuclei (blue). Note that lactate treatment increases mitochondrial mass in MCF7 cells, thus simulating the co-culture with fibroblasts. Importantly, images were acquired using identical exposure settings. Original magnification, 63x. (B) Quercetin increases Cav-1 expression in fibroblasts in co-cultures. hTERT-fibroblast-MCF7 cell co-cultures were incubated with 10 mM quercetin—an MCT inhibitor or vehicle alone (DMSO) control for 5 days. Cells were fixed and immunostained with anti-Cav-1 (red) and anti-K8/18 (green) antibodies. DAPI was used to stain nuclei (blue). Note that upon quercetin treatment, Cav-1 levels are increased in fibroblasts. Importantly, images were acquired using identical exposure settings. Original magnification, 40x.
We then attempted to assess the relationship between stromal Cav-1 expression and lactate transport more directly. To this end, fibroblast-MCF7 co-cultures were incubated for 5 days with quercetin (10 µM), a naturally-occuring flavenoid that blocks both the secretion and uptake of lactate by MCT inhibition.34 Then, cells were immuno-stained with antibodies directed against Cav-1. Figure 12B show that Cav-1 expression is increased in the fibroblasts of quercetin treated co-cultures, compared to vehicle alone controls. This suggests that the cellular bioenergetic state and rate of lactate transport may also regulate Cav-1 expression in fibroblasts in co-culture.
eNOS overexpression pheno-copies a loss of CAV-1 in fibroblasts.
We show above that Cav-1 downregulation in fibroblasts generates high ROS levels, promotes glycolysis and impairs oxidative respiration. In order to dissect the mechanism(s) by which a loss of Cav-1 affects mitochondrial activity, we investigated the possibility that NO over-production, secondary to a loss of Cav-1, is the root cause of mitochondrial dysfunction. Previous studies have shown that Cav-1 serves as a tonic inhibitor of NOS,16,35 and loss of Cav-1 leads to NO over-production.36 Abnormal NO production induces increased ROS levels and mitochondrial damage. Thus, eNOS overexpression should pheno-copy a loss of Cav-1 in fibroblasts.
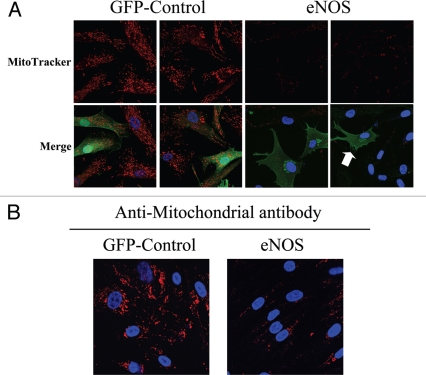
To this end, hTERT-fibroblasts transiently overexpressing either eNOS or GFP (as a control) were incubated with MitoTracker, to label functional mitochondria with an active membrane potential. Figure 13A shows that mitochondrial activity is severely impaired in eNOS overexpressing cells, as compared to GFP control cells. Interestingly, eNOS-negative cells adjacent to eNOS-positive cells also display decreased mitochondrial activity, consistent with the notion that NO freely diffuses across the plasma membrane and acts as a transient labile paracrine factor, decreasing mitochondrial activity in adjacent cells. Similarly, hTERT-fibroblasts stably overexpressing eNOS also show reductions in mitochondrial mass, as compared with control fibroblasts stably-expressing GFP (Fig. 13B).
Figure 13.
Nitric oxide production induces mitochondrial dysfunction in fibroblasts. (A) eNOS recombinant overexpression decreases mitochondrial activity and phenocopies loss of Cav-1. hTERT-fibroblasts transiently expressing eNOS or the GFP-control were incubated with MitoTracker (red). eNOS (green) was visualized using an eNOS antibody while GFP-controls (green) were visualized using autofluorescence. DAPI was used to stain nuclei (blue). Note that mitochondrial activity is undetectable in eNOS expressing cells, and even in eNoS negative cells that are adjacent to eNOS positive cells. This is consistent with the idea that NO is a diffusible metabolite which mediates a “field effect” (see the white arrow, pointing at a single eNOS positive cell, surrounded by 8 eNOS negative fibroblasts). GFP-control cells display high levels of mitochondrial staining, as expected. Importantly, images were acquired using identical exposure settings. Original magnification, 63x. (B) eNOS recombinant overexpression decreases mitochondrial mass. hTERT-fibroblasts stably overexpressing eNoS also show dramatic reductions in mitochondrial mass, as compared with control fibroblasts stably expressing GFP. Cells were fixed and immunostained with an anti-intact mitochondrial membrane antibody (red). DAPI was used to stain nuclei (blue). Original magnification, 63x.
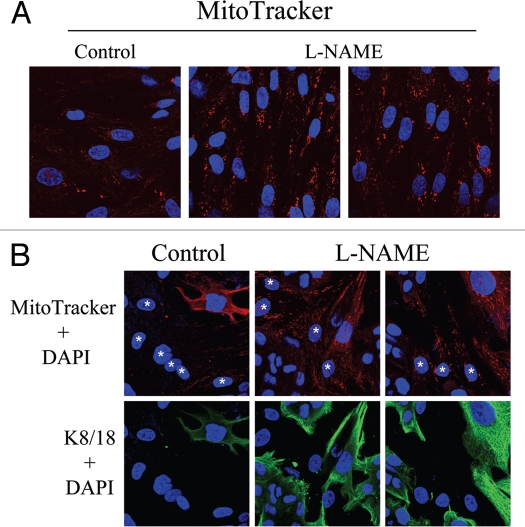
To directly evaluate the role of NO in mitochondrial activity in fibroblasts, MitoTracker was used to label hTERT-fibroblasts treated for 24 hours with L-NAME (20 mM), a non-selective NOS inhibitor. Figure 14A shows that NOS inhibition greatly increases mitochondrial activity, as compared to vehicle alone controls. We then asked if NOS inhibition was sufficient to revert the mitochondrial phenotype (increased mitochondria mass in MCF7 cells and decreased mitochondria mass in fibroblasts) that we observe in co-culture. To this end, after treatment with L-NAME (20 mM) for 24 hours, day 5 fibroblast-MCF7 co-cultures were labeled with MitoTracker, to detect mitochondrial activity. Figure 14B shows that L-NAME treatment is sufficient to revert the mitochondrial phenotype that we observe in co-culture. Note that NOS inhibition rescues mitochondrial activity in co-cultured fibroblasts, but decreases the mitochondrial activity of co-cultured MCF7 cells. These results suggest that the increased mitochondrial activity that we observe in co-cultured cancer cells is NO-dependent.
Figure 14.
Rescue of mitochondrial dysfunction with L-NAME, an inhibitor of NO production. (A) L-NAME increases mitochondrial activity. hTERT-fibroblasts were treated for 24 hours with 20 mM L-NAME or vehicle alone (H2O) before incubation with MitoTracker (red). DAPI was used to stain nuclei (blue). Note that L-NAME treatment greatly increases mitochondrial activity. Original magnification, 63x. (B) L-NAME abrogates the mitochondrial phenotypes in co-cultured cells. hTERT-fibroblast-MCF7 cell co-cultures were incubated with 20 mM L-NAME or vehicle alone (H2O) control for 24 hours. Then, cells were incubated with MitoTracker (red), fixed and immunostained with anti-K/18 (green) antibodies. DAPI was used to stain nuclei (blue). Note that upon L-NAME treatment, mitochondrial activity is increased in fibroblasts and decreased in MCF7 cells. Stars denote fibroblast nuclei. Upper panels show only the red channel to appreciate the MitoTracker staining, while the lower panels show the merged images of K8/18 and DAPI. Importantly, images were acquired using identical exposure settings. Original magnification, 40x.
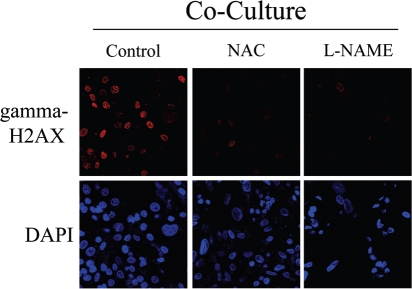
To directly assess if NO over-production leads to oxidative stress and DNA double strand breaks, day 2 fibroblast-MCF7 co-cultures were treated for 72 hours with NAC, an anti-oxidant or L-NAME, a NOS inhibitor. Then, cells were immuno-stained with an antibody against gamma-H2AX. Figure 15 shows that both NAC and L-NAME treatment abolishes gamma-H2AX foci formation, demonstrating that NO and ROS are the main causes of DNA double strand breaks.
Figure 15.
Rescue of DNA damage in fibroblast-MCF7 co-cultures with NAC and L-NAME. Treatment with NAC and L-NAME abolishes DNA double strand breaks in co-culture. Day2 co-cultures of hTERT-fibroblasts and MCF7 cells were treated with 10 mM NAC or with 20 mM L-NAME or with vehicle alone (H2O) for 72 hours. Then, cells were immunostained with anti-gamma-H2AX (red) antibodies. DAPI was used to stain nuclei (blue). Upper panels show only the red channel to appreciate gamma-H2AX staining, while the lower panels show nuclei staining. High levels of DNA double strand breaks are detected in co-cultured cells. Note that treatment with NAC and L-NAME abolishes DNA double strand breaks in co-cultured cells. Importantly, images were acquired using identical exposure settings. Original magnification, 40x.
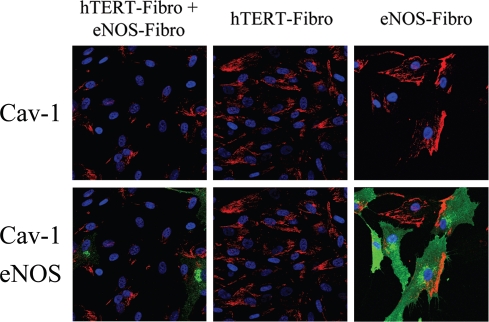
Finally, we attempted to investigate if NO over-production may feed-back and induce a decrease in Cav-1 expression, in a similar way as we have observed with ROS. To this end, hTERT-fibroblasts stably overexpressing eNOS (eNOS-fibro) were cultured either alone or co-cultured with hTERT-fibroblasts (non-transfected), and then stained using Cav-1 antibodies. We observed two main patterns of Cav-1 distribution in eNOS-fibroblasts (Right panels of Fig. 16). In some eNOS overexpressing fibroblasts, Cav-1 expression was very low, whereas in other cells, Cav-1 was highly expressed and was polarized. It is known that in endothelial cells, Cav-1 displays a polarized distribution. In addition, in some cells expressing low levels of eNOS, Cav-1 was not polarized and was expressed at levels comparable to un-transfected cells. Interestingly, Cav-1 expression is greatly decreased in most cells of the eNOS-fibro and untransfected fibroblast cocultures (Fig. 16). Note that Cav-1 expression is low in all the eNOS-fibro cells and in most hTERT-fibroblasts, suggesting that NO over-production downregulates Cav-1 expression by a paracrine “field effect”.
Figure 16.
Paracrine NO production downregulates Cav-1 in adjacent normal fibroblasts: Evidence for a field effect. NO-overproduction downregulates Cav-1 expression. hTERT-fibroblasts stably expressing eNOS (eNOS-fibro) were co-cultured with control hTERT-fibroblasts for 5 days. Homotypic cultures of both types of fibroblasts were also established in parallel. Then, cells were immunostained with anti-Cav-1 (red) and eNOS (green) antibodies. DAPI was used to stain nuclei (blue). Upper panels show only the red channel to appreciate Cav-1 staining, while the lower panels show the merged images. Note that co-culture of eNOS-fibroblasts and hTERT-fibroblasts (originally plated in a 1:1 cell ratio) greatly downregulates Cav-1 expression in all cells, suggesting a “field effect” secondary to NO over-production. Importantly, images were acquired using identical exposure settings. Original magnification, 40x.
Discussion
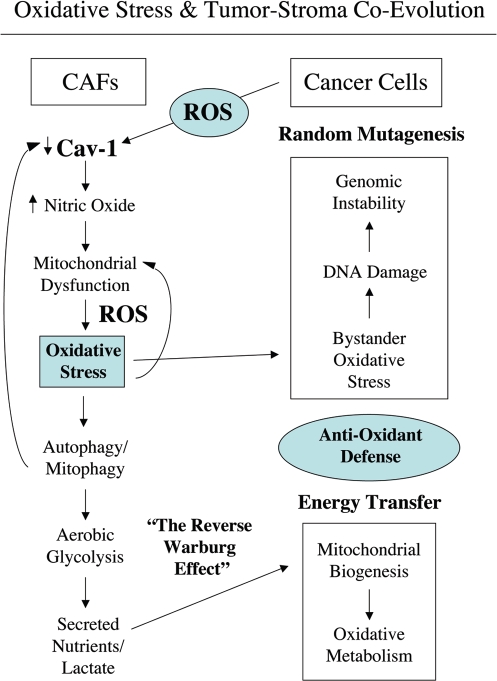
Loss of Cav-1 is a marker of CAFs that correlates with poor clinical outcome in breast cancer. The aim of this study was to investigate the mechanism(s) by which a loss of Cav-1 increases the aggressive behavior of cancer cells. Our experimental data suggest a model of mutagenic co-evolution and metabolic coupling of epithelial cancer cells and CAFs during tumor formation (see Figs. 17 and 18 for schematic diagrams). Our data show that cancer cells induce ROS production and a loss of Cav-1 in adjacent fibroblasts, leading to a CAF-phenotype (Fig. 17). The loss of Cav-1 in fibroblasts triggers NO production, mitochondrial dysfunction and oxidative stress—via ROS production (Fig. 18). Oxidative stress affects both cancer cells and fibroblasts. Oxidative stress promotes DNA damage and genetic instability in cancer cells, by a bystander effect (mutagenic evolution). Thus, cancer cells induce oxidative stress in fibroblasts, which in turn supports their own mutagenesis, in a feed-forward mechanism. Cancer cells escape oxidative mitochondrial damage by upregulation of anti-oxidant enzymes, such us peroxiredoxin-1. On the other hand, oxidative stress triggers autophagy/mitophagy and aerobic glycolysis in CAFs, with HIF-1α upregulation, leading to the creation of a lactate-rich microenvironment. In this way, CAFs provide nutrients to cancer cells, to stimulate their mitochondrial biogenesis and directly fuel oxidative metabolism (metabolic coupling).
Figure 17.
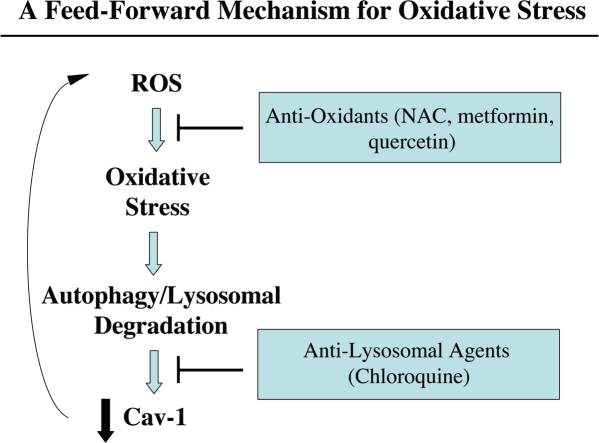
Cav-1 downregulation provides a “feed-forward” mechanism for oxidative stress. Here, we show that epithelial cancer cells (MCF7) have the ability to induce ROS production in adjacent normal fibroblasts (Fig. 1A). This may be due to the production of ROS species in epithelial cancer cells, which are then transferred to fibroblasts, initiating a cascade of oxidative stress in fibroblasts. In support of this notion, epithelial cancer cells need to be in direct contact with fibroblasts to mediate Cav-1 downregulation. For example, conditioned media from MCF7 epithelial cancer cells is not sufficient to downregulate Cav-1 in fibroblasts. Oxidative stress, in turn, induces the onset of autophagy and the production of auto-phagosomes that fuse with lysosomes, leading to the degradation of intracellular organelles, such as caveolae and mitochondria. This would promote a loss of Cav-1 expression, which we have shown is sufficient to drive additional ROS production (Fig. 2B). In support of this model, we have previously demonstrated that chloroquine blocks the stromal loss of Cav-1 expression in fibroblast/MCF7 co-cultures.15 Similalry, treatment with anti-oxidants (such as NAC, metformin and quercetin) also blocks the stromal loss of Cav-1 expression in fibroblast/MCF7 co-cultures (see Figs. 1B, C and 12B). Thus, the proposed model explains how both anti-oxidants and anti-lysosomal agents prevent the loss of Cav-1 in our co-culture studies.
Figure 18.
Oxidative stress in cancer associated fibroblasts functions as a “metabolic” and “mutagenic” motor, driving epithelial cancer cell evolution. An oxidative stress based model of tumor-stroma co-evolution is presented, which summarizes our current findings. In this model, the mutagenic evolution and metabolic coupling of cancer cells with adjacent fibroblasts during tumor formation is highlighted. First, cancer cells induce a loss of Cav-1 in adjacent fibroblasts. Loss of Cav-1 triggers NO production, mitochondrial dysfunction and oxidative stress in fibroblasts—via ROS production. In turn, oxidative stress affects both cancer cells and fibroblasts. In cancer cells, oxidative stress promotes DNA damage and genetic instability, by a bystander effect. Thus, cancer cells induce oxidative stress in fibroblasts, which sequentially leads to their own mutagenesis, promoting a more aggressive phenotype (mutagenic evolution). On the other hand, oxidative stress triggers autophagy/mitophagy and aerobic glycolysis in CAFs, with HIF-1α upregulation, inducing the creation of a lactate-rich microenvironment. In this way, CAFs provide nutrients to cancer cells, to stimulate their mitochondrial biogenesis, and directly fuel oxidative metabolism (metabolic coupling). In addition, cancer cells escape oxidative mitochondrial damage and apoptosis by the upregulation of anti-oxidant enzymes, such us peroxiredoxin-1. Oxidative stress-induced autophagy may play a key role in mediating both Cav-1 downregulation and in the disposal of damaged mitochondria, promoting aerobic glycolysis in cancer-associated fibroblasts (the Reverse Warburg effect). For example, treatment with an autophagy inhibitor (namely chloroquine) blocks the downregulation of Cav-1 observed upon co-culture with MCF7 cells,15 suggesting that Cav-1 and caveolae both undergo autophagic-lysomal degradation in fibroblasts.
We have previously shown that co-culture with MCF7 cells dramatically modifies fibroblasts, promoting a CAF-conversion characterized by a loss of Cav-1.15 Here, we show that in coculture, cancer cells induce oxidative stress in adjacent fibroblasts, leading to ROS-dependent Cav-1 downregulation. We demonstrate for the first time that oxidative stress is sufficient to induce a loss of Cav-1 in fibroblasts. Treatment with anti-oxidants (NAC and metformin) restores Cav-1 expression levels in co-cultured fibroblasts. Conversely, Cav-1 knock-down leads to increased ROS generation. Taken together, our results from the co-culture model and Cav-1 knock-down experiments demonstrate that Cav-1 expression and ROS levels are under positive feed-forward control, such that a rise in ROS levels decreases Cav-1 expression and low Cav-1 levels further generates ROS production.
Previous studies have shown that NAC treatment effectively inhibits tumor growth by preventing DNA damage and genetic instability as well as by decreasing HIF-1 levels.37,38 Metformin is an anti-diabetes drug that functions as a complex I inhibitor and blocks mitochondrial-dependent ROS production.29,30 Metformin inhibits breast cancer cell growth and was shown to act in combinations with conventional chemotherapy to reduce tumor mass and prevent relapse in a xenograft tumor model.39,40 Long-term use of metformin is associated with decreased incidence and improved prognosis in breast cancer patients.41 Here, we provide solid evidence that anti-oxidants (such as NAC and metformin) dramatically restore the expression of stromal Cav-1, suggesting an alternative mechanism by which anti-oxidants delay tumor growth.
Functionally, we show that cancer cell-induced oxidative stress causes DNA double-strand breaks in co-cultured fibroblasts, as seen by gamma-H2AX staining. Treatment of normal fibroblasts with the pro-oxidant drug BSO mimics the presence of cancer cells, inducing Cav-1 downregulation and the formation of DNA double-strand breaks. Furthermore, siRNA-mediated Cav-1 knock-down triggers gamma-H2AX foci formation, clearly indicating that a loss of Cav-1 in fibroblasts is sufficient to promote DNA damage. Importantly, treatment with the anti-oxidant NAC or with L-NAME, a NOS inhibitor, is sufficient to prevent gamma-H2AX foci formation, directly demonstrating a role for oxidative stress as a driver of DNA damage in stromal cells. Interestingly, gene expression profiling of grade 3 reactive stroma, which is associated with poor clinical outcome in prostate cancer, shows the significant upregulation of the DNA damage/repair pathways, compared to adjacent normal stroma. Thus, DNA damage in the tumor stroma is associated with a poor prognosis.42
Similarly, we have observed, using genome-wide transcriptional profiling of Cav-1 (−/−) null stromal cells, that these cells exhibit key transcriptional profiles associated with ROS production, DNA damage and oxidative stress, as well as HIF-activation.43 Moreover, the transcriptional profile of Cav-1 (−/−) null stromal cells also significantly overlapped with Alzheimer's disease brain,43 the pathogenesis of which is associated with oxidative stress, NO over-production (peroxynitrite formation), inflammation, hypoxia and mitochondrial dysfunction. Finally, we observed that the profiles of Cav-1 (−/−) stromal cells were most similar to the tumor-stroma of breast cancer patients that had undergone lymph node metastasis.27 This tumor-stroma “metastasis-prone” gene set also independently shows significant associations with oxidative stress, DNA damage and Alzheimer's disease,27 suggesting that certain fundamental biological processes are common to both an activated tumor stroma and neurodegenerative stress.
Concomitantly, oxidative stress in fibroblasts induces aneuploidy in adjacent MCF7 cells, a genetic alteration associated with poor prognosis in human malignancies, including breast cancer. In breast cancer, aneuploidy is detected in DCIS lesions, indicates poor prognosis in patients with early stage disease and predicts poor response to conventional chemotherapy.44,45 The idea that cancer cells acquire genetic alterations by an oxidative stress induced “bystander effect” was first suggested in the pathogenesis of colorectal cancer. For example, infection by Enterococcus faecalis, a bacterium known to generate ROS, was shown to induce genetic instability and aneuploidy in colonic cells.31
We show here for the first time that oxidative stress in CAFs is sufficient to promote genomic instability in adjacent cancer cells, indicating that the tumor stroma can potentially increase cancer cell aggressive behavior, via a bystander effect. We also provide evidence that cancer cells “buffer” themselves against oxidative damage, by the compensatory upregulation of anti-oxidant enzymes, such as peroxiredoxin-1.
Mitochondrial function and ROS production in the tumor stroma are poorly-characterized phenomena. How does a loss of Cav-1 in CAFs induce oxidative stress? Our data indicate that a loss of Cav-1 in fibroblasts drives functional inactivation of mitochondria, with decreased PDH activity and reduced oxidative phosphorylation. In addition, we provide evidence that NO over-production, secondary to a loss of Cav-1, is the basis for mitochondrial dysfunction in tumor fibroblasts. Importantly, eNOS overexpression mimics Cav-1 knock-down in fibroblasts, inducing a remarkable reduction in functional mitochondria. Treatment with L-NAME restores mitochondrial activity, suggesting that NOS inhibition is normally required to control mitochondrial activity. It is well known that Cav-1 functions as a very potent inhibitor of NOS activity, and that a loss of Cav-1 promotes NO production. Functionally, NO induces DNA damage, mitochondrial uncoupling and increased ROS levels.
We show that via NO over-production, Cav-1 knock-down hampers the functionality of complexes I, IV and V in fibroblasts, leading to impaired oxidative phosphorylation and increased oxidative stress. ROS generation occurs predominantly in complex I and III of the mitochondrial respiratory chain,46 and is greatest when oxidative phosphorylation is impaired.47,48 It is known that defects in the assembly and stability of complex I suppress oxidative phosphorylation and lead to increased ROS production.49,50 Furthermore, complex IV is the rate-limiting complex of the electron transport chain,51 stressing the significance of mitochondrial dysfunction upon Cav-1 downregulation.
Importantly, Cav-1 knock-down induces decreased PDH activity in fibroblasts. PDH, a key enzymatic complex linking glycolysis to aerobic respiration, converts pyruvate into acetyl-CoA, allowing the TCA cycle to proceed. It is known that ROS lead to decreased activity of PDH.52 Reduction in PDH enzymatic rates forces the conversion of pyruvate to lactate, thus creating a lactate-rich microenvironment. Notably, HIF-1α activation is sufficient to inhibit PDH activity.46
It is well established that oxidative stress induces HIF-1α, driving the metabolic switch from mitochondrial respiration to glycolysis. We show here that siRNA-mediated Cav-1 knock-down in fibroblasts is sufficient to increase the expression of two master regulators of glycolysis, HIF-1α and PKM2. PKM2 is a glycolytic enzyme previously shown to drive aerobic glycolysis in tumors. These results suggest that a loss of Cav-1 promotes aerobic glycolysis in CAFs, and the creation of an energy rich microenvironment to stimulate mitochondrial biogenesis and oxidative metabolism in adjacent cancer cells (the “Reverse Warburg Hypothesis”). Others have also shown that glycolytic CAFs are associated with increased tumorigenesis. Laser-capture micro-dissection and genetic profiling of CAFs in prostate cancer have shown the upregulation of phosphoglycerate kinase-1 (PGK1), a glycolytic enzyme directly involved in CXCL12 signaling. Functionally, overexpression of PGK1 in normal fibroblasts is sufficient to induce a CAFs conversion and to promote in vivo growth of co-implanted prostate tumor cells.53
In support of the idea that fibroblasts promote aerobic respiration in adjacent tumor cells, we show a significant increase in the mitochondrial mass of MCF7 cells co-cultured with fibroblasts. Importantly, treatment with L-NAME decreases mitochondria activity in co-cultured MCF7 cells, suggesting that NO overproduction is necessary to fuel oxidative metabolism of cancer cells. Interestingly, administration of lactate leads to increased mitochondrial mass in MCF7 cells, clearly indicating that high lactate levels mimic the nutrient-rich microenvironment created by CAFs.
Conversely, fibroblasts co-cultured with MCF7 cells display a reduction in mitochondrial mass, consistent with the idea that CAFs display a loss of Cav-1, undergo a glycolytic switch, with impaired oxidative phosphorylation. Others have shown that hypoxic and aerobic tumor cells have a symbiotic relationship whereby lactate is produced by hypoxic cells and taken up by aerobic cells to be used as an important source of energy.54 Our results suggest that fibroblasts and cancer epithelial cells establish a metabolic parasitic relationship, whereby cancer cells force adjacent fibroblasts to provide nutrients to promote their own survival.
Interestingly, our data show that cancer cells cultured alone display a very reduced mitochondrial mass. However, upon the simulation of in vivo conditions by co-culture with stromal fibroblasts, cancer cells rapidly increase their mitochondrial mass, suggesting that the “conventional” Warburg effect is an in vitro artifact. In direct support of this notion, previous studies have suggested that cell culture greatly impacts the metabolic properties of epithelial cells. For example, when renal tubular cells are transferred into tissue culture dishes, they revert from oxidative metabolism to high rates of glycolysis.55
In direct support of our current studies, a review of previously published electron micrographs of both primary and metastatic human breast cancers56,57 reveals that the epithelial cancer cells contain abundant mitochondria, while the adjacent fibroblasts have a paucity of mitochondria, directly demonstrating “the reverse Warburg effect” in vivo. However, the authors failed to comment on these findings.
Oxidative stress and autophagy in stromal Cav-1 degradation.
In a recent report, we used our novel fibroblast-MCF7 cell culture model to assess the effects of breast cancer cells on the behavior of adjacent fibroblasts. We directly demonstrated, using this model, that loss of Cav-1 in stromal fibroblasts is induced by breast cancer cells and confers a cancer-associated fibroblast phenotype characterized by the expression of myofibroblast marker proteins, increased extracellular matrix production and activated TGFbeta signaling. More specifically, we also showed that MCF7 cells induce the downregulation of Cav-1 in adjacent fibroblasts by lysosomal degradation, as treatment of co-cultures with chloroquine was sufficient to rescue Cav-1 expression in co-cultured fibroblasts. Here, we observe that oxidative stress induces Cav-1 downregulation in fibroblasts, and we can rescue Cav-1 expression in co-cultured fibroblasts by treatment with anti-oxidants, such as NAC, metformin and quercetin. How do we reconcile these observations? Interestingly, oxidative stress is known to induce a cellular degradative process called autophagy. In autophagy, autophagic phagosomes form to degrade intracellular organelles, via fusion with lysosomes. In this regard, it is interesting to note that choloroquine is both an inhibitor of lysosomes and autophagy. Thus, we believe that Cav-1 downregulation is mediated by an autophagic process that culminates in lysosomal degradation. This would directly explain why both inhibitors of oxidative stress and lysosomes prevent the loss of Cav-1 in co-cultured fibroblasts. Furthermore, autophagic destruction of damaged mitochondria would also explain how mitochondria are lost in fibroblasts during their co-culture with cancer cells, initiating aerobic glycolysis in stromal cells. In direct support of these assertions, we show here that co-cultured fibroblasts accumulate vesicular structures that we have identified as autophagosomes, by immunostaining with the well-established autophagy marker—namely LC3.
Does oxidative stress mediate the “field effect” in cancer biology?
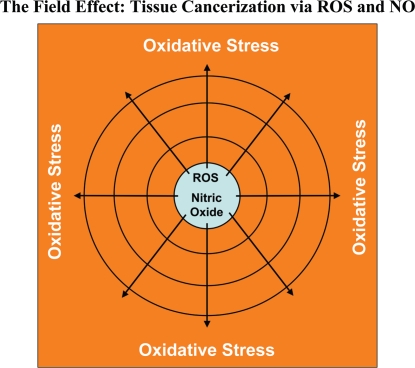
The “field effect” is a well-established paradigm in cancer biology. In the field effect, it is believed that both the malignant tumor cells and the surrounding or adjacent normal area have undergone a mysterious “cancerization” process to allow for the development of multiple independent foci of tumor growth in a given area.58–62 Both genetic and epigenetic alterations have been invoked to explain the field effect, but it still remains an enigma. Here, we suggest that the field effect could be mediated and propagated by oxidative (ROS) and nitrative (NO) stress in cancer-associated fibroblasts (Fig. 19). First, we envision that cancer cells could induce oxidative stress in adjacent fibroblasts. Then, oxidative stress in the adjacent fibroblasts could be laterally propagated from cell-to-cell like a virus, resulting in the amplification of oxidative stress in a given tissue area or field. This would then provide a “mutagenic/oxidative field” resulting in widespread ROS production and DNA damage. This bystander oxidative stress could then mutagenize adjacent normal epithelial cells or cancer cells, resulting in more aggressive cancer cells.
Figure 19.
Oxidative stress drives tissue cancerization: The field effect. In the field effect, it is believed that both the malignant tumor cells and the surrounding or adjacent normal area have undergone a mysterious “cancerization” process to allow for the development of multiple independent foci of tumor growth in a given area. Both genetic and epigenetic alterations have been invoked to explain the field effect, but it still remains an enigma. Here, we suggest that the field effect could be mediated and propagated by oxidative (ROS) and nitrative (NO) stress in cancer associated fibroblasts. First, we envision that cancer cells could induce oxidative stress in adjacent fibroblasts. Then, oxidative stress in the adjacent fibroblasts could be laterally propagated from cell-to-cell like a virus, resulting in the amplification of oxidative stress in a given tissue area or field. This would then provide a “mutagenic/oxidative field” resulting in widespread ROS production and DNA damage. In support of these ideas, here we show that bystander oxidative stress is sufficient to induce DNA damage and aneuploidy in co-cultured MCF7 cells. Furthermore, we demonstrate that eNOS-expressing fibroblasts (undergoing oxidative and nitrative stress) have the ability to induce the downregulation of Cav-1 in adjacent normal fibroblasts, when they are co-cultured together. Thus, oxidative and/or nitrative stress in cancer associated fibroblasts provides a new paradigm by which we can understand how “field cancerization” occurs, and how it can be passed from cell-to-cell in a “contagious” fashion, essentially propagated as “waves of oncogenic stress”.
In support of these ideas, here we show that bystander oxidative stress is sufficient to induce DNA damage and aneuploidy in co-cultured MCF7 cells. Furthermore, we demonstrate that eNOS-expressing fibroblasts (undergoing oxidative and nitrative stress) have the ability to induce the downregulation of Cav-1 in adjacent normal fibroblasts, when they are co-cultured together. Thus, oxidative and/or nitrative stress in cancer-associated fibroblasts provides a new paradigm by which we can understand how “field cancerization” occurs, and how it can be propagated from cell-to-cell in a “contagious” fashion. As such, oxidative stress may function as the “Pied Piper” of field cancerization, spreading from cell-to-cell, inducing oxidative stress and DNA damage in other adjacent cell types, essentially propagated as a “wave of oncogenic stress.” Consistent with our findings, nitro-tyrosine production and polymorphisms in eNOS are associated with increased breast cancer risk.63–68 Conversely, treatment with NAC, an anti-oxidant that directly feeds the reduced glutathione pool, dramatically relieves oxidative stress and blocks tumor growth, as well as tumor multiplicity,69–73 consistent with our hypothesis. Similar anti-tumor effects have also been observed with L-NAME, a NOS inhibitor, as well.74–78 Importantly, NOS isoforms are highly expressed in wound-healing fibroblasts,79–84 consistent with the idea that cancer is a “wound” that does not heal.
Experimental Procedures
Materials.
Antibodies were as follows: Cav-1 (sc-894, Santa Cruz Biotech for immunofluorescence; 610407, BD Biosciences for WB); cytokeratin 8/18 (20R-CP004, Fitzgerald Industries International); HIF-1α (610959, BD Biosciences); surface of intact mitochondria (MAB1273, Millipore); Mitoprofile total OXPHOS cocktail (MS601, Mitosciences), Mitoprofile PDH cocktail (MSP02, Mitosciences), Mitoprofile membrane integrity cocktail (MS620, Mitosciences); LC3A/B (ab58610, Abcam); gamma-H2AX (phospho S139) (ab18311, Abcam); peroxiredoxin 1 (ab15571, Abcam); eNOS (610296, BD Biosciences); β-tubulin (Sigma); LDHB (AV48210, Sigma); PKM1 and PKM2 (Proteintech, crude serum antibody for PKM2 immunohistochemistry, affinity purified antibodies for WB); secondary antibodies for immunofluorescence were Alexa green 488 nm and Alexa Orange-Red 546 nm (Invitrogen). Other reagents were as follows: L-lactate, N-acetyl cysteine (NAC), buthionine sulfoxide (BSO), metformin, quercetin, N-nitro-L-arginine methyl ester (L-NAME) and Hoechst-33258 stain were from Sigma. 4,6-diamidino-2-phenylindole (DAPI) (D3571), MitoTracker CMTMRos (M7510), Prolong Gold Antifade mounting reagent (P36930), Slow-Fade Anti-fade reagent (S2828), 5-(and 6-) carboxy-2′,7′-dichlorodihydrofluorescein diacetate (CM-H2DCFDA; C369), propidium iodide (PI) were from Invitrogen. The Annexin V-Cy5 Apoptosis Detection Kit was from Abcam (ab14150).
Cell cultures.
Human skin fibroblasts immortalized with telomerase reverse transcriptase protein (hTERT-BJ-1) were originally purchased from Clontech, Inc. The breast cancer cell lines MCF7 and MDA-MB 231 were purchased from ATCC. All cells were maintained in DMEM with 10% Fetal Bovine Serum (FBS) and Penicillin 100 units/mL-Streptomycin 100 µg/mL.
Co-cultures of MCF7 cells and fibroblasts.
hTERT-fibroblasts and MCF7 cells were plated on glass coverslips in 12-well plates in 1-ml of complete media. MCF7 cells were plated within 2 hours of fibroblast plating. The total number of cells per well was 1 × 10⁵. Experiments were performed at a 5:1 fibroblast-toepithelial cell ratio. As controls, monocultures of fibroblasts and MCF7 cells were seeded using the same number of cells as the corresponding co-cultures. The day after plating, media was changed to DMEM with 10% NuSerum (a low protein alternative to FBS; BD Biosciences) and Pen-Strep. Cells were maintained at 37°C in a humidified atmosphere containing 5% CO2.
Measurement of reactive oxygen species.
CM-H2DCFDA is a cell-permeable molecule used to measure intracellular ROS. CM-H2DCFDA is a non-fluorescent molecule (DCFH) that, when taken up by cells, is de-acetylated leading to intracellular “entrapment.” Subsequently, DCFH is rapidly oxidized to a highly fluorescent derivative (DCF) that is a measure of intracellular oxidant production.22 The CM-H2DCFDA fluorescence method was used according to the manufacturer's instructions and was previously described.85 Briefly, cells were washed twice with HBSS buffer, incubated with 10 µM CM-H2DCFDA for 15 min at 37°C, then washed with PBS three times and fixed with 2% paraformaldehyde. Nuclei were counter-stained with Hoechst. Samples were then mounted with slow-fade anti-fade immediately prior to imaging by laser scanning confocal microscopy. To control for staining specificity, cells were also treated with 10 mM NAC overnight prior to CM-H2DCFDA incubation.
Immunocytochemistry.
Immuno-cytochemistry was performed as previously described.14 All steps were performed at room temperature. Briefly, after 30 minutes fixation in 2% paraformaldehyde, cells were permeabilized for 10 minutes with immunofluorescence (IF) buffer (PBS, 0.2% BSA, 0.1% TritonX-100). Then, cells were incubated for 10 minutes with NH4Cl in PBS to quench free aldehyde groups. Primary antibodies were incubated in IF buffer for 1 hour. After washing with IF buffer (3x, 10 minutes each), cells were incubated for 30 minutes with fluorochrome-conjugated secondary antibodies diluted in IF buffer. Finally, slides were washed with IF buffer (3x, 10 minutes each), incubated with the nuclear stain and mounted.
Confocal microscopy.
Images were collected with a Zeiss LSM510 meta confocal system using a 405 nm Diode excitation laser with a band pass filter of 420–480 nm, a 488 nm Argon excitation laser with a band pass filter of 505–550 nm and a 543 nm HeNe excitation laser with a 561–604 nm filter. Images were acquired with 20x, 40x or 63x objectives as stated in the Figure legends.
Cav-1 knockdown.
siRNA-mediated Cav-1 knock-down was performed using the HiPerFect transfection reagents (Qiagen) as per manufacturer instructions, with minor modifications. Briefly, 100,000 cells were seeded in 12-well plates in 350 µL of complete media and were transfected within 30 minutes of plating. Transfection reaction was prepared by mixing 100 ng of Cav-1 siRNA (SI00299635, Qiagen) or 100 ng control siRNA (1022076, Qiagen) with 100 µL of serum free media and 6 µL of HiPerFect reagent. After vortexing for 30 seconds, the mixture was incubated for 15 minutes at room temperature and then added drop-wise on the freshly seeded cells. 3 hours after transfection, 800 µL of complete media was added to the cells. Cav-1 knock-down was monitored 36–48 h after transfection.
Flow cytometric analysis.
GFP (+) MCF7 cells were plated in co-culture with hTERT-fibroblasts or in mono-culture. The day after, media was changed to DMEM with 10% NuSerum and cells were grown for additional 48 hours. Then, to isolate the GFP (+) MCF7 cell population, co-cultured cells were sorted using a 488 nm laser. As a critical control, mono-cultures of GFP (+) MCF7 cells were sorted in parallel. For DNA content analyses, sorted cells were fixed in 70% EtOH overnight at 4°C and stained with PI. DNA cell content was analyzed by flow cytometry. For proliferation analysis, cells were incubated with BrdU (Amersham Pharmacia Biotech) for one hour before sorting. Cells were washed in PBS, fixed in cold 70% ethanol and flow cytometry was employed for analysis of nascent DNA synthesis (BrdU incorporation), as previously described.86 Cell cycle analysis was performed using FlowJo 8.8 software. BrdU data is represented as a percentage of the total population.
Annexin v apoptosis detection.
Apoptosis was quantified by Flow Cytometry using the Annexin V-Cy5 apoptosis detection kit, as the per manufacturer's instructions (Abcam). Briefly, GFP (+) MCF7 cells and hTERT-fibroblasts were plated as co-cultures and homotypic cultures in 12 well plates, as previously described above. The day after, media was changed to DMEM with 10% NuSerum. After 48 hours, cells were collected by centrifugation and re-suspended in 500 µL of Annexin V Binding Buffer. 5 µL of annexin V-Cy5 antibody was added and incubated in the dark at room temperature for 5 minutes. Cells were then analyzed by Flow Cytometry using a GFP signal detector with excitation wavelength of 488 nm and emission of 530 nm and a Cy5 signal detector with excitation wavelength of 649 nm and emission of 670 nm.
Mitochondrial staining.
To stain mitochondria, rosamine-based MitoTracker Orange CMTMRos (#M7510, Molecular Probes) was used. MitoTracker stains live mitochondria with an intact membrane potential and is preserved upon fixation. It provides a qualitative measurement of mitochondrial membrane potential. The lyophilized MitoTracker product was dissolved in DMSO to prepare a 1 mM solution, immediately before use. The 1 mM stock solution was diluted in serum free DMEM to a final concentration of 25 nM. Cells were incubated with pre-warmed MitoTracker staining solution for 10 minutes at 37°C. Then, cells were washed in PBS and fixed with 2% PFA. An antibody against the intact surface of mitochondria (MAB 1273, Millipore) was also used to visualize mitochondria by immuno-cytochemistry. Finally, western blot analysis was performed using cocktails of anti mitochondrial antibodies detecting (1) subunits of complexes involved in oxidative phosphorylation, (2) PDH subunits and (3) mitochondrial membrane integrity.
Western blotting.
hTERT-fibroblasts were harvested in lysis buffer (10 mM Tris-HCl pH 7.5, 150 mM NaCl, 1% Triton X-100, 60 mM octylglucoside), containing protease inhibitors (Roche Applied Science) and phosphatase inhibitors (Roche Applied Science) and centrifuged at 13,000x g for 15 min at 4°C to remove insoluble debris. Protein concentrations were analyzed using the BCA reagent (Pierce) For HIF-1α detection, cells were scraped in urea lysis buffer (6.7 M urea, 10% glycerol, 1% SDS, 10 mM Tris-HCl pH 6.6, 1% Triton X-100, protease inhibitors), homogenized for 5 seconds and incubated on ice for 10 minutes. After centrifugation to remove insoluble debris, protein concentration was determined using the Bradford assay (BioRad). 30 µg of proteins were loaded and separated by SDS-PAGE and transferred to a 0.2 µm nitrocellulose membrane (Fisher Scientific). After blocking for 30 min in TBST (10 mM Tris-HCl pH 8.0, 150 mM NaCl, 0.05% Tween-20) with 5% nonfat dry milk, membranes were incubated with the primary antibody for 1 hour, washed and incubated for 30 min with horseradish peroxidase-conjugated secondary antibodies. The membranes were washed and incubated with an enhanced chemi-luminescence substrate (ECL; Thermo Scientific).
Animal studies.
Animals were housed and maintained in a pathogen-free environment/barrier facility at the Kimmel Cancer Center at Thomas Jefferson University under National Institutes of Health (NIH) guidelines. Mice were kept on a 12 hour light/dark cycle with ad libitum access to chow and water. Approval for all animal protocols used for this study was reviewed and approved by the Institutional Animal Care and Use Committee (IACUC). Briefly, tumor cells (MDA-MB-231 (GFP(+)); 1 × 10⁶ cells) were mixed with hTERT-fibroblasts (3 × 10⁵ cells) in 100 µl of sterile PBS and were co-injected into the flanks of athymic NCr nude mice (NCRNU; Taconic Farms; 6–8 weeks of age). After 2 weeks, mice were sacrificed; tumors were excised and frozen in liquid nitrogen-cooled isopentane.
Immunohistochemistry.
Frozen sections (6 µm) were fixed with 2% paraformaldehyde for 10 minutes. After blocking with 10% goat serum, the sections were incubated with primary antibodies for 1 hour at room temperature. Then, sections were incubated with secondary antibodies for 30 minutes. Finally, sections were washed three times with PBS (10 minutes each wash), incubated with DAPI and mounted. Images were acquired with LSM 530 confocal microscope.
eNOS expression.
The eNOS (EX-Q0563-Lv105) and GFP control (EX-EGFP-Lv105) vectors were purchased from GeneCopoeia and lenti-viruses were prepared according to the manufacturer's protocol. Virus-containing media were centrifuged, filtered (0.45 µM PES low protein filter) and stored in 1 mL aliquots at −80°C. hTERT-fibroblasts (120,000 cells/well) were plated in 12 well dishes in growth media. After 24 hours, the media was removed and replaced with 250 µl DMEM + 5% FBS, 150 µl of virus-containing media and 5 µg/ml polybrene. 24 hours post transfection, media containing virus was removed and replaced with DMEM with 10% NuSerum. Cells were cultured for 48 hours prior to incubation with Mitotracker. For generating stably overexpressing eNOS hTERT-fibroblasts, after infection, the cells were selected with puromycin for three days.
Conclusions
In summary, we provide key mechanistic evidence directly supporting the “reverse Warburg effect,” and suggesting that acute loss of Cav-1 leads to mitochondrial impairment, oxidative stress and aerobic glycolysis in CAFs. As a consequence, CAFs secrete high levels of energy-rich metabolites (such as lactate), to directly fuel mitochondrial-dependent ATP production in cancer cells. We also show that oxidative stress in CAFs is sufficient to induce genetic instability in adjacent cancer cells, potentially increasing their aggressive behavior. Finally, we provide evidence that NO over-production, secondary to a loss of Cav-1, is the key factor driving mitochondrial dysfunction and oxidative stress in CAFs. Thus, we introduce a novel model of mutagenic co-evolution and metabolic coupling to explain the prognostic value of a loss of stromal Cav-1 in breast cancer. We propose that cancer cells use oxidative stress in adjacent fibroblasts (1) to improve their own survival (via the extraction of nutrients) and (2) to drive their mutagenic evolution towards a more aggressive phenotype.
Acknowledgements
M.P.L. and his laboratory were supported by grants from the NIH/NCI (R01-CA-080250; R01-CA-098779; R01-CA-120876; R01-AR-055660) and the Susan G. Komen Breast Cancer Foundation. F.S. was supported by grants from the Breast Cancer Alliance (BCA) and a Research Scholar Grant from the American Cancer Society (ACS). R.G.P. was supported by grants from the NIH/NCI (R01-CA-70896, R01-CA-75503, R01-CA-86072 and R01-CA-107382) and the Dr. Ralph and Marian C. Falk Medical Research Trust. The Kimmel Cancer Center was supported by the NIH/NCI Cancer Center Core grant P30-CA-56036 (to R.G.P.). Funds were also contributed by the Margaret Q. Landenberger Research Foundation (to M.P.L.). This project is funded, in part, under a grant with the Pennsylvania Department of Health (to M.P.L.). The Department specifically disclaims responsibility for any analyses, interpretations or conclusions. This work was also supported, in part, by a Centre grant in Manchester from Breakthrough Breast Cancer in the U.K. (to A.H.) and an Advanced ERC Grant from the European Research Council.
Abbreviations
BSO
buthionine sulfoximine
CAFs
cancer associated fibroblasts
Cav-1
caveolin-1
DCIS
ductal carcinoma in situ
DCFDA
5-(and 6-) carboxy-2′,7′-dichlorodihydrofluorescein diacetate
K8/18
cytokeratin 8/18
HIF-1α
hypoxia inducible factor 1α
LDH
lactic dehydrogenase
MCT
monocarboxylate transporter
NAC
N-acetyl-cysteine
NO
nitric oxide
NOS
nitric oxide synthase
PGK1
phosphoglycerate kinase-1
PI
propidium iodide
PDH
pyruvate dehydrogenase
PKM
pyruvate kinase
muscle; ROS
reactive oxygen species
hTERT
human telomerase reverse transcriptase
Footnotes
References
- 1.Koleske AJ, Baltimore D, Lisanti MP. Reduction of caveolin and caveolae in oncogenically transformed cells. Proc Natl Acad Sci USA. 1995;92:1381–1385. doi: 10.1073/pnas.92.5.1381. [DOI] [PMC free article] [PubMed] [Google Scholar]
- 2.Lee SW, Reimer CL, Oh P, Campbell DB, Schnitzer JE. Tumor cell growth inhibition by caveolin reexpression in human breast cancer cells. Oncogene. 1998;16:1391–1397. doi: 10.1038/sj.onc.1201661. [DOI] [PubMed] [Google Scholar]
- 3.Park DS, Razani B, Lasorella A, Schreiber-Agus N, Pestell RG, Iavarone A, et al. Evidence that Myc isoforms transcriptionally repress caveolin-1 gene expression via an INR-dependent mechanism. Biochemistry. 2001;40:3354–3362. doi: 10.1021/bi002787b. [DOI] [PubMed] [Google Scholar]
- 4.Galbiati F, Volonte D, Engelman JA, Watanabe G, Burk R, Pestell RG, et al. Targeted downregulation of caveolin-1 is sufficient to drive cell transformation and hyperactivate the p42/44 MAP kinase cascade. EMBO J. 1998;17:6633–6648. doi: 10.1093/emboj/17.22.6633. [DOI] [PMC free article] [PubMed] [Google Scholar]
- 5.Liu J, Lee P, Galbiati F, Kitsis RN, Lisanti MP. Caveolin-1 expression sensitizes fibroblastic and epithelial cells to apoptotic stimulation. Am J Physiol Cell Physiol. 2001;280:823–835. doi: 10.1152/ajpcell.2001.280.4.C823. [DOI] [PubMed] [Google Scholar]
- 6.Engelman JA, Wykoff CC, Yasuhara S, Song KS, Okamoto T, Lisanti MP. Recombinant expression of caveolin-1 in oncogenically transformed cells abrogates anchorage-independent growth. J Biol Chem. 1997;272:16374–16381. doi: 10.1074/jbc.272.26.16374. [DOI] [PubMed] [Google Scholar]
- 7.Witkiewicz AK, Dasgupta A, Sotgia F, Mercier I, Pestell RG, Sabel M, et al. An absence of stromal caveolin-1 expression predicts early tumor recurrence and poor clinical outcome in human breast cancers. Am J Pathol. 2009;174:2023–2034. doi: 10.2353/ajpath.2009.080873. [DOI] [PMC free article] [PubMed] [Google Scholar]
- 8.Sloan EK, Ciocca DR, Pouliot N, Natoli A, Restall C, Henderson MA, et al. Stromal cell expression of caveolin-1 predicts outcome in breast cancer. Am J Pathol. 2009;174:2035–2043. doi: 10.2353/ajpath.2009.080924. [DOI] [PMC free article] [PubMed] [Google Scholar]
- 9.Witkiewicz AK, Dasgupta A, Nguyen KH, Liu C, Kovatich AJ, Schwartz GF, et al. Stromal caveolin-1 levels predict early DCIS progression to invasive breast cancer. Cancer Biol Ther. 2009;8:1071–1079. doi: 10.4161/cbt.8.11.8874. [DOI] [PubMed] [Google Scholar]
- 10.Witkiewicz AK, Dasgupta A, Sammons S, Er O, Potoczek MB, Guiles F, et al. Loss of stromal caveolin-1 expression predicts poor clinical outcome in triple negative and basal-like breast cancers. Cancer Biol Ther. 2010;10:135–143. doi: 10.4161/cbt.10.2.11983. [DOI] [PMC free article] [PubMed] [Google Scholar]
- 11.Di Vizio D, Morello M, Sotgia F, Pestell RG, Freeman MR, Lisanti MP. An absence of stromal caveolin-1 is associated with advanced prostate cancer, metastatic disease and epithelial Akt activation. Cell Cycle. 2009;8:2420–2424. doi: 10.4161/cc.8.15.9116. [DOI] [PMC free article] [PubMed] [Google Scholar]
- 12.Kalluri R, Zeisberg M. Fibroblasts in cancer. Nat Rev Cancer. 2006;6:392–401. doi: 10.1038/nrc1877. [DOI] [PubMed] [Google Scholar]
- 13.Mercier I, Casimiro MC, Wang C, Rosenberg AL, Quong J, Minkeu A, et al. Human breast cancer-associated fibroblasts (CAFs) show caveolin-1 downregulation and RB tumor suppressor functional inactivation: Implications for the response to hormonal therapy. Cancer Biol Ther. 2008;7:1212–1225. doi: 10.4161/cbt.7.8.6220. [DOI] [PMC free article] [PubMed] [Google Scholar]
- 14.Sotgia F, Del Galdo F, Casimiro MC, Bonuccelli G, Mercier I, Whitaker-Menezes D, et al. Caveolin-1−/− null mammary stromal fibroblasts share characteristics with human breast cancer-associated fibroblasts. Am J Pathol. 2009;174:746–761. doi: 10.2353/ajpath.2009.080658. [DOI] [PMC free article] [PubMed] [Google Scholar]
- 15.Martinez-Outschoorn UE, Pavlides S, Whitaker-Menezes D, Daumer KM, Milliman JN, Chiavarina B, et al. Tumor cells induce the cancer associated fibroblast phenotype via caveolin-1 degradation: Implications for breast cancer and DCIS therapy with autophagy inhibitors. Cell Cycle. 2010;9:2423–2433. doi: 10.4161/cc.9.12.12048. [DOI] [PubMed] [Google Scholar]
- 16.Garcia-Cardena G, Martasek P, Masters BS, Skidd PM, Couet J, Li S, et al. Dissecting the interaction between nitric oxide synthase (NOS) and caveolin. Functional significance of the nos caveolin binding domain in vivo. J Biol Chem. 1997;272:25437–25440. doi: 10.1074/jbc.272.41.25437. [DOI] [PubMed] [Google Scholar]
- 17.Shi Y, Pritchard KA, Jr, Holman P, Rafiee P, Griffith OW, Kalyanaraman B, et al. Chronic myocardial hypoxia increases nitric oxide synthase and decreases caveolin-3. Free Radic Biol Med. 2000;29:695–703. doi: 10.1016/s0891-5849(00)00364-6. [DOI] [PubMed] [Google Scholar]
- 18.Goligorsky MS, Li H, Brodsky S, Chen J. Relationships between caveolae and eNOS: everything in proximity and the proximity of everything. Am J Physiol Renal Physiol. 2002;283:1–10. doi: 10.1152/ajprenal.00377.2001. [DOI] [PubMed] [Google Scholar]
- 19.Vakkala M, Kahlos K, Lakari E, Paakko P, Kinnula V, Soini Y. Inducible nitric oxide synthase expression, apoptosis and angiogenesis in in situ and invasive breast carcinomas. Clin Cancer Res. 2000;6:2408–2416. [PubMed] [Google Scholar]
- 20.Haynes CM, Titus EA, Cooper AA. Degradation of misfolded proteins prevents ER-derived oxidative stress and cell death. Mol Cell. 2004;15:767–776. doi: 10.1016/j.molcel.2004.08.025. [DOI] [PubMed] [Google Scholar]
- 21.Balaban RS, Nemoto S, Finkel T. Mitochondria, oxidants and aging. Cell. 2005;120:483–495. doi: 10.1016/j.cell.2005.02.001. [DOI] [PubMed] [Google Scholar]
- 22.Thannickal VJ, Fanburg BL. Reactive oxygen species in cell signaling. Am J Physiol Lung Cell Mol Physiol. 2000;279:1005–1028. doi: 10.1152/ajplung.2000.279.6.L1005. [DOI] [PubMed] [Google Scholar]
- 23.Chandel NS, Maltepe E, Goldwasser E, Mathieu CE, Simon MC, Schumacker PT. Mitochondrial reactive oxygen species trigger hypoxia-induced transcription. Proc Natl Acad Sci USA. 1998;95:11715–11720. doi: 10.1073/pnas.95.20.11715. [DOI] [PMC free article] [PubMed] [Google Scholar]
- 24.Sandau KB, Fandrey J, Brune B. Accumulation of HIF-1alpha under the influence of nitric oxide. Blood. 2001;97:1009–1015. doi: 10.1182/blood.v97.4.1009. [DOI] [PubMed] [Google Scholar]
- 25.Palmer LA, Gaston B, Johns RA. Normoxic stabilization of hypoxia-inducible factor-1 expression and activity: redox-dependent effect of nitrogen oxides. Mol Pharmacol. 2000;58:1197–1203. doi: 10.1124/mol.58.6.1197. [DOI] [PubMed] [Google Scholar]
- 26.Berridge MV, Tan AS. Effects of mitochondrial gene deletion on tumorigenicity of metastatic melanoma: Reassessing the Warburg effect. Rejuvenation Res. 2010;13:139–141. doi: 10.1089/rej.2009.0948. [DOI] [PubMed] [Google Scholar]
- 27.Pavlides S, Tsirigos A, Vera I, Flomenberg N, Frank PG, Casimiro MC, et al. Transcriptional evidence for the “Reverse Warburg Effect” in human breast cancer tumor stroma and metastasis: Similarities with oxidative stress, inflammation, Alzheimer's disease and “Neuron-Glia Metabolic Coupling”. Aging (Albany NY) 2010;2:185–199. doi: 10.18632/aging.100134. [DOI] [PMC free article] [PubMed] [Google Scholar]
- 28.Pavlides S, Whitaker-Menezes D, Castello-Cros R, Flomenberg N, Witkiewicz AK, Frank PG, et al. The reverse Warburg effect: Aerobic glycolysis in cancer associated fibroblasts and the tumor stroma. Cell Cycle. 2009;8:3984–4001. doi: 10.4161/cc.8.23.10238. [DOI] [PubMed] [Google Scholar]
- 29.Batandier C, Guigas B, Detaille D, El-Mir MY, Fontaine E, Rigoulet M, et al. The ROS production induced by a reverse-electron flux at respiratory-chain complex 1 is hampered by metformin. J Bioenerg Biomembr. 2006;38:33–42. doi: 10.1007/s10863-006-9003-8. [DOI] [PubMed] [Google Scholar]
- 30.Morales AI, Detaille D, Prieto M, Puente A, Briones E, Arevalo M, et al. Metformin prevents experimental gentamicin-induced nephropathy by a mitochondria-dependent pathway. Kidney Int. 2010;77:861–869. doi: 10.1038/ki.2010.11. [DOI] [PubMed] [Google Scholar]
- 31.Wang X, Allen TD, May RJ, Lightfoot S, Houchen CW, Huycke MM. Enterococcus faecalis induces aneuploidy and tetraploidy in colonic epithelial cells through a bystander effect. Cancer Res. 2008;68:9909–9917. doi: 10.1158/0008-5472.CAN-08-1551. [DOI] [PMC free article] [PubMed] [Google Scholar]
- 32.Bae JY, Ahn SJ, Han W, Noh DY. Peroxiredoxin I and II inhibit H2O2-induced cell death in MCF-7 cell lines. J Cell Biochem. 2007;101:1038–1045. doi: 10.1002/jcb.21155. [DOI] [PubMed] [Google Scholar]
- 33.Christofk HR, Vander Heiden MG, Harris MH, Ramanathan A, Gerszten RE, Wei R, et al. The M2 splice isoform of pyruvate kinase is important for cancer metabolism and tumour growth. Nature. 2008;452:230–233. doi: 10.1038/nature06734. [DOI] [PubMed] [Google Scholar]
- 34.Morris ME, Felmlee MA. Overview of the proton-coupled MCT (SLC16A) family of transporters: Characterization, function and role in the transport of the drug of abuse gamma-hydroxybutyric acid. Aaps J. 2008;10:311–321. doi: 10.1208/s12248-008-9035-6. [DOI] [PMC free article] [PubMed] [Google Scholar]
- 35.Garcia-Cardena G, Fan R, Stern DF, Liu J, Sessa WC. Endothelial nitric oxide synthase is regulated by tyrosine phosphorylation and interacts with caveolin-1. J Biol Chem. 1996;271:27237–27240. doi: 10.1074/jbc.271.44.27237. [DOI] [PubMed] [Google Scholar]
- 36.Razani B, Engelman JA, Wang XB, Schubert W, Zhang XL, Marks CB, et al. Caveolin-1 null mice are viable but show evidence of hyperproliferative and vascular abnormalities. J Biol Chem. 2001;276:38121–38138. doi: 10.1074/jbc.M105408200. [DOI] [PubMed] [Google Scholar]
- 37.Sablina AA, Budanov AV, Ilyinskaya GV, Agapova LS, Kravchenko JE, Chumakov PM. The antioxidant function of the p53 tumor suppressor. Nat Med. 2005;11:1306–1313. doi: 10.1038/nm1320. [DOI] [PMC free article] [PubMed] [Google Scholar]
- 38.Gao P, Zhang H, Dinavahi R, Li F, Xiang Y, Raman V, et al. HIF-dependent antitumorigenic effect of antioxidants in vivo. Cancer Cell. 2007;12:230–238. doi: 10.1016/j.ccr.2007.08.004. [DOI] [PMC free article] [PubMed] [Google Scholar]
- 39.Hirsch HA, Iliopoulos D, Tsichlis PN, Struhl K. Metformin selectively targets cancer stem cells, and acts together with chemotherapy to block tumor growth and prolong remission. Cancer Res. 2009;69:7507–7511. doi: 10.1158/0008-5472.CAN-09-2994. [DOI] [PMC free article] [PubMed] [Google Scholar]
- 40.Zakikhani M, Dowling R, Fantus IG, Sonenberg N, Pollak M. Metformin is an AMP kinase-dependent growth inhibitor for breast cancer cells. Cancer Res. 2006;66:10269–10273. doi: 10.1158/0008-5472.CAN-06-1500. [DOI] [PubMed] [Google Scholar]
- 41.Bodmer M, Meier C, Krahenbuhl S, Jick SS, Meier CR, Meier CR. Long-term metformin use is associated with decreased risk of breast cancer. Diabetes Care. 2010;33:1304–1308. doi: 10.2337/dc09-1791. [DOI] [PMC free article] [PubMed] [Google Scholar]
- 42.Dakhova O, Ozen M, Creighton CJ, Li R, Ayala G, Rowley D, Ittmann M. Global gene expression analysis of reactive stroma in prostate cancer. Clin Cancer Res. 2009;15:3979–3989. doi: 10.1158/1078-0432.CCR-08-1899. [DOI] [PMC free article] [PubMed] [Google Scholar]
- 43.Pavlides S, Tsirigos A, Vera I, Flomenberg N, Frank PG, Casimiro MC, et al. Loss of stromal Caveolin-1 leads to oxidative stress, mimics hypoxia and drives inflammation in the tumor microenvironment, conferring the “Reverse Warburg Effect”: A transcriptional informatics analysis with validation. Cell Cycle. 2010;9:2201–2219. doi: 10.4161/cc.9.11.11848. [DOI] [PubMed] [Google Scholar]
- 44.Ottesen GL. Carcinoma in situ of the female breast: A clinico-pathological, immunohistological and DNA ploidy study. APMIS. 2003:1–67. [PubMed] [Google Scholar]
- 45.Gnant MF, Blijham GH, Reiner A, Schemper M, Reynders M, Schutte B, et al. Aneuploidy fraction but not DNA index is important for the prognosis of patients with stage I and II breast cancer—10-year results. Ann Oncol. 1993;4:643–650. doi: 10.1093/oxfordjournals.annonc.a058618. [DOI] [PubMed] [Google Scholar]
- 46.Frezza C, Gottlieb E. Mitochondria in cancer: not just innocent bystanders. Semin Cancer Biol. 2009;19:4–11. doi: 10.1016/j.semcancer.2008.11.008. [DOI] [PubMed] [Google Scholar]
- 47.Benard G, Rossignol R. Ultrastructure of the mitochondrion and its bearing on function and bioenergetics. Antioxid Redox Signal. 2008;10:1313–1342. doi: 10.1089/ars.2007.2000. [DOI] [PubMed] [Google Scholar]
- 48.Melov S, Schneider JA, Day BJ, Hinerfeld D, Coskun P, Mirra SS, et al. A novel neurological phenotype in mice lacking mitochondrial manganese superoxide dismutase. Nat Genet. 1998;18:159–163. doi: 10.1038/ng0298-159. [DOI] [PubMed] [Google Scholar]
- 49.Ugalde C, Janssen RJ, van den Heuvel LP, Smeitink JA, Nijtmans LG. Differences in assembly or stability of complex I and other mitochondrial OXPHOS complexes in inherited complex I deficiency. Hum Mol Genet. 2004;13:659–667. doi: 10.1093/hmg/ddh071. [DOI] [PubMed] [Google Scholar]
- 50.Pitkanen S, Robinson BH. Mitochondrial complex I deficiency leads to increased production of superoxide radicals and induction of superoxide dismutase. J Clin Invest. 1996;98:345–351. doi: 10.1172/JCI118798. [DOI] [PMC free article] [PubMed] [Google Scholar]
- 51.Chen ZX, Velaithan R, Pervaiz S. mitoEnergetics and cancer cell fate. Biochim Biophys Acta. 2009;1787:462–467. doi: 10.1016/j.bbabio.2008.12.009. [DOI] [PubMed] [Google Scholar]
- 52.Bogaert YE, Rosenthal RE, Fiskum G. Postischemic inhibition of cerebral cortex pyruvate dehydrogenase. Free Radic Biol Med. 1994;16:811–820. doi: 10.1016/0891-5849(94)90197-x. [DOI] [PubMed] [Google Scholar]
- 53.Wang J, Ying G, Wang J, Jung Y, Lu J, Zhu J, et al. Characterization of phosphoglycerate kinase-1 expression of stromal cells derived from tumor microenvironment in prostate cancer progression. Cancer Res. 2010;70:471–480. doi: 10.1158/0008-5472.CAN-09-2863. [DOI] [PMC free article] [PubMed] [Google Scholar] [Retracted]
- 54.Sonveaux P, Vegran F, Schroeder T, Wergin MC, Verrax J, Rabbani ZN, et al. Targeting lactate-fueled respiration selectively kills hypoxic tumor cells in mice. J Clin Invest. 2008;118:3930–3942. doi: 10.1172/JCI36843. [DOI] [PMC free article] [PubMed] [Google Scholar]
- 55.Gstraunthaler G, Seppi T, Pfaller W. Impact of culture conditions, culture media volumes and glucose content on metabolic properties of renal epithelial cell cultures: Are renal cells in tissue culture hypoxic? Cell Physiol Biochem. 1999;9:150–172. doi: 10.1159/000016312. [DOI] [PubMed] [Google Scholar]
- 56.Seemayer TA, Lagace R, Schurch W, Tremblay G. Myofibroblasts in the stroma of invasive and metastatic carcinoma: A possible host response to neoplasia. Am J Surg Pathol. 1979;3:525–533. doi: 10.1097/00000478-197912000-00005. [DOI] [PubMed] [Google Scholar]
- 57.Ozzello L. Ultrastructure of the human mammary gland. Pathol Annu. 1971;6:1–59. [PubMed] [Google Scholar]
- 58.Ge L, Meng W, Zhou H, Bhowmick N. Could stroma contribute to field cancerization? Med Hypotheses. 2010;75:26–31. doi: 10.1016/j.mehy.2010.01.019. [DOI] [PubMed] [Google Scholar]
- 59.Nonn L, Ananthanarayanan V, Gann PH. Evidence for field cancerization of the prostate. Prostate. 2009;69:1470–1479. doi: 10.1002/pros.20983. [DOI] [PMC free article] [PubMed] [Google Scholar]
- 60.Heaphy CM, Bisoffi M, Fordyce CA, Haaland CM, Hines WC, Joste NE, et al. Telomere DNA content and allelic imbalance demonstrate field cancerization in histologically normal tissue adjacent to breast tumors. Int J Cancer. 2006;119:108–116. doi: 10.1002/ijc.21815. [DOI] [PubMed] [Google Scholar]
- 61.Hockel M, Dornhofer N. The hydra phenomenon of cancer: Why tumors recur locally after microscopically complete resection. Cancer Res. 2005;65:2997–3002. doi: 10.1158/0008-5472.CAN-04-3868. [DOI] [PubMed] [Google Scholar]
- 62.Izawa T, Obara T, Tanno S, Mizukami Y, Yanagawa N, Kohgo Y. Clonality and field cancerization in intraductal papillary-mucinous tumors of the pancreas. Cancer. 2001;92:1807–1817. doi: 10.1002/1097-0142(20011001)92:7<1807::aid-cncr1697>3.0.co;2-0. [DOI] [PubMed] [Google Scholar]
- 63.Hong CC, Ambrosone CB, Ahn J, Choi JY, McCullough ML, Stevens VL, et al. Genetic variability in iron-related oxidative stress pathways (Nrf2, NQ01, NOS3 and HO-1), iron intake and risk of postmenopausal breast cancer. Cancer Epidemiol Biomarkers Prev. 2007;16:1784–1794. doi: 10.1158/1055-9965.EPI-07-0247. [DOI] [PubMed] [Google Scholar]
- 64.Yang J, Ambrosone CB, Hong CC, Ahn J, Rodriguez C, Thun MJ, et al. Relationships between polymorphisms in NOS3 and MPO genes, cigarette smoking and risk of post-menopausal breast cancer. Carcinogenesis. 2007;28:1247–1253. doi: 10.1093/carcin/bgm016. [DOI] [PubMed] [Google Scholar]
- 65.Karihtala P, Winqvist R, Syvaoja JE, Kinnula VL, Soini Y. Increasing oxidative damage and loss of mismatch repair enzymes during breast carcinogenesis. Eur J Cancer. 2006;42:2653–2659. doi: 10.1016/j.ejca.2006.05.037. [DOI] [PubMed] [Google Scholar]
- 66.Nakamura Y, Yasuoka H, Tsujimoto M, Yoshidome K, Nakahara M, Nakao K, et al. Nitric oxide in breast cancer: Induction of vascular endothelial growth factor-C and correlation with metastasis and poor prognosis. Clin Cancer Res. 2006;12:1201–1207. doi: 10.1158/1078-0432.CCR-05-1269. [DOI] [PubMed] [Google Scholar]
- 67.Karihtala P, Kinnula VL, Soini Y. Antioxidative response for nitric oxide production in breast carcinoma. Oncol Rep. 2004;12:755–759. [PubMed] [Google Scholar]
- 68.Samoszu M, Brennan ML, To V, Leonor L, Zheng L, Fu X, et al. Association between nitrotyrosine levels and microvascular density in human breast cancer. Breast Cancer Res Treat. 2002;74:271–278. doi: 10.1023/a:1016328526866. [DOI] [PubMed] [Google Scholar]
- 69.Reliene R, Schiestl RH. Antioxidant N-acetyl cysteine reduces incidence and multiplicity of lymphoma in Atm deficient mice. DNA Repair (Amst) 2006;5:852–859. doi: 10.1016/j.dnarep.2006.05.003. [DOI] [PubMed] [Google Scholar]
- 70.Reliene R, Schiestl RH. Antioxidants suppress lymphoma and increase longevity in Atm-deficient mice. J Nutr. 2007;137:229–232. doi: 10.1093/jn/137.1.229S. [DOI] [PubMed] [Google Scholar]
- 71.Reliene R, Fischer E, Schiestl RH. Effect of N-acetyl cysteine on oxidative DNA damage and the frequency of DNA deletions in atm-deficient mice. Cancer Res. 2004;64:5148–5153. doi: 10.1158/0008-5472.CAN-04-0442. [DOI] [PubMed] [Google Scholar]
- 72.Reliene R, Schiestl RH. Glutathione depletion by buthionine sulfoximine induces DNA deletions in mice. Carcinogenesis. 2006;27:240–244. doi: 10.1093/carcin/bgi222. [DOI] [PubMed] [Google Scholar]
- 73.Martin KR, Saulnier MJ, Kari FW, Barrett JC, French JE. Timing of supplementation with the antioxidant N-acetyl-L-cysteine reduces tumor multiplicity in novel, cancer-prone p53 haploinsufficient Tg.AC (v-Ha-ras) transgenic mice but has no impact on malignant progression. Nutr Cancer. 2002;43:59–66. doi: 10.1207/S15327914NC431_7. [DOI] [PubMed] [Google Scholar]
- 74.Andrade SP, Hart IR, Piper PJ. Inhibitors of nitric oxide synthase selectively reduce flow in tumor-associated neovasculature. Br J Pharmacol. 1992;107:1092–1095. doi: 10.1111/j.1476-5381.1992.tb13412.x. [DOI] [PMC free article] [PubMed] [Google Scholar]
- 75.Orucevic A, Lala PK. NG-nitro-L-arginine methyl ester, an inhibitor of nitric oxide synthesis, ameliorates interleukin 2-induced capillary leakage and reduces tumour growth in adenocarcinoma-bearing mice. Br J Cancer. 1996;73:189–196. doi: 10.1038/bjc.1996.34. [DOI] [PMC free article] [PubMed] [Google Scholar]
- 76.Yamamoto T, Terada N, Nishizawa Y, Tanaka H, Akedo H, Seiyama A, et al. Effects of NG-nitro-L-arginine and/or L-arginine on experimental pulmonary metastasis in mice. Cancer Lett. 1994;87:115–120. doi: 10.1016/0304-3835(94)90417-0. [DOI] [PubMed] [Google Scholar]
- 77.Iwasaki T, Higashiyama M, Kuriyama K, Sasaki A, Mukai M, Shinkai K, et al. NG-nitro-L-arginine methyl ester inhibits bone metastasis after modified intracardiac injection of human breast cancer cells in a nude mouse model. Jpn J Cancer Res. 1997;88:861–866. doi: 10.1111/j.1349-7006.1997.tb00462.x. [DOI] [PMC free article] [PubMed] [Google Scholar]
- 78.Gallo O, Masini E, Morbidelli L, Franchi A, Fini-Storchi I, Vergari WA, et al. Role of nitric oxide in angiogenesis and tumor progression in head and neck cancer. J Natl Cancer Inst. 1998;90:587–596. doi: 10.1093/jnci/90.8.587. [DOI] [PubMed] [Google Scholar]
- 79.Wang R, Ghahary A, Shen YJ, Scott PG, Tredget EE. Human dermal fibroblasts produce nitric oxide and express both constitutive and inducible nitric oxide synthase isoforms. J Invest Dermatol. 1996;106:419–427. doi: 10.1111/1523-1747.ep12343428. [DOI] [PubMed] [Google Scholar]
- 80.Schaffer MR, Efron PA, Thornton FJ, Klingel K, Gross SS, Barbul A. Nitric oxide, an autocrine regulator of wound fibroblast synthetic function. J Immunol. 1997;158:2375–2381. [PubMed] [Google Scholar]
- 81.Cobbold CA. The role of nitric oxide in the formation of keloid and hypertrophic lesions. Med Hypotheses. 2001;57:497–502. doi: 10.1054/mehy.2001.1373. [DOI] [PubMed] [Google Scholar]
- 82.Cobbold CA, Sherratt JA. Mathematical modelling of nitric oxide activity in wound healing can explain keloid and hypertrophic scarring. J Theor Biol. 2000;204:257–288. doi: 10.1006/jtbi.2000.2012. [DOI] [PubMed] [Google Scholar]
- 83.Frank S, Kampfer H, Wetzler C, Pfeilschifter J. Nitric oxide drives skin repair: Novel functions of an established mediator. Kidney Int. 2002;61:882–888. doi: 10.1046/j.1523-1755.2002.00237.x. [DOI] [PubMed] [Google Scholar]
- 84.Zhao R, Guan DW, Lu B. [Immunohistochemical study on expression of iNOS and eNOS during skin incised wound healing in mice ] Fa Yi Xue Za Zhi. 2005;21:161–164. [PubMed] [Google Scholar]
- 85.Ushio-Fukai M, Zafari AM, Fukui T, Ishizaka N, Griendling KK. p22phox is a critical component of the superoxide-generating NADH/NADPH oxidase system and regulates angiotensin II-induced hypertrophy in vascular smooth muscle cells. J Biol Chem. 1996;271:23317–23321. doi: 10.1074/jbc.271.38.23317. [DOI] [PubMed] [Google Scholar]
- 86.Knudsen ES, Buckmaster C, Chen TT, Feramisco JR, Wang JY. Inhibition of DNA synthesis by RB: Effects on G1/S transition and S-phase progression. Genes Dev. 1998;12:2278–2292. doi: 10.1101/gad.12.15.2278. [DOI] [PMC free article] [PubMed] [Google Scholar]
