TRPV1 Activation Is Required for Hypertonicity-Stimulated Inflammatory Cytokine Release in Human Corneal Epithelial Cells (original) (raw)
The transient receptor potential channel V1 (TRPV1) mediates hypertonic stress–stimulated increases in IL-6 and IL-8 through EGFR transactivation and activation of MAPK and NF-κB signaling in corneal epithelial cells.
Abstract
Purpose.
To determine whether hypertonic stress promotes increases in inflammatory cytokine release through transient receptor potential vanilloid channel type 1 (TRPV1) signaling pathway activation in human corneal epithelial cells (HCECs).
Methods.
Hyperosmotic medium was prepared by supplementing isotonic Ringers solution with sucrose. Ca2+ signaling was measured in fura2-AM–loaded HCECs using a single-cell fluorescence imaging system. Western blot analysis evaluated the phosphorylation status of EGFR, ERK, p38 MAPK, and nuclear factor (NF)-κB. ELISA assessed the effect of TRPV1 activation on the release of IL-6 and IL-8.
Results.
A 450 mOsm hypertonic stress elicited 2-fold Ca2+ transients that were suppressed by the TRPV1-selective antagonists capsazepine and JYL 1421. Such transients were enhanced by PGE2. Hypertonicity-induced EGF receptor (EGFR) transactivation was suppressed by preincubating HCECs with capsazepine, matrix metalloproteinase 1 (MMP1) inhibitor TIMP-1, broad-spectrum MMP inhibitor GM 6001, heparin-bound (HB)-EGF inhibitor CRM 197, or EGFR inhibitor AG 1478. ERK and p38 MAPK and NF-κB activation after EGFR transactivation occurred in tonicity and in a time-dependent manner. Hypertonicity-induced increases in IL-6 and IL-8 releases were suppressed by exposure to capsazepine, AG 1478, ERK inhibitor PD 98059, p38 inhibitor SB 203580, or NF-κB inhibitor PDTC.
Conclusions.
Hypertonic stress–elicited TRPV1 channel stimulation mediates increases in a proinflammatory cytokine IL-6 and a chemoattractant IL-8 by eliciting EGFR transactivation, MAPK, and NF-κB activation. Selective drug modulation of either TRPV1 activity or its signaling mediators may yield a novel approach to suppressing inflammatory responses occurring in dry eye syndrome.
The superficial corneal epithelial layer protects the cornea from losses in tissue transparency and deturgescence resulting from environmental insults. This barrier function maintenance is dependent on the continuous renewal of corneal epithelial cells and the integrity of tight junctions between the superficial epithelial cells in this layer. One environmental stress that can compromise corneal epithelial barrier function is exposure to hyperosmotic tear film, which occurs in dry eye disease.1,2Increases in tear osmolarity promote ocular surface inflammation by activating proinflammatory cytokine release and enhancing inflammatory cell infiltration. These tear gland dysfunction and tear film instability; thus, corneal erosion and opacification may ensue. Although therapeutic approaches such as hypotonic or isotonic artificial tears provide symptomatic relief in dry eye disease patients by lowering their tear osmolarity,3,4development of drugs that can effectively suppress receptor-mediated inflammation is limited.
Emerging evidence indicates that the transient receptor potential vanilloid family members mediate responses to osmotic stress. TRPV channels function as a trans-plasma membrane ion entry pathway composed of six transmembrane-spanning subunits in the form of a tetramer. There are seven members (TRPV1-TRPV7) in this subfamily. Only 2 of 7 members have been documented to be activated by osmotic challenges. Our earlier study reveals TRPV4 contributes to hypo-osmosensing mechanism and initiates regulatory volume decrease in HCECs. Similar findings have been made in rat neurons, HaCaT cells, and human airway smooth muscle cells.5–8However, exposure to hyperosmotic challenges does not induce TRPV4 channel activation in HCECs and some other tissues.8–10
Some studies have identified TRPV1 as a hyperosmotic sensor. Liu et al.11 found that hypertonicity sensitized capsaicin induced Ca2+ transients and enhanced TRPV1 translocation to plasma membrane in rat trigeminal neurons. Sharif et al. 12 and Yokoyama et al.13 revealed that an N-terminal variant of the TRPV1 channel is required for hyperosmotic sensing but not for hypertonicity-induced regulatory volume increase in arginine vasopressin (AVP)-releasing neurons in supraoptic nucleus. On the other hand, it remains uncertain whether TRPV1 serves as a hyperosmotic sensor to stimulate fluid intake.14,15 In addition, there is limited information regarding the role of TRPV1 hyperosmosensor in nonneuronal tissues. In HCECs, TRPV1 activation by capsaicin induces increases in IL-6 and IL-8 release through mitogen-activated protein kinase (MAPK) pathway stimulation.16As increases in IL-6 and IL-8 contribute to inflammation occurring in dry eye disease, it is possible that TRPV1 activation by hypertonicity can contribute to these increases.
The signaling mechanism through which hypertonic stress increases proinflammatory cytokine release is of great interest. EGF receptor (EGFR) and its linked signaling cascades are not only a key promoter of cell proliferation and migration but also a critical mediator of various pathophysiological events.17EGFR activation has been identified in response to UV light, osmotic stress, membrane depolarization, cytokines, chemokines, and cell adhesion elements. In the corneal epithelium, EGFR transactivation is elicited by lysophosphatidic acid (LPA), adenosine triphosphate (ATP), wounding, and flagellin.18These findings prompted us to determine whether hyperosmotic stimuli–induced increases in proinflammatory cytokine release are dependent on EGFR transactivation and the role of TRPV1 in such processes.
MAPK family activation, a downstream event of EGFR stimulation, can also be triggered by osmotic shock. Both hypertonic and hypotonic exposures can activate MAPK.16,19Exposure of the mouse corneal surface to hypertonic stress stimulated ERK, p38, and Jun NH2-terminal kinase (JNK) MAPK signaling, which led to increases in IL-1β, TNFα, and metalloproteinase (MMP)-9 expression levels.20,21Both the duration and the magnitude of MAPK phosphorylation are determinants of types of responses induced by their activation.22In HCECs, the duration and magnitude of ERK and p38 phosphorylation determined EGF-induced proliferation and migration. Prolonged p38 phosphorylation by suppression of ERK signaling pathway promotes EGF-induced migration. On the other hand, proliferation was enhanced when ERK phosphorylation was prolonged by eliminating glycogen synthase kinase (GSK-3)–induced dephosphorylation of ERK.23,24 Such modulation of MAPK-induced signaling by EGF and neural growth factor (NGF) occurs in PC12 cells, a neural precursor cell line. With EGF, ERK MAPK activation peaked at 5 minutes and then rapidly declined. This pattern of ERK activation promoted cell proliferation. In contrast, with NGF, ERK activation remained high for hours, and the cells stopped proliferating and instead differentiated into neurons.25As different responses induced by TRPV1 and EGF activation are both dependent on MAPK signaling, it is convincible that each of the responses is associated with a unique pattern of MAPK stimulation.
Another mediator in the process of hypertonicity-induced inflammation is nuclear factor (NF)-κB protein. NF-κB is a latent transcription factor that lies at the center of many inflammatory responses induced by infection and injury.26–28 NF-κB is implicated in mediating dry eye–induced ocular surface inflammation because the inhibition of NF-κB reduces the inflammatory response.1 However, given the complex etiology of dry eye inflammation, including cytokines, chemokines, and MMPs, the importance of NF-κB responsiveness to hypertonic stress is unclear in HCECs. Furthermore, the interaction between MAPK and NF-κB in mediating inflammation depends on types of stimuli and cells.29–32Therefore, investigation is warranted to probe for the role of MAPK and NF-κB in hypertonicity-induced inflammation in corneal epithelial cells.
In the present study, we identified that exposure to hyperosmotic stimuli activated the TRPV1 channel. This resulted in EGFR transactivation through metalloproteinase-dependent HB-EGF shedding. TRPV1-EGFR signaling cascades contributed to the phosphorylation of ERK and p38 MAPK and to subsequent activation of NF-κB, leading to increases in IL-6 and IL-8 release.
Materials and Methods
Materials
TRPV1 inhibitor capsazepine, EGFR antagonist AG 1478, PGE2, MMP-1 inhibitor TIMP1, broad-spectrum MMP inhibitor GM 6001, HB-EGF inhibitor CRM 197, ERK inhibitor PD 98059, p38 inhibitor SB 203580, and NF-κB inhibitor pyrrolidinedithiocarbamate (PDTC) were purchased from Sigma-Aldrich (St. Louis, MO). The TRPV1 inhibitor JYL 1421 was a generous gift from Jeewoo Lee (College of Pharmacy, Seoul National University, Seoul, South Korea). Antibodies of phospho-EGFR, total-EGFR, phospho-ERK, total-ERK, total-p38, and β-actin were from Santa Cruz Biotechnology (Santa Cruz, CA). Anti–phospho-p38 and phospho-IκB-α were from Cell Signaling Technology (Danvers, MA). IL-6 and IL-8 ELISA kits were from R&D Systems (Minneapolis, MN).
Cell Culture
SV40 adenovirus–immortalized HCECs a generous gift from Araki-Sasaki, (Kagoshima Miyata Eye Clinic, Kagoshima, Japan), were cultured in supplemented Dulbecco's modified Eagle's medium (DMED/F12). After reaching 80% to 90% confluence, cells were detached with 0.5% trypsin-EDTA and were subcultured in DMEM/F12 medium supplemented with 10% fetal bovine serum (FBS), 5 ng/mL EGF, 5 μg/mL insulin, and 40 μg/mL gentamicin in a humidified incubator with 5% CO2, 95% atmosphere air at 37°C.
Intracellular Calcium Fluorescence Imaging
Relative changes in intracellular Ca2+ concentration were measured with ISEE 5.5.9 analytical imaging software in conjunction with a single-cell fluorescence imaging system (Inovision Corp., Raleigh, NC). HCECs grown on circular 22-mm coverslips were loaded with 3 μM fura 2-AM (Invitrogen-Molecular Probes, Carlsbad, CA) at 37°C for 50 minutes with or without test compounds. Cells were then washed with prewarmed (37°C) NaCl Ringer's solution (138 mM NaCl, 5 mM KCl, 1 mM CaCl2, 1 mM KH2PO4, 1 mM MgCl2, 10 mM glucose, and 10 mM HEPES, pH 7.4, 300 mOsm). Hyperosmotic solutions were created by supplementing sucrose in the isotonic Ringer's solution. Sucrose increases hyperosmotic stress without changing transmembrane ionic strength.33Osmolarities of 375 mOsm, 450 mOsm, 500 mOsm, and 600 mOsm were produced by adding 75 mM, 150 mM, 200 mM, and 300 mM sucrose, respectively, to the Ringer's solution. Osmolarity was verified based on measurements of freezing-point depression (Micro-Osmette Osmometer; Precision System, Natick, MA). Ca2+-free solution was formulated by eliminating CaCl2 and adding 2 mM EGTA in the Ringer's solution. Coverslips were placed on the stage of an inverted microscope (Diaphot 200; Nikon, Tokyo, Japan), on which cells were alternately illuminated every 5 seconds at 340 and 380 nm; signal emission was monitored at 510 nm using a charge-coupled device camera (Roper Scientific; Photometrics, Tucson, AZ). Microscopic fields containing five to 10 cells were examined; at least three coverslips were used for each condition. Results were plotted as mean of ratio of F340/F380 nm ± SEM from at least three independent experiments.
Western Blot Analysis
HCECs cultured on 33-mm culture dishes were lysed using lysis buffer containing 20 mM Tris, 150 mM NaCl, 1 mM EDTA, 1 mM EGTA, 1% Triton X-100, 2.5 mM sodium pyrophosphate, 1 mM β-glycerol phosphate, and 1 mM Na3VO4, pH 7.5, with a protease inhibitor mixture (1 mM PMSF, 1 mM benzamidine, 10 μg/mL leupeptin, and 10 μg/mL aprotinin) for at least 10 minutes Cells were scraped with a rubber policeman, followed by sonication (4 seconds by 4 cycles at 50 mV) and centrifugation (13,000 rpm for 15 minutes at 5°C). Supernatants were harvested and stored at −80°C until analysis. The protein concentration of each lysate was determined by bicinchoninic acid assay (micro BCA protein assay kit; Pierce Biotechnology, Rockford, IL). After boiling samples for 5 minutes, equal amounts of protein were fractionated onto 10% SDS-polyacrylamide gels, followed by electrophoresis and blotting onto polyvinylidine difluoride membranes (Bio-Rad, Hercules, CA). Membranes were blocked with blocking buffer, 5% fat-free milk in 0.1% Tris-buffered solution/Tween-20, for 1 hour at room temperature and then probed overnight at 5°C with antibodies of interest (1:1000). Membranes were incubated with goat anti-rabbit or mouse IgG for 1 hour at room temperature (1:2000). Immunobound antibody was visualized using an enhanced chemiluminescence detection system (ECL Plus; GE Healthcare, Piscataway, NJ). Images were analyzed by densitometry (SigmaScan Pro; Sigma). All experiments were repeated at least three times unless otherwise mentioned.
ELISA
ELISA (R&D Systems) for IL-6 and IL-8 was performed according to the manufacturer's instructions. The amount of IL-6 or IL-8 in the culture medium was normalized according to the total amount of cellular protein lysed with 5% SDS and 0.5 N NaOH. Results are expressed as mean of picograms of IL-6 or IL-8 per milligrams of cell lysate ± SEM (n = 3).
Results
Hyperosmotic Stress Activates TRPV1 Channel
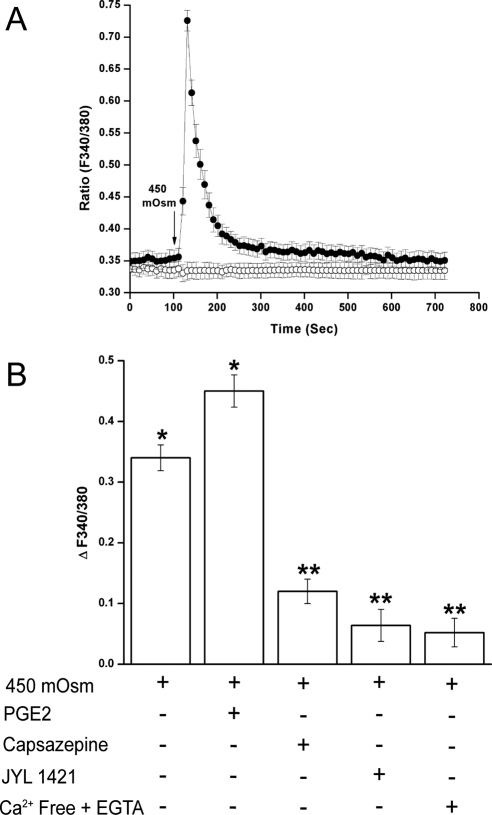
We determined whether a hyperosmotic challenge could elicit the same response in HCECs by evaluating Ca2+-sensitive fluorescence intensity after a 450 mOsm hyperosmotic medium was carefully introduced. The 450 mOsm (150 mM sucrose) was chosen because it stimulated significant Ca2+ transients without causing HCEC detachment. Figure 1A shows a typical time-dependent effect of substitution of an isotonic medium with a 450 mOsm medium on fura2-loaded cells. A 2-minute basal fluorescence level was recorded. Within 20 seconds, exposure to the 450 mOsm medium (indicated by arrow) doubled (n = 3) the increases in Ca2+ transients: the ratio increased from 0.35 ± 0.01 to a maximal value 0.73 ± 0.02. This was followed by a nearly complete recovery to the basal level within the next 400 seconds (filled line). Sham substitution with an isotonic solution failed to elicit any change of Ca2+ level (empty line). Recent studies show that in rat pulmonary sensory neurons, PGE2 enhanced capsaicin-induced increases in the whole cell currents density and action potential frequency.34We then examined in HCECs whether PGE2 can enhance TRPV1 channel-induced Ca2+ influx. Figure 1B shows that pretreatment with PGE2 (1 μM) increased hypertonicity-induced Ca2+ transients by 32.4% ± 3%. JYL 1421 is a more potent TRPV1 antagonist than capsazepine.35 Exposure to capsazepine (10 μM) or JYL 1421 (1 μM) suppressed Ca2+ transients by 65% ± 2% and 81% ± 3%, respectively. Similarly Ca2+-free extracellular medium supplemented with EGTA (2 mM) suppressed Ca2+ transients by 89% ± 2%. Thus, hypertonicity stimulated TRPV1 channel-mediated Ca2+ influx.
Figure 1.
Hypertonicity-induced TRPV1 activation in HCECs. (A) Fluorescence intensity output at 510 nm was monitored, resulting from alternate excitation of wavelengths 340 and 380 nm. Their ratios were indicative of relative changes in intracellular Ca2+ concentration. The basal fluorescence level was measured for 2 minutes, followed by a 10-minute recording in 450 mOsm sucrose-enhanced medium (filled circle). Control fluorescence trace (open circle) was obtained in the 300 mOsm iso-osmotic medium. A sham substitution was performed after 2 minutes that did not change the fluorescence ratio. The arrow under fluorescence traces indicate the presence of 450 mOsm or sham (300 mOsm) medium. (B) Cells were pretreated with PGE2 (1 μM), TRPV1 inhibitor capsazepine (10 μM) or JYL 1421 (1 μM), or exposure to Ca2+-free medium added with 2 mM EGTA for 30 minutes before 450 mOsm medium was introduced. Changes in fluorescence intensity are summarized and expressed as mean ± SEM (n = 3). Each of the indicated conditions was performed in triplicate, and 5 to 10 cells per condition were monitored. *P < 0.01 vs. untreated control. **P < 0.01 vs. treated with 450 mOsm medium alone.
Hypertonicity-Stimulated TRPV1 Transactivates EGFR
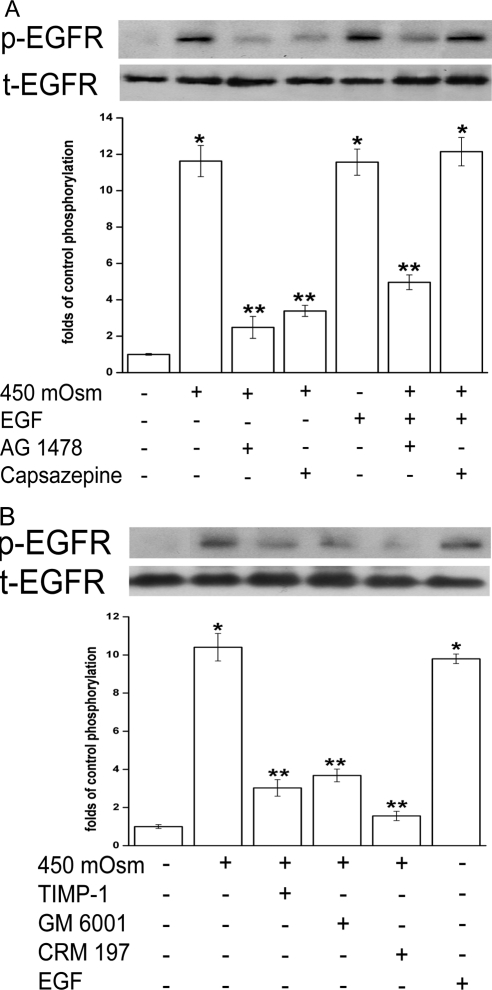
Because various mediators elicit responses through the transactivation of EGFR, we examined whether TRPV1 stimulation is required for hypertonicity-induced EGFR transactivation and the underlying mechanism of such transactivation. In Figure 2A, both 450 mOsm medium and EGF (5 ng/mL) stimulated EGFR phosphorylation (p-EGFR) by 10.6-fold (lanes 2 and 5). Such increases in p-EGFR formation were suppressed with either pretreatment with an EGFR antagonist AG 1478 (10 μM, lane 3) by 86% or capsazepine (10 μM, lane 4) by 77.5%. Concurrent exposure to EGF and the hyperosmotic medium prevented the inhibitory effect of capsazepine on p-EGFR formation (lane 3 vs. lane 7). On the other hand, EGF and hyperosmotic dual stimuli only slightly alleviated AG 1478 inhibition of p-EGFR (lane 3 vs. lane 6). These results indicate that EGF can phosphorylate EGFR regardless of TRPV1 activity, whereas TRPV1 activation–induced phosphorylation of EGFR occurred only when EGFR was not inhibited. Therefore, hypertonicity induces EGFR transactivation by stimulating TRPV1 channels.
Figure 2.
Dependence of hypertonicity-induced EGFR transactivation on TRPV1 stimulation. (A) Cells were pretreated for 30 minutes with a TRPV1 antagonist capsazepine (10 μM) or an EGFR inhibitor AG 1478 (10 μM) before 450 mOsm medium or EGF (5 ng/mL) was introduced. (B) Cells were pretreated for 30 minutes with an MMP-1 inhibitor TIMP-1 (100 ng/mL), a broad-spectrum MMP inhibitor GM 6001 (50 μM), or an HB-EGF inhibitor CRM 197 (10 μg/mL), followed by exposure to 450 mOsm medium for 5 minutes. Exposure to EGF alone served as a positive control. Cell extracts were probed for phosphorylated EGFR (p-EGFR) using anti–p-EGFR antibody by Western blot analysis. Membranes were then stripped and reprobed for total EGFR (t-EGFR) using anti–t-EGFR antibody. Amounts of t-EGFR served as loading controls. Results of a representative experiment are given. Results are summarized in a bar graph below and expressed as mean ± SEM (n = 3). *P < 0.01 vs. untreated control. ** P < 0.01 vs. treated with 450 mOsm medium alone.
The MMP-dependent HB-EGF shedding process mediates EGFR transactivation by injury, ATP, and LPA.21,36,37 We explored whether similar signaling cascades are required for hypertonicity-induced EGFR transactivation by TRPV1. In Figure 2B, TIMP-1 (100 ng/mL), an MMP-1–specific inhibitor, GM 6001 (50 μM), a broad-spectrum MMP inhibitor, or CRM 197 (10 μg/mL), an HB-EGF inhibitor, suppressed 450 mOsm challenge-induced p-EGFR formation by 71%, 65%, and 85%, respectively. Thus, hyperosmotic challenge-elicited p-EGFR formation was suppressed by blocking TRPV1, MMP, or HB-EGF, indicating TRPV1-mediated MMP-dependent HB-EGF shedding underlies hypertonicity-induced EGFR transactivation.
MAPK Is Activated after TRPV1 Transactivation of EGFR
We have previously reported that p38 MAPK activates Na-K-2 Cl cotransporter 1, which is critical for hypertonicity-induced regulatory volume increases and cell survival.16,19 In addition, p38 and JNK activation mediates hypertonicity-induced increases in IL-1β secretion in HCECs.38 Other studies indicate that a global activation of MAPK signaling occurs when corneal epithelial cells are exposed to hyperosmolar stress.1 We examined ERK and p38 MAPK activities after hypertonicity-stimulated TRPV1-EGFR signaling.
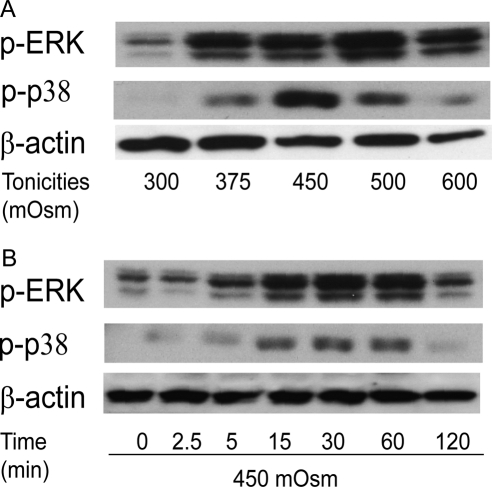
Hyperosmotic stimuli induced ERK and p38 phosphorylation in ways that were tonicity and time dependent. Increases in tonicities from 300 to 600 mOsm elicited biphasic changes in the amounts of p-ERK and p-p38 (Fig. 3A), with maximal p-ERK and p-p38 formations at 500 mOsm and 450 mOsm, respectively. Figure 3B shows that on exposure to 450 mOsm, p-ERK and p-p38 formation was elevated until 60 minutes, followed by partial return to basal levels at 120 minutes
Figure 3.
Hypertonicity activation of ERK and p38 MAPK in a tonicity- and a time-dependent manner. (A) Cells were exposed to 300, 375, 450, 500, and 600 mOsm media for 15 minutes. (B) Cells were exposed to 450 mOsm medium for 0, 2.5, 5, 15, 30, 60, and 120 minutes. Western blot analysis was used to detect phosphorylated ERK (p-ERK) and phosphorylated p38 (p-p38). Membranes were then stripped and reprobed for β-actin to validate the loading equivalence.
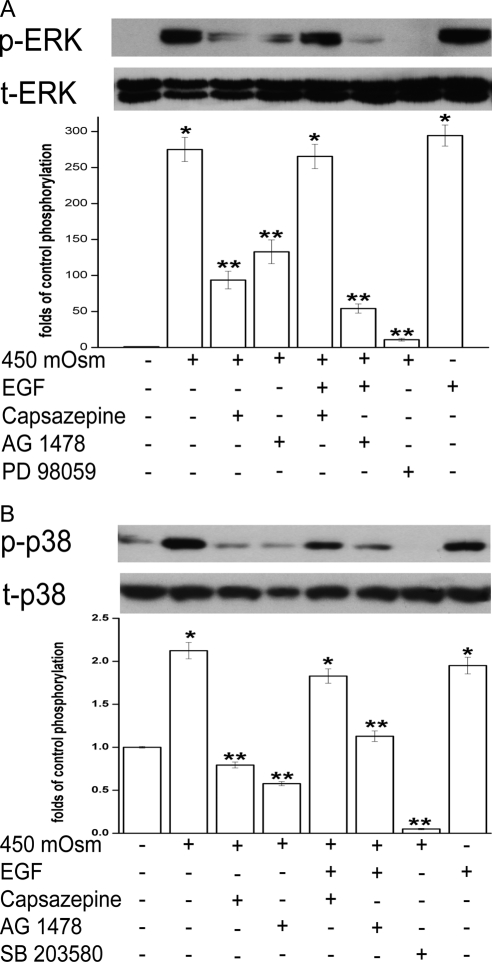
To determine the roles of TRPV1 and EGFR in mediating MAPK responses to a hyperosmotic challenge, the effect of either TRPV1 or EGFR suppression on ERK and p38 phosphorylation was studied. In Figure 4A, capsazepine (10 μM, lane 3) and AG 1478 (10 μM, lane 4) suppressed ERK phosphorylation (p-ERK) during exposure to 450 mOsm by 66% and 51%, respectively. In addition, ERK phosphorylation was abolished by its inhibitor, PD 98059 (10 μM, lane 7). EGF rescued capsazepine-suppressed p-EGFR but did not alter AG 1478 inhibition of p-EGFR in the presence of the hyperosmotic medium (Fig. 2A). We evaluated whether EGF had the same effect on p-ERK as it had on p-EGFR formation when either TRPV1 or EGFR was inhibited. Accordingly, cells were exposed to 450 mOsm medium supplemented with 5 ng/mL EGF after pretreatment with either capsazepine (10 μM) or AG 1478 (10 μM). The combination of EGF and hyperosmotic stimuli resulted in complete recovery of p-ERK formation from capsazepine suppression (Fig. 4A, lane 3 vs. lane 5). The amount of p-ERK returned to the same level as that induced by 450 mOsm medium or EGF alone (lanes 2 and 8). However, this double-stimuli strategy did not overcome AG 1478 inhibition of p-ERK (lane 6). In other words, EGF prevented capsazepine from suppressing hypertonicity-induced ERK phosphorylation. This occurred because EGF can directly activate EGFR-linked MAPK signaling. Therefore, hypertonicity-induced ERK activation is dependent on EGFR transactivation by TRPV1.
Figure 4.
Effects of TRPV1 and EGFR modulation on hypertonicity-induced ERK and p38 MAPK activation. (A) Cells were pretreated for 30 minutes with capsazepine (10 μM), AG 1478 (10 μM), or an ERK inhibitor PD 98059 (10 μM) before exposure to 450 mOsm medium or EGF (5 ng/mL). Cell extracts were subjected to Western blot analysis with anti–p-ERK. Membranes were then stripped and reprobed for total ERK (t-ERK) using anti–t-ERK antibody. (B) Cells were pretreated for 30 minutes with either capsazepine (10 μM), AG 1478 (10 μM), or p38 inhibitor SB 203580 (10 μM) before exposure to 450 mOsm medium or EGF (5 ng/mL). Cell extracts were subjected to Western blot analysis with anti–p-p38. Membranes were then stripped and reprobed for total p38 (t-p38) using anti–t-p38 antibody. Results are summarized in bar graphs and expressed in mean ± SEM (n = 3). *P < 0.01 vs. untreated control. **P < 0.01 vs. treated with 450 mOsm medium alone.
Similarly, the hypertonicity-stimulated p38 response to either TRPV1 or EGFR inhibition mirrors the ERK response. In Figure 4B, either capsazepine(10 μM, lane 3), AG 1478 (10 μM, lane 4), or a p38 antagonist, SB 203580 (10 μM, lane 7), suppressed hypertonicity-stimulating phosphorylated p38 to levels lower than their control (lanes 3, 4, 7). Exposure to a combination of EGF (5 ng/mL) and the 450 mOsm medium restored p-p38 formation despite the presence of capsazepine; phosphorylation of p38 reached 1.3-fold the level of p38 formation induced by 450 mOsm medium alone (lane 3 vs. lane 5). In the presence of EGF, AG 1478 suppressed p-p38 formation near the control level (lane 6). Therefore, hypertonicity activated ERK and p38 MAPK through TRPV1-mediated EGFR transactivation.
NF-κB Is Activated after TRPV1 Transactivation of EGFR
NF-κB activation mediates a host of physiological responses that include increases in proinflammatory cytokine release.26–28 We determined the impact of hyperosmotic stress on NF-κB in the presence of an inhibitor of TRPV1, EGFR, ERK, or p38. To make this assessment, NF-κB activation was evaluated based on changes in phosphorylation status of the NF-κB inhibitory component, IκB-α, in response to 450 mOsm medium. Such a readout evaluates NF-κB activation because NF-κB stimulation occurs only when IκB-α is phosphorylated, which enables IκB-α to detach from its complexation with NF-κB and allows active components of NF-κB, RelA, and p50 to translocate to the nucleus and initiate gene transcription and expression.
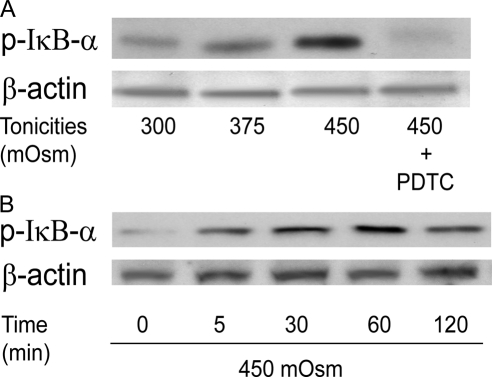
Figure 5A shows that increases in IκB-α phosphorylation (p-IκB-α) occurred in a tonicity-dependent manner after 1-hour exposure to either 300 (isosmotic), 375, or 450 mOsm medium. The selectivity of these effects was validated by showing that with the NF-κB inhibitor PDTC (50 μM, lane 4), IκB-α phosphorylation was completely suppressed. Figure 5B shows that with 450 mOsm medium, p-IκB-α formation increased to reach a maximal level after 1 hour, which was followed by a partial decline during the next hour.
Figure 5.
Hypertonicity stimulation of IκB-α phosphorylation in tonicity and in a time-dependent manner. (A) Cells were exposed to 300, 375, and 450 mOsm media for 1 hour. Specificity of IκB-α phosphorylation was validated with pretreatment of NF-κB inhibitor PDTC (50 μM) before exposure to 450 mOsm medium. (B) Cells were exposed to 450 mOsm medium for 0, 5, 30, 60, and 120 minutes. Cell extracts were subjected to Western blot analysis for phosphorylated IκB-α (p-IκB-α) with anti–p-IκB-α antibody. Membranes were then stripped and reprobed for β-actin using anti–β-actin antibody to validate load equivalence.
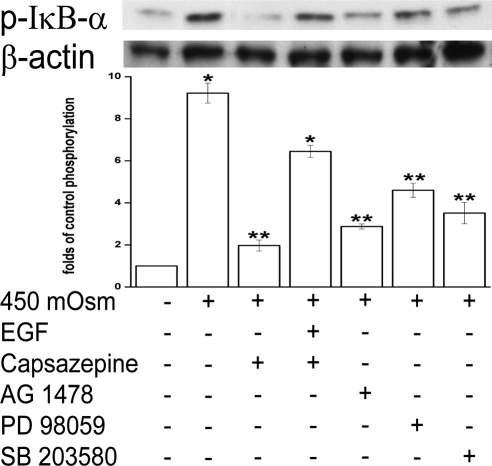
To document how 450 mOsm stress induced p-IκB-α formation, we compared the effects of TRPV1, EGFR, ERK, or p38 inhibition on this response. Figure 6 shows that at 1 hour p-IκBα formation increased by more than 8-fold. Ten μM capsazepine suppressed p-IκB-α by approximately 90% (lane 3). AG 1478 (10 μM), PD 98059, and SB 203580 suppressed p-IκB-α formation by 77%, 56%, and 69%, respectively (lanes 5–7). With capsazepine (10 μM) in the 450 mOsm medium, EGF (5 ng/mL) supplementation induced an approximately 4.6-fold increase in p-IκB-α formation above that obtained in the absence of EGF (lane 3 vs. lane 4). Declines of p-IκB-α formation elicited by the suppression of EGFR, ERK, and p38 MAPK confirm that EGFR and its linked MAPK signaling contribute to NF-κB activation. However, these individual declines did not reach the baseline level, suggesting potential signaling pathways in addition to those linked with EGFR affect NF-κB activity.
Figure 6.
Effects of modulation of TRPV1, EGFR, ERK, and p38 on hypertonicity-induced IκB-α phosphorylation. Cells were pretreated for 30 minutes with capsazepine (10 μM), AG 1478 (10 μM), PD 98059 (10 μM), or SB 203580 (10 μM) before exposure to 450 mOsm medium or EGF (5 ng/mL). Cell extracts were probed for p-IκB-α by Western blot analysis. Membranes were then stripped and reprobed for β-actin using anti–β-actin antibody. Results were summarized in bar graphs and expressed as mean ± SEM (n = 3). *P < 0.01 vs. untreated control. **P < 0.01 vs. treated with 450 mOsm medium alone.
Hypertonicity Induces Increases in IL-6 and IL-8 Release through TRPV1 Activation and EGFR Pathway Transactivation
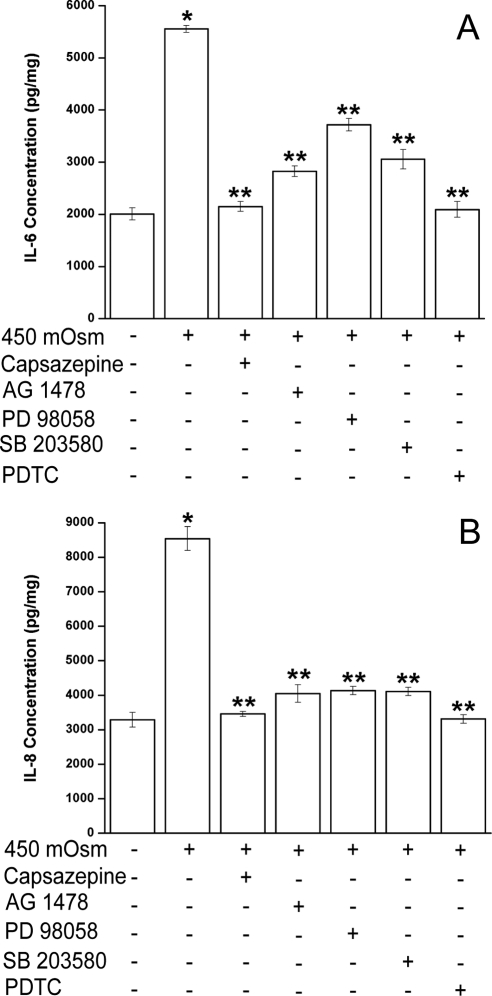
TRPV1 channel activation by capsaicin in HCECs induces increases in IL-6 and IL-8 release through transient increases in plasma membrane Ca2+ and global MAPK stimulation.16 We determined whether exposure to 450 mOsm induced a similar response through the same pathways activated by capsaicin. In 450 mOsm hyperosmotic medium, IL-6 (Fig. 7A) and IL-8 (Fig. 7B) release increased by 2.8- and 2.6-fold (lane 2), respectively, whereas capsazepine (10 μM) abolished such increases (lane 3). Therefore, hypertonicity-induced increases in IL-6 and IL-8 release are largely elicited through TRPV1activation by this challenge.
Figure 7.
Effects of TRPV1, EGFR, ERK, p38, and NF-κB inhibition on hypertonicity-induced increases in IL-6 and IL-8 release. Cells were pretreated for 30 minutes with capsazepine (10 μM), AG 1478 (10 μM), PD 98059 (10 μM), SB 203580 (10 μM), or NF-κB inhibitor PDTC (50 μM) before exposure to 450 mOsm medium. After 24 hours' incubation, supernatants were collected and analyzed for IL-6 (A) and IL-8 (B) using ELISA. Results were normalized to sample protein concentrations (picogram per milligram protein lysates) and summarized in bar graphs expressed as mean ± SEM (n = 3). *P < 0.05 vs. untreated control. **P < 0.05 vs. treated control with 450 mOsm medium alone.
The role of EGFR and its linked MAPK and NF-κB pathway in the stimulation of IL-6 and IL-8 release was studied by blocking EGFR, ERK, p38, or NF-κB phosphorylation. In Figures 7A and 7B, inhibition of EGFR activation by AG 1478 (lane 4) resulted in decreases of IL-6 and IL-8 release by 77% and 86%, ERK inhibitor PD 98059 (10 μM, lane 5) by 52% and 84%, and p38 inhibitor SB 203580 (10 μM, lane 6) by 71% and 84%, respectively. PDTC (50 μM, lane 7) abrogated these increases in IL-6 and IL-8 release. Thus, blockage of any aforementioned component activated by hypertonicity resulted in declines in IL-6 and IL-8 release. Inhibition of TRPV1 or NF-κB completely suppressed IL-6 and IL-8, whereas blockage of EGFR or MAPK (ERK and p38) partially suppressed these cytokines. This result is consistent with the finding that only a fraction of hypertonicity-induced NF-κB phosphorylation is attributable to EGFR and MAPK signaling pathways (Fig. 6).
Discussion
In HCECs, capsaicin induced TRPV1 channel activation followed by increases in plasma membrane Ca2+ influx leading to global MAPK stimulation and increases in IL-6 and IL-8 release.16 Some studies show that TRPV1 is required for osmosensing hypertonic stimulus in various tissues.11,14 We sought to determine whether hyperosmotic stress can also induce TRPV1 activation and increased IL-6 and IL-8 release in HCECs given that increased tear film osmolarity is associated with tissue inflammation in dry eye disease. Indeed, we found that hyperosmotic stress induced TRPV1 activation, leading to increases in IL-6 and IL-8 release. This occurred through EGFR transactivation and its linked MAPK and NF-κB signaling pathway stimulation.
Exposure to a 450 mOsm medium induced a transient increase in plasma membrane Ca2+ influx (Fig. 1A). TRPV1 activation accounted for this response because capsazepine or JYL 1421 reduced such influx, whereas PGE2 enhanced hypertonicity-mediated TRPV1 Ca2+ influx (Fig. 1B). This effect of PGE2 may be attributable to TRPV1 sensitization because PGE2 in rabbit corneal epithelial cells stimulates adenylate cyclase leading to elevated cAMP levels and protein kinase A (PKA) activation.39In some other tissues, it was shown that there are consensus phosphorylation sites on TRPV1 for PKA-mediated sensitization of this channel.7,34 However, hypertonicity-induced Ca2+ transients through plasma membrane TRPV1 activation do not entirely account for these responses. This is indicated because the suppression of TRPV1 did not completely suppress Ca2+ transients (Fig. 1B). Similar results are found in dorsal root ganglion neurons in which heat-induced TRPV1 activation accounts for only 47% of the increases in intracellular Ca2+, whereas total extracellular Ca2+ influx accounts for 76%.40 A possible source for the remaining intracellular Ca2+ increases may be release from intracellular Ca2+ stores. Several possible pathways—IP3- and ryanodine-sensitive Ca2+ pathways, which were identified in corneal epithelial cells and in some other tissues—can mediate such release.40–42 Therefore, hypertonicity-induced Ca2+ transients may arise from both TRPV1-mediated trans-plasma membrane influx and release from intracellular store, though TRPV1 stimulation accounts for most of the increases in intracellular Ca2+ influx.
EGFR and its linked signaling pathways serve as a hub for various extracellular stimuli to elicit cell inflammation, proliferation, migration, and differentiation. These stimuli include G-protein–coupled receptor ligands (phenylephrine, carbachol, thrombin, endothelin-1), physical/chemical stress (Ca2+ or K+ influx, wound, UV-B, oxidative stress, anisosmotic conditions), and growth factors and cytokines (EGF, insulin-like growth factor, basic fibroblast growth factor, IL-1β, IL-8).43,44 With hypertonic stress, EGFR transactivation occurs to induce increases in inflammatory mediator PGE2 and cyclooxygenases-2 (COX-2) stimulation in renal medullary epithelial cells. 45 EGFR transactivation in corneal epithelial cells occurred through TRPV1 activation by hypertonic stress, leading to MAPK/NF-κB signaling pathway stimulation. Such activation, in turn, induced increases in IL-6 and IL-8 release. Our finding that TRPV1 activation by hypertonic stress induced increases in IL-6 and IL-8 release broadens the diversity of responses in HCECs that can be induced by EGFR transactivation.
The fact that EGF relieved capsazepine inhibition of EGFR phosphorylation (Fig. 2A), ERK and p38 MAPK activation (Figs. 4A, 4B) and IκB-α stimulation (Fig. 6) validates that hypertonicity-stimulated TRPV1 transactivates EGFR. We found, as reported in a number of previous studies,21 that EGFR transactivation is dependent on MMP-1 activation, leading to EGF release from its binding to heparin by sheddase (Fig. 2B). This is evident because hypertonicity-induced EGFR transactivation was blocked by preinhibiting MMPs with TIMP-1 or GM6001 and HB-EGF sheddase with CRM 197. Yin and Yu46 documented that early (up to 10 minutes) ERK activation by ATP, LPA, or wounding contributes to a disintegrin and metalloprotease (ADAM) activation and shedding of EGF from heparin EGF in HCECs, whereas ERK activation after 10 minutes is dependent on EGFR stimulation. Such early ERK activation was instead controlled by calcium influx, Src kinase and PKC activation.46 We found that hypertonic challenge–induced MAPK stimulation (Fig. 4) was obtained at 15 minutes. Presumably by this time both EGFR-independent and -dependent ERK activation occurred. This consideration might explain why hypertonicity-activated ERK was only partially blocked by the EGFR inhibitor AG 1478 (Fig. 4A), whereas at the same time p38 activation was completely reduced to the control level by the same compound (Fig. 4B). AG1478 only blocked the portion of phosphorylated ERK that was dependent on EGFR. Our finding that hypertonic-induced TRPV1 activation led to EGFR transactivation suggested that increases in Ca2+ influx may be prerequisite for EGFR transactivation. This suggestion is supported by two studies in which ionomycin-dependent Ca2+ influx activated EGFR by stimulating metalloproteinase cleavage of HB-EGF.47,48
Hypertonic stress–increased IL-6 and IL-8 release was largely but incompletely suppressed by the EGFR inhibitor AG1478 (Fig. 7). Similarly, the suppression of EGFR did not abolish ERK, p38 (Figs. 4A, 4B), or NF-κB (Fig. 6). One explanation for this partial rather than complete inhibitory effect of AG1478 is that TRPV1 activation results in the stimulation of additional signaling pathways parallel to EGFR transactivation. Such a parallel cascade complements canonical EGFR-dependent signaling either by enhancing the magnitude of NF-κB or by modulating the duration or magnitude of MAPK activation.
Transforming growth factor β–activated kinase 1 (TAK1) is indicated in mediating LPS-induced expression of inflammatory mediators through NF-κB and p38 MAPK activation.49 Our data (unpublished, 2009) also show a role for TAK1 in TRPV1 signaling because only capsaicin, but not EGF, caused the phosphorylation of TAK1, which was suppressed by TAK1 inhibitor 5Z-7-oxozeaenol. Should TAK-1 mediate EGFR-independent NF-κB and MAPK activation after TRPV1 stimulation, TRPV1 activation–elicited inflammatory responses can be the result of combined contributions by EGFR-dependent and TAK-dependent (EGFR-independent) NF-κB signaling pathways.
Alternatively, control of the duration and magnitude of MAPK activation may contribute to different outcomes by capsaicin and EGF. Compared with EGF or hypotonicity, hypertonicity-induced ERK and p38 MAPK activation was slower.22,50 When exposed to the 450 mOsm solution, phospho-Erk1/2 and phospho-p38 lasted more than 2 hours with the peak at 1 hour (Fig. 3A), whereas with EGF or hypotonic stress, activation occurred within 2 hours with the peak within 15 minutes.23,51 Such a difference in duration and magnitude of MAPK activation may be modulated through mediated negative feedback control of mitogen kinase protein phosphatases (MKP/DUSP).24 Glycogen synthase kinase (GSK)-3 further regulates MPK/DUSP activity. Active GSK-3, trademarked by its dephosphorylated form, phosphorylates and stabilizes DUSP1, which enables DUSP1 to dephosphorylate and suppress ERK and p38 signaling. However, once GSK-3 is inactivated by EGF-induced phosphorylation, its control of MAPK signaling through DUSP1 is lost. Our recent study (unpublished data, 2010) shows that TRPV1 activation of JNK MAPK was also regulated by the same mechanism. In DUSP1 knockdown cells, capsaicin induced longer JNK phosphorylation and larger increases in IL-6 and IL-8 than in occurred in wild-type cells. On the other hand, in macrophages and other epithelial cells, overexpression of DUSP1 shortened ERK, p38, and JNK activation, leading to the suppression of proinflammatory cytokine expression.52–55 These results suggest that TRPV1 activation may elicit, through EGFR-linked signaling, increases in IL-6 and IL-8 release by causing more rapid GSK-3 inhibition/phosphorylation than that induced by EGF. As a result, DUSP1 degradation occurs so promptly that MAPK signaling activation gradually increases, leading to increases in IL-6 and IL-8 release. Efforts are warranted to address the effect of hyperosmotic stimuli on DUSP phosphorylation and stabilization.
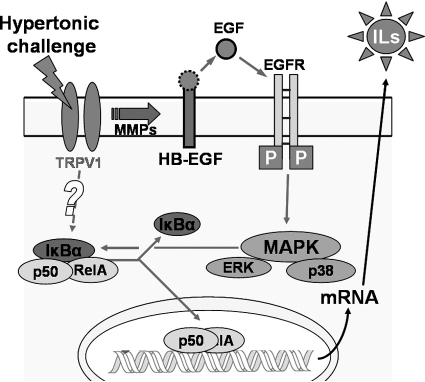
In summary, our results show that hyperosmotic stress–induced increases in IL-6 and IL-8 release are dependent on TRPV1 activation. Such stimulation transactivates EGFR through MMP-mediated HB-EGF ectoderm shedding, consequently activating ERK and p38 MAPK and NF-κB signaling pathways. In addition, TRPV1 may activate a parallel EGFR-independent signaling cascade, which enhances NF-κB activation magnitude and inflammatory cytokine expression (Fig. 8). The identity of such a parallel pathway and its interaction with the TRPV1/EGFR/MAPK/NF-κB pathway is promised for future investigation.
Figure 8.
Signaling pathways mediating hypertonicity stimulated increases in IL-6 and IL-8. Hypertonic stress activated the TRPV1 channel. TRPV1 stimulation leads to the transactivation of EGFR through MMP-dependent HB-EGF shedding, followed by MAPK and NF-κB activation and to EGFR-independent NF-κB stimulation. Activated NF-κB translocates to nucleus and promotes the production of IL-6 and IL-8.
Footnotes
Supported by National Institutes of Health Grant EY04795.
Disclosure: Z. Pan, None; Z. Wang, None; H. Yang, None; F. Zhang, None; P.S. Reinach, None
References
- 1.Luo L, Li DQ, Corrales RM, Pflugfelder SC. Hyperosmolar saline is a proinflammatory stress on the mouse ocular surface. Eye Contact Lens. 2005;31:186–193 [DOI] [PubMed] [Google Scholar]
- 2.Tomlinson A, Khanal S, Ramaesh K, Diaper C, McFadyen A. Tear film osmolarity: determination of a referent for dry eye diagnosis. Invest Ophthalmol Vis Sci. 2006;47:4309–4315 [DOI] [PubMed] [Google Scholar]
- 3.Gilbard JP, Kenyon KR. Tear diluents in the treatment of keratoconjunctivitis sicca. Ophthalmology. 1985;92:646–650 [DOI] [PubMed] [Google Scholar]
- 4.Papa V, Aragona P, Russo S, Di Bella A, Russo P, Milazzo G. Comparison of hypotonic and isotonic solutions containing sodium hyaluronate on the symptomatic treatment of dry eye patients. Ophthalmologica. 2001;215:124–127 [DOI] [PubMed] [Google Scholar]
- 5.Alessandri-Haber N, Yeh JJ, Boyd AE, et al. Hypotonicity induces TRPV4-mediated nociception in rat. Neuron. 2003;39:497–511 [DOI] [PubMed] [Google Scholar]
- 6.Becker D, Blase C, Bereiter-Hahn J, Jendrach M. TRPV4 exhibits a functional role in cell-volume regulation. J Cell Sci. 2005;118:2435–2440 [DOI] [PubMed] [Google Scholar]
- 7.Amadesi S, Cottrell GS, Divino L, et al. Protease-activated receptor 2 sensitizes TRPV1 by protein kinase C epsilon- and A-dependent mechanisms in rats and mice. J Physiol. 2006;575:555–571 [DOI] [PMC free article] [PubMed] [Google Scholar]
- 8.Liedtke W, Choe Y, Marti-Renom MA, et al. Vanilloid receptor-related osmotically activated channel (VR-OAC), a candidate vertebrate osmoreceptor. Cell. 2000;103:525–535 [DOI] [PMC free article] [PubMed] [Google Scholar]
- 9.Strotmann R, Harteneck C, Nunnenmacher K, Schultz G, Plant TD. OTRPC4, a nonselective cation channel that confers sensitivity to extracellular osmolarity. Nat Cell Biol. 2000;2:695–702 [DOI] [PubMed] [Google Scholar]
- 10.Sidhaye VK, Guler AD, Schweitzer KS, D'Alessio F, Caterina MJ, King LS. Transient receptor potential vanilloid 4 regulates aquaporin-5 abundance under hypotonic conditions. Proc Natl Acad Sci U S A. 2006;103:4747–4752 [DOI] [PMC free article] [PubMed] [Google Scholar]
- 11.Liu L, Chen L, Liedtke W, Simon SA. Changes in osmolality sensitize the response to capsaicin in trigeminal sensory neurons. J Neurophysiol. 2007;97:2001–2015 [DOI] [PubMed] [Google Scholar]
- 12.Sharif Naeini R, Witty MF, Seguela P, Bourque CW. An N-terminal variant of Trpv1 channel is required for osmosensory transduction. Nat Neurosci. 2006;9:93–98 [DOI] [PubMed] [Google Scholar]
- 13.Yokoyama T, Saito T, Ohbuchi T, et al. TRPV1 gene deficiency attenuates miniature EPSC potentiation induced by mannitol and angiotensin II in supraoptic magnocellular neurons. J Neurosci. 2010;30:876–884 [DOI] [PMC free article] [PubMed] [Google Scholar]
- 14.Ciura S, Bourque CW. Transient receptor potential vanilloid 1 is required for intrinsic osmoreception in organum vasculosum lamina terminalis neurons and for normal thirst responses to systemic hyperosmolality. J Neurosci. 2006;26:9069–9075 [DOI] [PMC free article] [PubMed] [Google Scholar]
- 15.Taylor AC, McCarthy JJ, Stocker SD. Mice lacking the transient receptor vanilloid potential 1 channel display normal thirst responses and central Fos activation to hypernatremia. Am J Physiol Regul Integr Comp Physiol. 2008;294:R1285–R1293 [DOI] [PubMed] [Google Scholar]
- 16.Zhang F, Yang H, Wang Z, et al. Transient receptor potential vanilloid 1 activation induces inflammatory cytokine release in corneal epithelium through MAPK signaling. J Cell Physiol. 2007;213:730–739 [DOI] [PubMed] [Google Scholar]
- 17.Gschwind A, Zwick E, Prenzel N, Leserer M, Ullrich A. Cell communication networks: epidermal growth factor receptor transactivation as the paradigm for interreceptor signal transmission. Oncogene. 2001;20:1594–1600 [DOI] [PubMed] [Google Scholar]
- 18.Gao N, Kumar A, Jyot J, Yu FS. Flagellin-induced corneal antimicrobial peptide production and wound repair involve a novel NF-kappaB-independent and EGFR-dependent pathway. PLoS One. 2010;5:e9351. [DOI] [PMC free article] [PubMed] [Google Scholar]
- 19.Bildin VN, Wang Z, Iserovich P, Reinach PS. Hypertonicity-induced p38MAPK activation elicits recovery of corneal epithelial cell volume and layer integrity. J Membr Biol. 2003;193:1–13 [DOI] [PubMed] [Google Scholar]
- 20.Luo L, Li DQ, Doshi A, Farley W, Corrales RM, Pflugfelder SC. Experimental dry eye stimulates production of inflammatory cytokines and MMP-9 and activates MAPK signaling pathways on the ocular surface. Invest Ophthalmol Vis Sci. 2004;45:4293–4301 [DOI] [PubMed] [Google Scholar]
- 21.Xu KP, Ding Y, Ling J, Dong Z, Yu FS. Wound-induced HB-EGF ectodomain shedding and EGFR activation in corneal epithelial cells. Invest Ophthalmol Vis Sci. 2004;45:813–820 [DOI] [PMC free article] [PubMed] [Google Scholar]
- 22.Ebisuya M, Kondoh K, Nishida E. The duration, magnitude and compartmentalization of ERK MAP kinase activity: mechanisms for providing signaling specificity. J Cell Sci. 2005;118:2997–3002 [DOI] [PubMed] [Google Scholar]
- 23.Wang Z, Yang H, Tachado SD, et al. Phosphatase-mediated crosstalk control of ERK and p38 MAPK signaling in corneal epithelial cells. Invest Ophthalmol Vis Sci. 2006;47:5267–5275 [DOI] [PubMed] [Google Scholar]
- 24.Wang Z, Yang H, Zhang F, Pan Z, Capo-Aponte J, Reinach PS. Dependence of EGF-induced increases in corneal epithelial proliferation and migration on GSK-3 inactivation. Invest Ophthalmol Vis Sci. 2009;50:4828–4835 [DOI] [PubMed] [Google Scholar]
- 25.Brightman FA, Fell DA. Differential feedback regulation of the MAPK cascade underlies the quantitative differences in EGF and NGF signalling in PC12 cells. FEBS Lett. 2000;482:169–174 [DOI] [PubMed] [Google Scholar]
- 26.Denk A, Goebeler M, Schmid S, et al. Activation of NF-kappa B via the Ikappa B kinase complex is both essential and sufficient for proinflammatory gene expression in primary endothelial cells. J Biol Chem. 2001;276:28451–28458 [DOI] [PubMed] [Google Scholar]
- 27.Fritz EA, Jacobs JJ, Glant TT, Roebuck KA. Chemokine IL-8 induction by particulate wear debris in osteoblasts is mediated by NF-kappaB. J Orthop Res. 2005;23:1249–1257 [DOI] [PubMed] [Google Scholar]
- 28.Craig R, Larkin A, Mingo AM, et al. p38 MAPK and NF-kappa B collaborate to induce interleukin-6 gene expression and release: evidence for a cytoprotective autocrine signaling pathway in a cardiac myocyte model system. J Biol Chem. 2000;275:23814–23824 [DOI] [PubMed] [Google Scholar]
- 29.Schwenger P, Alpert D, Skolnik EY, Vilcek J. Activation of p38 mitogen-activated protein kinase by sodium salicylate leads to inhibition of tumor necrosis factor-induced IkappaB alpha phosphorylation and degradation. Mol Cell Biol. 1998;18:78–84 [DOI] [PMC free article] [PubMed] [Google Scholar]
- 30.Kalari S, Zhao Y, Spannhake EW, Berdyshev EV, Natarajan V. Role of acylglycerol kinase in LPA-induced IL-8 secretion and transactivation of epidermal growth factor-receptor in human bronchial epithelial cells. Am J Physiol Lung Cell Mol Physiol. 2009;296:L328–L336 [DOI] [PMC free article] [PubMed] [Google Scholar]
- 31.Bhattacharyya A, Pathak S, Datta S, Chattopadhyay S, Basu J, Kundu M. Mitogen-activated protein kinases and nuclear factor-kappaB regulate _Helicobacter pylori_-mediated interleukin-8 release from macrophages. Biochem J. 2002;368:121–129 [DOI] [PMC free article] [PubMed] [Google Scholar]
- 32.Aga M, Watters JJ, Pfeiffer ZA, Wiepz GJ, Sommer JA, Bertics PJ. Evidence for nucleotide receptor modulation of cross talk between MAP kinase and NF-kappa B signaling pathways in murine RAW 264.7 macrophages. Am J Physiol Cell Physiol. 2004;286:C923–C930 [DOI] [PubMed] [Google Scholar]
- 33.Wang KN, Wondergem R. Effects of hyperosmotic medium on hepatocyte volume, transmembrane potential and intracellular K+ activity. Biochim Biophys Acta. 1991;1069:187–196 [DOI] [PubMed] [Google Scholar]
- 34.Schnizler K, Shutov LP, Van Kanegan MJ, et al. Protein kinase A anchoring via AKAP150 is essential for TRPV1 modulation by forskolin and prostaglandin E2 in mouse sensory neurons. J Neurosci. 2008;28:4904–4917 [DOI] [PMC free article] [PubMed] [Google Scholar]
- 35.Wang Y, Szabo T, Welter JD, et al. High affinity antagonists of the vanilloid receptor. Mol Pharmacol. 2002;62:947–956 [DOI] [PubMed] [Google Scholar]
- 36.Boucher I, Yang L, Mayo C, Klepeis V, Trinkaus-Randall V. Injury and nucleotides induce phosphorylation of epidermal growth factor receptor: MMP and HB-EGF dependent pathway. Exp Eye Res. 2007;85:130–141 [DOI] [PMC free article] [PubMed] [Google Scholar]
- 37.Prenzel N, Zwick E, Daub H, et al. EGF receptor transactivation by G-protein-coupled receptors requires metalloproteinase cleavage of proHB-EGF. Nature. 1999;402:884–888 [DOI] [PubMed] [Google Scholar]
- 38.Chen M, Hu DN, Pan Z, Lu CW, Xue CY, Aass I. Curcumin protects against hyperosmoticity-induced IL-1beta elevation in human corneal epithelial cell via MAPK pathways. Exp Eye Res. 2010;90:437–443 [DOI] [PubMed] [Google Scholar]
- 39.Kang SS, Li T, Xu D, Reinach PS, Lu L. Inhibitory effect of PGE2 on EGF-induced MAP kinase activity and rabbit corneal epithelial proliferation. Invest Ophthalmol Vis Sci. 2000;41:2164–2169 [PubMed] [Google Scholar]
- 40.Greffrath W, Kirschstein T, Nawrath H, Treede R. Changes in cytosolic calcium in response to noxious heat and their relationship to vanilloid receptors in rat dorsal root ganglion neurons. Neuroscience. 2001;104:539–550 [DOI] [PubMed] [Google Scholar]
- 41.Wu X, Yang H, Iserovich P, Fischbarg J, Reinach PS. Regulatory volume decrease by SV40-transformed rabbit corneal epithelial cells requires ryanodine-sensitive Ca2+-induced Ca2+ release. J Membr Biol. 1997;158:127–136 [DOI] [PubMed] [Google Scholar]
- 42.Tao W, Wu X, Liou GI, Abney TO, Reinach PS. Endothelin receptor-mediated Ca2+ signaling and isoform expression in bovine corneal epithelial cells. Invest Ophthalmol Vis Sci. 1997;38:130–141 [PubMed] [Google Scholar]
- 43.Higashiyama S, Iwabuki H, Morimoto C, Hieda M, Inoue H, Matsushita N. Membrane-anchored growth factors, the epidermal growth factor family: beyond receptor ligands. Cancer Sci. 2008;99:214–220 [DOI] [PMC free article] [PubMed] [Google Scholar]
- 44.Cheng H, Kartenbeck J, Kabsch K, Mao X, Marques M, Alonso A. Stress kinase p38 mediates EGFR transactivation by hyperosmolar concentrations of sorbitol. J Cell Physiol. 2002;192:234–243 [DOI] [PubMed] [Google Scholar]
- 45.Zhao H, Tian W, Tai C, Cohen DM. Hypertonic induction of COX-2 expression in renal medullary epithelial cells requires transactivation of the EGFR. Am J Physiol Renal Physiol. 2003;285:F281–F288 [DOI] [PubMed] [Google Scholar]
- 46.Yin J, Yu FS. LL-37 via EGFR transactivation to promote high glucose-attenuated epithelial wound healing in organ-cultured corneas. Invest Ophthalmol Vis Sci. 2010;51:1891–1897 [DOI] [PMC free article] [PubMed] [Google Scholar]
- 47.Dethlefsen SM, Raab G, Moses MA, Adam RM, Klagsbrun M, Freeman MR. Extracellular calcium influx stimulates metalloproteinase cleavage and secretion of heparin-binding EGF-like growth factor independently of protein kinase C. J Cell Biochem. 1998;69:143–153 [DOI] [PubMed] [Google Scholar]
- 48.Horiuchi K, Le Gall S, Schulte M, et al. Substrate selectivity of epidermal growth factor-receptor ligand sheddases and their regulation by phorbol esters and calcium influx. Mol Biol Cell. 2007;18:176–188 [DOI] [PMC free article] [PubMed] [Google Scholar]
- 49.Pang HY, Liu G, Liu GT. Compound FLZ inhibits lipopolysaccharide-induced inflammatory effects via down-regulation of the TAK-IKK and TAK-JNK/p38MAPK pathways in RAW264.7 macrophages. Acta Pharmacol Sin. 2009;30:209–218 [DOI] [PMC free article] [PubMed] [Google Scholar]
- 50.Shaul YD, Seger R. The MEK/ERK cascade: from signaling specificity to diverse functions. Biochim Biophys Acta. 2007;1773:1213–1226 [DOI] [PubMed] [Google Scholar]
- 51.Pan Z, Capo-Aponte JE, Zhang F, Wang Z, Pokorny KS, Reinach PS. Differential dependence of regulatory volume decrease behavior in rabbit corneal epithelial cells on MAPK superfamily activation. Exp Eye Res. 2007;84:978–990 [DOI] [PMC free article] [PubMed] [Google Scholar]
- 52.Lang R, Hammer M, Mages J. DUSP meet immunology: dual specificity MAPK phosphatases in control of the inflammatory response. J Immunol. 2006;177:7497–7504 [DOI] [PubMed] [Google Scholar]
- 53.Sakai A, Han J, Cato AC, Akira S, Li JD. Glucocorticoids synergize with IL-1beta to induce TLR2 expression via MAP kinase phosphatase-1-dependent dual inhibition of MAPK JNK and p38 in epithelial cells. BMC Mol Biol. 2004;5:2. [DOI] [PMC free article] [PubMed] [Google Scholar]
- 54.Chen P, Li J, Barnes J, Kokkonen GC, Lee JC, Liu Y. Restraint of proinflammatory cytokine biosynthesis by mitogen-activated protein kinase phosphatase-1 in lipopolysaccharide-stimulated macrophages. J Immunol. 2002;169:6408–6416 [DOI] [PubMed] [Google Scholar]
- 55.Zhao Q, Shepherd EG, Manson ME, Nelin LD, Sorokin A, Liu Y. The role of mitogen-activated protein kinase phosphatase-1 in the response of alveolar macrophages to lipopolysaccharide: attenuation of proinflammatory cytokine biosynthesis via feedback control of p38. J Biol Chem. 2005;280:8101–8108 [DOI] [PubMed] [Google Scholar]
