Immunoinhibitory Adapter Protein Src Homology Domain 3 Lymphocyte Protein 2 (SLy2) Regulates Actin Dynamics and B Cell Spreading (original) (raw)
Abstract
Appropriate B cell activation is essential for adaptive immunity. In contrast to the molecular mechanisms that regulate positive signaling in immune responses, the counterbalancing negative regulatory pathways remain insufficiently understood. The Src homology domain 3 (SH3)-containing adapter protein SH3 lymphocyte protein 2 (SLy2, also known as hematopoietic adapter-containing SH3 and sterile α-motif (SAM) domains 1; HACS1) is strongly up-regulated upon B cell activation and functions as an endogenous immunoinhibitor in vivo, but the underlying molecular mechanisms of SLy2 function have been elusive. We have generated transgenic mice overexpressing SLy2 in B and T cells and have studied the biological effects of elevated SLy2 levels in Jurkat and HeLa cells. Our results demonstrate that SLy2 induces Rac1-dependent membrane ruffle formation and regulates cell spreading and polarization and that the SLy2 SH3 domain is essential for these effects. Using immunoprecipitation and confocal microscopy, we provide evidence that the actin nucleation-promoting factor cortactin is an SH3 domain-directed interaction partner of SLy2. Consistent with an important role of SLy2 for actin cytoskeletal reorganization, we further show that SLy2-transgenic B cells are severely defective in cell spreading. Together, our findings extend our mechanistic understanding of the immunoinhibitory roles of SLy2 in vivo and suggest that the physiological up-regulation of SLy2 observed upon B cell activation functions to counteract excessive B cell spreading.
Keywords: Adapter Proteins, Cellular Immune Response, Lymphocyte, Mouse Genetics, SH3 Domains, Adaptive Immunity, Cytoskeleton, Protein/Protein Interaction, Transgenic Mice
Introduction
During cell spreading, a dynamic cortical network of actin fibers is constructed that enables the leading edge to protrude (1). In the adaptive immune system, cortical actin remodeling is essential for the early spreading and contraction displayed by B cells in response to membrane-bound antigens, which maximizes the amount of antigen interacting with the cognate B cell receptor (2). Although the cytomechanical events that underlie B cell responses to antigen and the elaboration of an immunological synapse (IS)3 appear to be related to cell attachment and spreading, the intracellular molecules that regulate these processes are still incompletely understood (3–5).
Reorganization of the actin cytoskeleton in response to diverse adhesive or antigenic stimuli is dependent on adapter and scaffold proteins that physically integrate signaling inputs via their protein/protein interaction domains (6). The Src homology domain 3 (SH3), first described in the nonreceptor protein-tyrosine kinase Src (7, 8), mediates binding to proline-rich sequences in effector proteins. SH3 domains are the most abundant and best characterized protein/protein interaction domains in adapter proteins, although novel SH3 domain-containing proteins with unknown functions continue to be discovered (9).
The SH3-domain protein expressed in the lymphocyte (SLy) family of proteins comprises three members SLy1, SLy2 (also known as hematopoietic adapter containing SH3 and SAM domains 1, HACS1), and the SAM and SH3 domain-containing protein 1 (SASH1). All family members are characterized by an SH3 domain, a SAM protein/protein interaction domain, and a bipartite nuclear localization signal. SLy1 was first reported in 2001 as a protein with preferential expression in lymphoid cells (10). Simultaneously, SLy2 was identified in a transcriptional study of differentially expressed genes in normal and malignant hematopoietic cells (11). SLy2 localizes to a region on human chromosome 21 (21q11.2) that is subject to frequent translocation events in hematopoietic malignancies (12), although there is no direct evidence that SLy2 plays a role in tumors. Besides the immune system, SLy2 is also expressed in heart, brain, placenta, and lung, suggesting more general functions of this protein (11). The third family member, SASH1, is broadly expressed and was first discovered as a candidate tumor suppressor in breast cancer (13) as well as in colon cancer (14).
Endogenous SLy2 expression is strongly up-regulated upon exposure of primary B cells to activation- and differentiation-inducing stimuli, such as interleukin (IL)-4, anti-immunoglobulin (Ig)M, and anti-CD40 (15). Furthermore, overexpression of SLy2 in murine splenic B cells results in an inhibition of proliferation and in an enhancement of differentiation, suggesting a role for SLy2 in B cell differentiation to plasma cells (15). Recently, SLy2-deficient mice were generated (16). Although bone marrow B cell development and splenic B and T cell populations are normal, _SLy2_−/− mice show enhanced adaptive immunity, and splenic B cells showed increased proliferation upon B cell receptor stimulation, demonstrating that SLy2 acts an antiproliferative immunoinhibitory adapter protein in vivo (16). _SLy2_−/− mice phenocopy certain aspects of paired Ig-like receptor B (PIR-B)-deficient mice, and yeast two-hybrid screening and in vitro binding data suggested that PIR-B functions as a SLy2-interacting protein (15).
Very little is known about the cell's biological functions of SLy2 and the identity and roles of other physiological SLy2-interacting proteins. Here, we have employed a transgenic mouse model approach to overexpress SLy2 in B cells, and we have generated SLy2-expressing cell lines to examine the molecular mechanisms of SLy2 function. Our studies reveal an unexpected role for SLy2 in the reorganization of the actin cytoskeleton and demonstrate that SLy2 overexpression prevents B cell spreading and contraction. These findings provide a molecular mechanism for the immunoinhibitory functions of SLy2 in vivo.
EXPERIMENTAL PROCEDURES
Generation of SLy2-transgenic Mice and Isolation of Splenocytes
SLy2-transgenic mice were generated by Miltenyi Biotec by pronucleus injection into 129/SvJ Ola zygotes. The SLy2 expression construct contained a HA-tagged murine SLy2 cDNA cloned behind a chimeric promoter consisting of the proximal lck promoter and the IgH enhancer, which results in a robust transgene expression in T and B cells (17). The SLy2-transgenic mice (129/SvJ × C57BL/6 mixed backgrounds, backcrossed for two generations into the C57BL/6 background) were kept in an animal facility under specific pathogen-free conditions. Both male and female animals were included in the study as we found no sex-dependent differences on any of the parameters tested in our analyses (see under “Results”). All animal work was performed in accordance with German animal care regulations.
Splenocytes were freshly isolated from the spleens of SLy2-transgenic mice or their age-matched appropriate controls. The spleens were isolated, and single cell suspensions were prepared by homogenizing the tissues through 70-μm cell strainers (BD Biosciences). Cells were pelleted by centrifugation (1200 rpm, 10 min, 4 °C) and were resuspended in 1 ml of erythrocyte lysis buffer (155 mm NH4Cl, 10 mm KHCO3, 100 mm EDTA) per spleen. Erythrocytes were lysed for 5 min at room temperature. Lysis was stopped by the addition of 10 ml of PBS, and intact cells were recovered by centrifugation. B220− and B220+ cells were separated by MACS (Miltenyi Biotec). B220+ splenocytes were maintained in RPMI 1640 medium (Invitrogen) supplemented with 10% fetal bovine serum (PAN Biotech), 2 mm l-glutamine (Invitrogen), 100 units/ml penicillin (Biochrom), 100 μg/ml streptomycin (Biochrom), and 0.05 mm β-mercaptoethanol. Nucleated blood cells were depleted from erythrocytes with lympholyte M (Cedarlane Laboratories).
Transduction, Transfection, and Plasmids
293T and HeLa cells were cultured in DMEM (Invitrogen) supplemented with 10% fetal bovine serum, 2 mm l-glutamine, 100 units/ml penicillin, and 100 μg/ml streptomycin. For the stable expression of different SLy2 variants, HeLa cells were transduced with lentiviral vectors according to standard protocols, employing the pWPI, psPAX2, and pVSVG plasmids for lentivirus production. This system routinely yielded a transduction efficiency of 90–98% in HeLa cells. For the transient expression of Rac1 mutants, HeLa cells were transfected with FuGENE reagent (Roche Applied Science) according to the manufacturer's instructions. To allow the identification of doubly transfected cells, an mCherry minigene was inserted to the Rac1-V12 and Rac1-N17 expression vectors that were originally constructed by Dr. Philippe Fort (Montpellier, France).
Immunoblotting and Immunoprecipitation
HeLa cells or splenocytes were washed once with PBS and were lysed in lysis buffer (140 mm NaCl; 5 mm MgCl2; 20 mm Tris, pH 7.6; 2 mm NaF; 1% Nonidet P-40; 1 protease inhibitor mixture tablet, EDTA-free (Sigma)) for 15 min on ice. Proteins were separated by SDS-PAGE and transferred to nitrocellulose membranes (PerkinElmer Life Sciences). After blocking nonspecific binding sites with 5% milk in TBST (10 mm Tris-HCl, pH 8.0; 150 mm NaCl; 0.01% Tween 20), membranes were probed with primary antibodies, which were subsequently detected using horseradish peroxidase-linked goat anti-mouse or anti-rabbit IgG (both BD Biosciences) and visualized with the enhanced chemiluminescent detection system (GE Healthcare). Primary α-HA antibodies were from Sigma, and α-cortactin- and α-HS1-directed antibodies were from Cell Signaling. Membranes were reprobed with α-GAPDH (Hytest) as a loading control.
For immunoprecipitation, α-HA antibodies pre-coupled to agarose beads (Sigma) were added to the cleared lysates and were incubated overnight under rotation at 4 °C. The beads were washed four times with lysis buffer, and captured proteins were eluted in 2.5× sample loading buffer at 95 °C for 10 min. These samples were then loaded on an SDS-polyacrylamide gel and immunoblotted as described above.
Immunocytochemistry and Image Acquisition
For immunofluorescence analysis, HeLa cells were grown on gelatin-coated coverslips. Cells were fixed with 4% paraformaldehyde for 20 min at room temperature. The samples were then permeabilized and blocked in PBS containing 0.3% Triton X-100 and 5% goat serum (Dako). Samples were subsequently stained overnight in PBS containing 0.3% Triton X-100 and 1% BSA (fraction V, Sigma). Polymerized actin was visualized using phalloidin-TRITC (Sigma) or phalloidin-Alexa 633 (Invitrogen). SLy2-HA was detected with α-HA antibodies (Sigma), and endogenous cortactin was stained with α-cortactin antibodies (Cell Signaling). Nuclei were visualized with DAPI (Invitrogen). Samples were mounted using Fluoromount-G (Northern Biotech). Images were acquired with a Zeiss LSM 510 confocal laser scanning microscope. The colocalization analyses were conducted using the program ImageJ (National Institutes of Health) with the “colocalization” and the “colocalization finder” plugin.
Flow Cytometry (FACS) Analysis
Cells were suspended in FACS staining buffer (PBS, 2% FCS, 0.02% sodium azide). Splenocytes, thymocytes, and bone marrow cells were incubated with Fc-block (anti-CD16/CD32; BD Biosciences) for 5 min prior to staining to prevent unspecific binding of antibodies to the cells. Cells were stained with the primary antibodies (anti-CD4 (RM4-5), anti-CD8 (53-6.7), anti-CD21 (7G6), anti-CD23 (B3B4), anti-CD25 (7D4), anti-CD44 (IM7), anti-CD138 (281-2), anti-B220 (RA3-6B2), anti-IgD (11-26c.2a), anti-IgM (R6-60.2); all from BD Biosciences) for 20 min on ice. Unbound antibody was removed by washing with FACS staining buffer, and cells were subsequently stained for 20 min on ice with appropriate secondary antibodies or with fluorescently labeled streptavidin in the case of biotin-labeled primary antibodies. Repeated washing removed unbound antibodies, and the cells were resuspended in FACS staining buffer before analysis. All FACS analyses were performed at a FACS Canto II flow cytometer (BD Biosciences). Data were analyzed with FlowJo software.
BrdU Pulse-Chase Assays
To assess the effect of SLy2 on cell proliferation, pulse-chase experiments were performed. HeLa cells were incubated in a medium containing 10 μg/ml BrdU (Sigma) for 8 h. To chase, cells were grown in the absence of added BrdU for up to 5 days. Cells were then processed for immunostaining using a α-BrdU antibody (Dianova) according to the manufacturer's protocol. Briefly, cells were washed in PBS and fixed in 70% EtOH at 4 °C for 30 min. Histones were extracted by incubating the cells for 10 min in 100 mm HCl, 0.5% Triton X-100 on ice. Cells were washed once in double destilled H2O (Invitrogen), and genomic DNA was denatured at 95 °C for 10 min. Subsequently, cells were washed once with PBS, 0.5% Triton X-100 and stained with phycoerythrin-labeled α-BrdU antibodies in PBS, 1% BSA for 30 min at room temperature. The percentage of BrdU+ cells was determined by flow cytometry on a FACS Canto II (BD Biosciences).
Spreading Assays
HeLa cells were detached by incubation in 0.05 mm EDTA for 5 min, and 2–4 × 10⁴ cells were seeded onto gelatin-coated coverslips. Cells were allowed to adhere and spread for 45 min at 37 °C. Nonadherent cells were removed by washing once with PBS, and adherent cells were fixed in 4% paraformaldehyde for 15 min, followed by staining for F-actin as described above. Nuclei were visualized with DAPI. The cells were analyzed by confocal microscopy, and the spreading index of each cell was determined as the ratio of cell length to cell width. The cell area was calculated from the circumference of phalloidin-labeled cells using ImageJ.
For the analysis of B cell spreading, B220+ cells were isolated as described above and were stimulated for 1 h with 5 μg/ml anti-CD40 (BD Biosciences) and 10 ng/ml IL-4 (R&D Systems). After stimulation, 1 × 10⁶ cells were seeded onto coverslips coated with anti-IgM (10 μg/ml in PBS coated for 1 h at 37 °C; BD Biosciences) and were allowed to settle for 30 min on ice before being incubated at 37 °C for up to 30 min to allow for spreading and contraction. After the indicated time points, cells were fixed with 4% paraformaldehyde. F-actin and nuclei were stained as described before, and the cell area was determined from confocal micrographs based on the phalloidin-labeled circumferential F-actin ring at the site of B cell-surface contact zones.
Statistical Analyses
Statistical significance of differences between genotypes or transduced cells was evaluated either with two-way repeated measures ANOVA with Bonferroni's multiple comparison test or with Mann-Whitney Rank sum test as indicated in the figure legends. p < 0.05 was considered statistically significant. All results are presented as mean values ± S.E.
RESULTS
Generation and Characterization of SLy2 Model Cell Lines
The expression of the putative adapter protein SLy2 is physiologically up-regulated in the process of B cell activation (15), leading to increased differentiation and decreased proliferation (16), but the cellular consequences of increased SLy2 expression remain poorly understood.
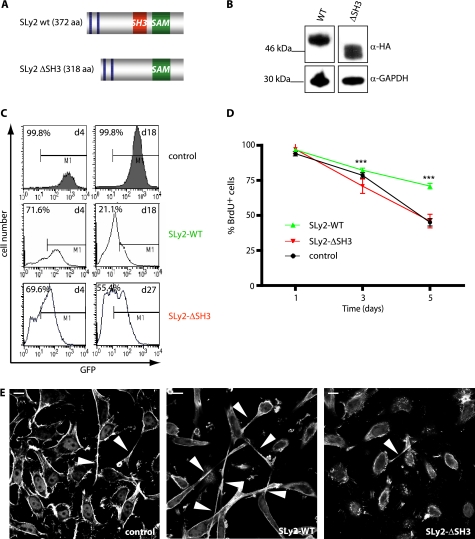
To begin to understand the cellular and organismal functions of increased SLy2 levels, we generated Jurkat and HeLa model cell lines stably expressing SLy2, and we created SLy2-transgenic mice. Jurkat and HeLa cells were transduced with a lentiviral expression vector comprising the complete SLy2 cDNA expressed under the control of the eukaryotic _EF2_α promoter. From the same construct and promoter, GFP was expressed under the control of an internal ribosome entry site (IRES), thus enabling the identification of transduced cells. Control cells were transduced with the empty IRES-GFP vector, resulting in GFP expression alone. Because commercial antibodies capable of detecting endogenous SLy2 protein are not available, SLy2 was additionally fused to an HA tag to allow for its detection by immunofluorescence and immunoblotting. SLy2 contains an internal SH3 domain with yet uncharacterized functions (Fig. 1A). To study the role of this putative protein/protein interaction domain, we also engineered Jurkat and HeLa cell lines expressing the SH3 domain-deficient SLy2-ΔSH3 mutant as an HA-tagged protein. The comparable expression of the wild-type SLy2 and SLy2-ΔSH3 was confirmed by Western blot analysis (Fig. 1B).
FIGURE 1.
Overexpression of SLy2 inhibits cell proliferation. A, schematic representation of the SLy2 domain structure and the SLy2-ΔSH3 construct. aa, amino acids. B, Western blot analysis showing the expression of HA-tagged SLy2-WT (WT) and SLy2-ΔSH3 (Δ_SH3_) in HeLa cells. Blots were probed with anti-GAPDH antibodies as a loading control. C, Jurkat cells were transduced with SLy2-WT (IRES-GFP), SLy2-ΔSH3 (IRES-GFP), or GFP-only expression constructs. The percentage of GFP-positive cells (marker M1) was determined on day (d) 4 and day 18 or 27 after transduction and is indicated in each histogram. D, stably transduced HeLa cells expressing SLy2-WT, SLy2-ΔSH3, or a control construct were pulsed with BrdU, and the cellular BrdU content was monitored for 5 days (n = 4; two-way repeated measures ANOVA with Bonferroni's multiple comparison test: ***, p < 0.0001 for SLy2-WT compared with SLy2-ΔSH3). E, HeLa cells were transduced with the same expression constructs as in D. Cells were seeded onto coverslips, allowed to grow for 24 h, and were stained for F-actin. Shown are representative confocal laser scanning micrographs. Arrowheads indicate cellular extensions (scale bar, 10 μm).
This transduction strategy resulted in an expression efficiency of almost 100%. Interestingly, although control Jurkat cells retained their initial GFP expression levels over the time frame of observation (18 days), SLy2-WT and SLy2-ΔSH3 transduced Jurkat cells progressively lost their GFP marker expression, resulting in about 70% of the initial GFP expression levels on day 4 (Fig. 1C). The percentage of GFP+ cells in the SLy2-WT-transduced Jurkat cells further declined by ∼50% over the course of 2 weeks (Fig. 1C), consistent with previous reports showing that increased SLy2 expression inhibits B cell proliferation (15), whereas SLy2 depletion by RNA interference (15) or homologous recombination (16) stimulates cell proliferation. Interestingly, the population of Jurkat cells engineered to express the SH3 domain-deficient SLy2-ΔSH3 mutant remained relatively constant over time, with >55% of GFP+ cells present 27 days post-transduction as compared with 21% of GFP+ SLy2-WT-overexpressing cells identified 18 days post-transduction (Fig. 1C).
The fact that control Jurkat cells retained higher GFP expression levels over time compared with SLy2-expressing cells suggested that the loss of GFP-positive cells was not due to a nonspecific reduction in GFP expression but rather was due to a SLy2-induced cell loss. To directly investigate whether SLy2 affects the rate of cell proliferation, we conducted bromodeoxyuridine (BrdU) pulse-chase experiments in HeLa cells. The nucleotide analogon BrdU was incorporated into the newly synthesized DNA of dividing cells, and BrdU was subsequently chased at predetermined time points by immunostaining and FACS detection over a period of 5 days. Because the amount of BrdU per cell is reduced with each cell division, BrdU immunoreactivity is inversely correlated with the proliferation rate of a given cell population. SLy2-WT-expressing HeLa cells contained significantly more BrdU on days 3 and 5 of the analysis relative to SLy2-ΔSH3-expressing cells, indicating that their cell division was attenuated (Fig. 1D). Of note, the proliferation rate of HeLa populations expressing SLy2-ΔSH3 was indistinguishable from control transduced cells (Fig. 1D). The labeling rate of all cells was comparable. Together, these results indicate that increased SLy2 expression reduces cell proliferation in an SH3-domain dependent manner and suggest that impaired cell division by SLy2 is a general cellular response because this is observed in both B cells and the HeLa epithelial cell line. Data recently published by our group show that SLy2 is involved in the general regulation of gene expression, which may also account for its antiproliferative effects (18).
Enhanced SLy2 Expression Reorganizes the Actin Cytoskeleton
To further investigate the effects of SLy2-WT or SLy2-ΔSH3 on HeLa cells in more detail, we next seeded cells at low densities on gelatin-coated glass coverslips. Interestingly, around 40% of SLy2-WT-expressing cells displayed a markedly altered morphology with one long cytoplasmic extension, as compared with control or SLy2-ΔSH3-transduced counterparts (around 10% of cells with one predominant extension in both cases), which is indicative of altered cell adhesion or cell spreading (Fig. 1E).
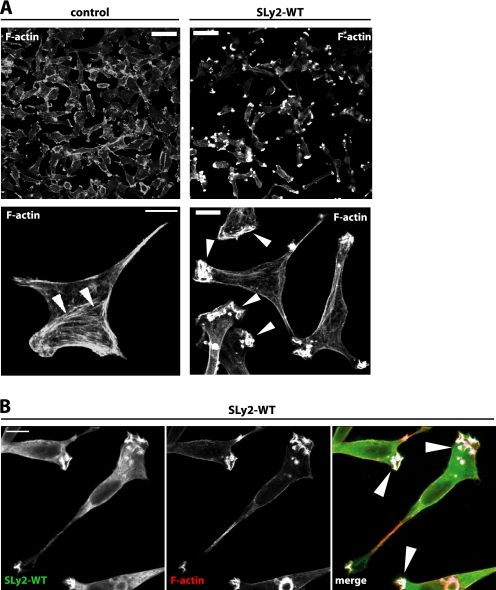
Cellular morphology and cell adhesion is regulated by the actin cytoskeleton (19). We therefore investigated the organization of polymerized actin in SLy2-expressing cells grown overnight on gelatin-coated glass coverslips using confocal laser scanning microscopy. This analysis revealed that SLy2-WT-expressing cells elaborated prominent actin-rich membrane ruffles and were almost completely devoid of stress fibers compared with control cells (Fig. 2A). A loss of stress fibers is frequently observed to accompany the induction of membrane ruffles (20). SLy2-WT-expressing cells were characterized by multiple distal ruffles per cell, often yielding a star- or tripod-like shape. In addition, many SLy2-expressing cells produced long cytoplasmic protrusions (see also Fig. 1E).
FIGURE 2.
SLy2 affects actin dynamics. HeLa cells stably expressing HA-tagged SLy2-WT or a control vector were seeded onto coverslips and allowed to grow overnight. Subsequently, cells were fixed and stained for F-actin with phalloidin (A) or for F-actin and HA with α-HA-directed antibodies (B). HeLa cells overexpressing SLy2 show massive morphological changes. The upper panels display overview pictures (scale bar, 50 μm), and the lower panels show representative single cell images (scale bar, 10 μm). Arrowheads indicate cortical actin and stress fibers (lower left panel) or distal membrane ruffles (lower right panel). B, SLy2 (left panel) and F-actin (middle panel) colocalize in distal membrane ruffles (right panel, merged picture). Shown are confocal laser scanning microscopy images. The images were analyzed for colocalization with ImageJ and the colocalization RGB plug-in. Colocalized data points are displayed as white overlays (arrowheads). Images are representative of three independent experiments.
Interestingly, although a fraction of SLy2-WT was diffusely distributed in the cytoplasm, we also observed SLy2-WT to be recruited to, and to strongly colocalize with, the actin-rich membrane ruffles (Fig. 2B). Thus, ectopic expression of SLy2 not only specifically triggers distal membrane ruffle formation, but the protein also colocalizes with F-actin in these structures, suggesting a function of SLy2 for actin remodeling.
SLy2-mediated Ruffle Formation Is Dependent on Rac1 Activity
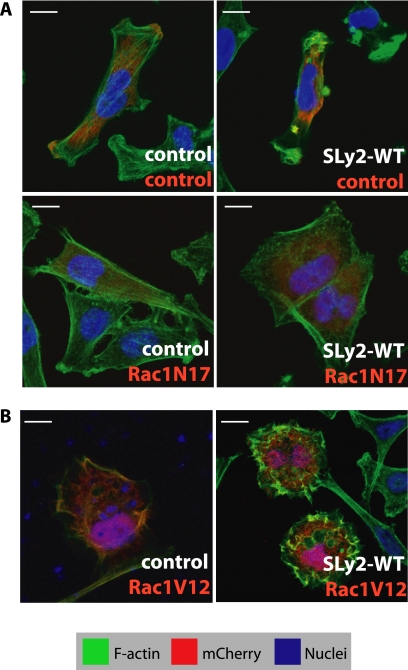
The formation of branched actin structures such as those found in lamellipodia and membrane ruffles is controlled by Rac1, a small GTPase of the Rho family (20). To determine whether the SLy2-mediated ruffle formation was dependent on Rac1 activity, we expressed a dominant-negative mutant of Rac1 (Rac1-N17) or a control construct in SLy2-expressing HeLa cells. Whereas the coexpression of SLy2 and Rac1 mutants proved to be toxic to cells, essentially all cells expressing SLy2 and the control plasmid (as indicated by the expression of mCherry) showed massive ruffle formation. Coexpression of Rac1-N17 entirely reverted this phenotype such that SLy2 and Rac1-N17 coexpressing cells displayed a prominent cortical rim of F-actin and entirely lost the pronounced peripheral ruffles normally induced by SLy2 (Fig. 3A). The cooperativity of SLy2 and Rac1 signaling in F-actin dynamics was further supported by the enhanced ruffling phenotype of HeLa cells expressing SLy2-WT together with the constitutively active Rac1 point mutant Rac1-V12. These cells displayed a strong induction of ruffles encompassing the entire cell cortex and displayed near-round morphology (Fig. 3B). This particular phenotype was not induced by the overexpression of Rac1-V12 alone, which triggered lamellipodia formation (Fig. 3B) (21), nor by expression of SLy2 alone (see Fig. 2A), suggesting that SLy2 and Rac1 act synergistically. Together, these results clearly show that SLy2 cooperates with Rac1 in membrane ruffle formation.
FIGURE 3.
SLy2-mediated actin cytoskeletal reorganization in HeLa cells is dependent on Rac1 activity. A, expression of the dominant-negative Rac1-N17 mutant blocks SLy2 induced ruffle formation. HeLa cells expressing a control construct (left panels) or SLy2-WT (right panels) were transfected with either the mCherry vector alone (upper panels) or with a Rac1-N17 expression construct (lower panels). Transfected cells are marked by the red color indicative of mCherry expression. Cells grown on coverslips were fixed and stained for F-actin (green) and nuclei (blue). Dominant-negative Rac1 abolishes SLy2-induced ruffle formation. Scale bar, 10 μm. B, expression of the constitutively active Rac1-mutant Rac1-V12 enhances SLy2-dependent ruffle formation. Micrographs shown in A and B are confocal images representative of at least three independent experiments.
SLy2-SH3 Domain Is Required for Membrane Ruffle Formation
SH3 domains play important roles for protein/protein interactions and protein targeting (22) and have previously been implicated in actin cytoskeletal reorganization (23). The data presented in Fig. 1B show that the SLy2-SH3 domain is required for the anti-proliferative effects of SLy2. Likewise, the SLy2-SH3 domain appears to mediate morphological changes triggered by increased SLy2 expression in HeLa cells (Fig. 1D).
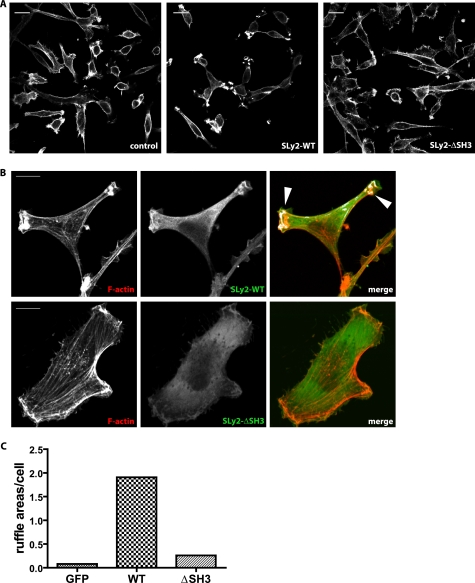
To analyze the potential involvement of the SLy2-SH3 domain in the regulation of the subcellular localization of SLy2 and its effects on the actin cytoskeleton, we compared SLy2-WT with SLy2-ΔSH3-expressing HeLa cells. Strikingly, the deletion of the SH3 domain abolished much of the SLy2 effects on actin dynamics (Fig. 4, A and B). Morphologically, SLy2-ΔSH3-expressing cells resembled control cells and rarely displayed distal ruffles. Rather, SLy2-ΔSH3 cells contained abundant actin stress fibers and a marked cortical actin cytoskeleton. In contrast to SLy2-WT, SLy2-ΔSH3 was predominantly localized in the cytoplasm and was rarely detectable in cortical actin-rich structures (Fig. 4B). This observation was corroborated by the quantification of the ruffle areas per cell (Fig. 4C). Taken together, these data suggest that the SH3 domain of SLy2 is required for its translocation to F-actin structures and for the formation of membrane ruffles.
FIGURE 4.
SLy2-SH3 domain is essential for SLy2-induced actin reorganization and ruffle formation. HeLa cells were transduced with the indicated expression constructs and were seeded onto coverslips. After growing for 24 h, the cells were fixed and stained for the HA-tagged SLy2 with anti-HA antibodies and for F-actin with phalloidin. A, low magnification overview images demonstrate that SLy2-ΔSH3 expressing cells display markedly fewer membrane ruffles but more stress fibers than the SLy2-WT-transduced cells (scale bar, 20 μm). B, single cell images were subjected to a per pixel colocalization analysis using the ImageJ colocalization RGB plug-in. Colocalized data points are displayed as white overlays (arrowheads). The extensive colocalization of SLy2 with F-actin is lost upon deletion of the SH3 domain (scale bar, 10 μm). Images in A and B are representative of at least three independent experiments. C, quantification of separate ruffling areas per cell in control, SLy2-WT-, or SLy2-ΔSH3-expressing cells. At least 58 cells in three independent experiments were scored.
SLy2 SH3 Domain Interacts with Cortactin
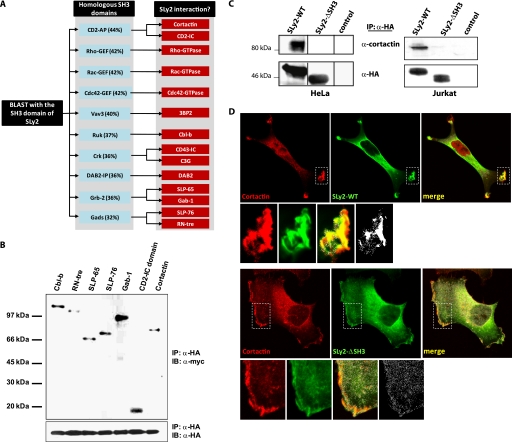
In an attempt to identify a molecular link coupling SLy2 to Rac1-dependent actin cytoskeletal reorganization, we performed a BLAST data based search with the SLy2-SH3 domain. This approach identified 10 proteins with a >30% amino acid sequence identity to the SLy2-SH3 domain (Fig. 5A). Literature searches of known binding partners of these SH3 domains identified 14 candidate SLy2 SH3 domain-binding proteins. These potential SLy2 binding partners were cloned and transiently coexpressed with SLy2 in 293T cells, and their interaction with SLy2 was analyzed by coimmunoprecipitation experiments. This approach resulted in the identification of seven potential SLy2 interactors (Fig. 5B). Four of these (Cbl-b, SLP-65, SLP-76, and Gab-1) represent important players of antigen receptor proximal signaling. The interaction of SLy2 with the intracellular domain of CD2 (LFA-2), which serves as an adhesion molecule in T cell/antigen-presenting cell interactions, suggests a function of SLy2 in T cell receptor signaling. Finally, RN-tre and cortactin represent proteins that are essentially involved in the regulation of the actin cytoskeleton. RN-tre has been found to bind actin, but being a GTPase-activating protein for the GTPases Rab-5 and Rab-43, it mainly exerts effects on endocytosis and membrane trafficking (24, 25). Thus, of the seven candidate SLy2 interactors, only cortactin is known as a master regulator of actin dynamics in membrane protrusions (26). To further investigate the putative interaction between SLy2 and its candidate SH3 domain interactors, HA-tagged SLy2-WT was immunoprecipitated from HeLa or Jurkat cell lysates, and the immunoprecipitates were analyzed for SLy2-associated proteins using specific antibodies. As shown in Fig. 5C, endogenous cortactin robustly interacted with SLy2-WT, whereas the deletion of the putative cortactin interaction domain in the SLy2-ΔSH3 mutant completely abolished this association. In contrast, none of the other putative interactors were confirmed to associate with SLy2 when expressed endogenously (data not shown). Cortactin is a cytosolic multidomain adapter protein, which translocates to the cellular actin cortex in response to various extracellular signals such as growth factors or cell adhesion. Cortactin localization to the cortex promotes the formation of branched actin filaments and increases branched actin stability because of its interactions with F-actin, Arp2/3, and WASP family proteins (26, 27). Interestingly, cortactin knock-out fibroblasts are severely defective in peripheral ruffle formation induced by the platelet-derived growth factor, which can be partially attributed to reduced Rac1 activation in the absence of cortactin (28).
FIGURE 5.
SLy2 interacts with cortactin via the SLy2-SH3 domain. A, homology-based search for SLy2-interacting proteins. A blast search with the SH3 domain of SLy2 was conducted using the NCBI data base. The left box depicts proteins whose SH3 domains are homologous to the SLy2-SH3 domain (the percentage of amino acid identity is indicated in parentheses). Subsequently, PubMed data base was searched for known interactors of these SH3 domains; the identified proteins are listed in the right boxes. B, candidate SLy2 binding partners identified in A were cloned into expression vectors containing a C-terminal Myc tag. Constructs were cotransfected together with a SLy2-WT expression plasmid into 293T cells, and SLy2 was immunoprecipitated using α-HA antibodies, and immunoprecipitates were tested for bound interactors by immunoblotting with α-Myc antibodies. Shown are only those candidates that could be coimmunoprecipitated with SLy2. Abbreviations are as follows: C_bl-b_, Casitas B-lineage lymphoma; RN-tre, Related to the N terminus of tre; SLP-65, SH2 domain-containing leukocyte protein of 65 kDa; SLP-76, SH2 domain-containing leukocyte protein of 76 kDa; Gab-1, Grb2-associated binder-1; CD2-IC domain, intracellular domain of CD2; IP, immunoprecipitation; IB, immunoblot. C, SLy2 coimmunoprecipitates with endogenous cortactin from HeLa (left panel) and Jurkat (right panel) cells. HeLa or Jurkat cells expressing HA-tagged SLy2-WT, SLy2-ΔSH3, or a control construct were lysed. SLy2 was precipitated with α-HA antibodies, and the immunoprecipitates were analyzed by Western blotting with α-cortactin antibodies. D, SLy2 colocalizes with endogenous cortactin in SLy2-WT-induced membrane ruffles. HeLa cells stably expressing HA-tagged SLy2-WT or SLy2-ΔSH3 were grown on coverslips, fixed, and stained with HA- and cortactin-specific antibodies. The confocal micrographs (optical slice thickness, 1 μm) were subjected to a per pixel colocalization analysis using the ImageJ colocalization finder plug-in. The lower panels represent enlargements of the boxed areas. The merged images (yellow color indicates overlap of red and green channels) also display colocalized data points (Pearson's correlation coefficient >90%) in white. Colocalized data points are also shown separately on the bottom right panels. The induction of membrane ruffles is markedly reduced upon expression of SLy2-ΔSH3, resulting in a more diffuse distribution of SLy2-ΔSH3 and cortactin (scale bar, 10 μm).
To analyze the interaction of SLy2 and cortactin on a cellular level, we investigated the subcellular distribution of endogenous cortactin and SLy2-WT in HeLa cells (Fig. 5D). The quantification of colocalization between cortactin and SLy2-WT in regions of interest covering membrane ruffles yielded an average Pearson's correlation coefficient of 0.31 ± 0.13 (n = 3, 20 cells). Interestingly, SLy2 and cortactin showed extensive codistribution in the membrane areas of distal ruffles induced by overexpression of SLy2-WT, as indicated by a per pixel colocalization analysis, where colocalized data points with a Pearson's correlation coefficient of >90% are shown as white overlays (Fig. 5D, upper panels).
In contrast to SLy2-WT-expressing cells, a per pixel visual colocalization analysis of regions of interest encompassing the plasma membrane areas of SLy2-ΔSH3-expressing cells revealed a marked reduction of codistributed SLy2-ΔSH3 and cortactin data points (Fig. 5D, lower panels). However, compared with SLy2-WT-expressing cells, we did not detect a quantitative difference in the colocalization of the SLy2-ΔSH3 mutant with endogenous cortactin in the analyzed regions of interest (average Pearson's correlation coefficient, 0.33 ± 0.16; n = 3, 23 cells). Whereas this result may also reflect a limitation in imaging resolution, it is consistent with the SH3 domain-dependent effect of SLy2 on cell morphology as shown in Fig. 4. Thus, SLy2-WT induces membrane ruffle formation and triggers a codistribution of cortactin with SLy2 to these structures, whereas SLy2-ΔSH3 expression leads to a disruption of membrane ruffles, resulting in a diffuse SLy2-ΔSH3 and cortactin distribution. Taken together, these data suggest that the SLy2/cortactin interaction is involved in Rac1-dependent actin remodeling leading to membrane ruffle formation.
SLy2 Regulates Cell Spreading
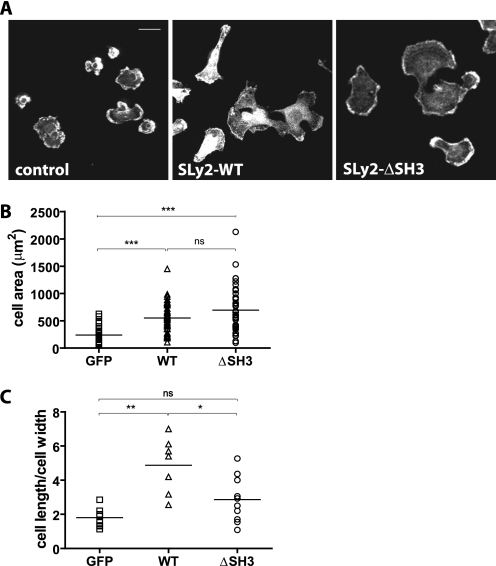
Rac1 activation is important for actin cytoskeletal rearrangements during cell adhesion and spreading. To test the potential involvement of SLy2 and the functional relevance of the SLy2-SH3 domain in cell spreading responses, we resuspended control, SLy2-WT-, and SLy2-ΔSH3-expressing HeLa cells and analyzed their subsequent spreading behavior on gelatin-coated surfaces. Consistent with the pronounced stimulation of actin dynamics by SLy2 overexpression, SLy2-WT-expressing cells spread to a significantly greater extent than control cells after 45 min but were highly polarized (Fig. 6, A and B). Interestingly, although the spreading area of SLy2-ΔSH3-expressing cells was also significantly elevated compared with control cells, SLy2-ΔSH3-expressing cells were isometrically spread after 45 min and thus resembled control cells (Fig. 6, A and B). The isometric spreading response of SLy2-ΔSH3-expressing cells is reflected in the low cell length to cell width ratio, which is similar to control cells, whereas the highly polarized SLy2-WT expressors were characterized by a markedly increased cell length to cell width ratio (Fig. 6C). These results clearly show that SLy2 plays an important role for the regulation of HeLa cell spreading and morphology on extracellular matrix molecules. Consistent with our previous findings, these data also suggest that the presence of the SLy2 SH3 domain is involved in the regulation of cell polarization (compare with Figs. 2 and 3).
FIGURE 6.
SLy2 regulates cell spreading. A, HeLa cells transduced with the indicated constructs were resuspended and subsequently seeded onto gelatin-coated coverslips. The cells were allowed to adhere for 45 min before being fixed and stained for F-actin (scale bar, 20 μm). Compared with control cells, SLy2-WT expressors show a polarized morphology, whereas the morphology of SLy2-ΔSH3 expressing cells is isometric and resembles control cells. B, overexpression of SLy2-WT and SLy2-ΔSH3 increases the spread cell area. The cell area was determined using the ImageJ freehand circumference measurement and automated area analysis tool (two-way repeated measures ANOVA with Bonferroni's multiple comparison test, ***, p < 0.0001). ns, not significant. C, ratio of cell length to cell width was determined for at least 10 cells in each of three independent experiments (two-way repeated measures ANOVA with Bonferroni's multiple comparison test: **, p < 0.001; *, p < 0.01).
Generation and Characterization of SLy2-transgenic Mice
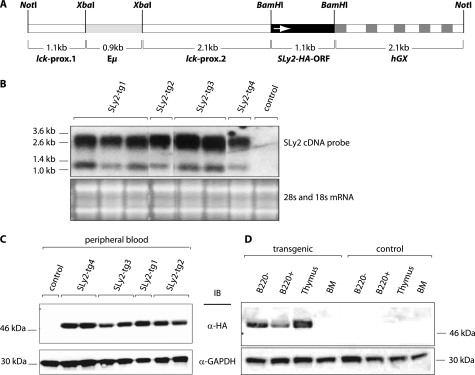
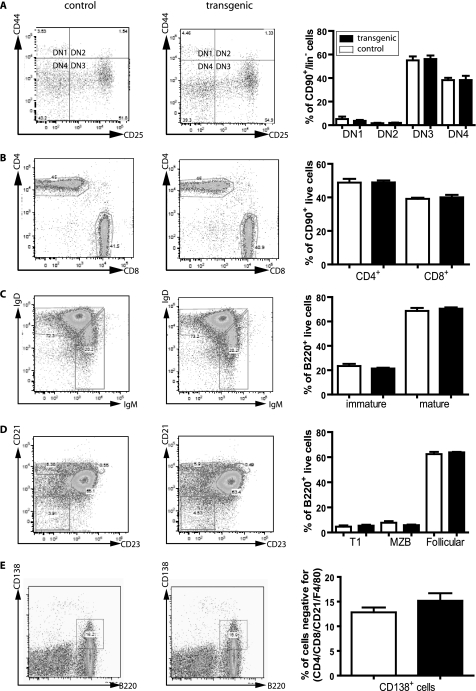
Because SLy2 is physiologically up-regulated during B cell activation, we generated a SLy2-transgenic mouse strain to study the role of SLy2 for B cell functions. These mice overexpress HA-tagged SLy2-WT under the control of the lck proximal promoter and the IgH enhancer (17), resulting in robust SLy2 expression in T and B cells, respectively (Fig. 7B). To test the effect of SLy2 overexpression on lymphoid populations, we isolated thymocytes, splenocytes, and bone marrow cells, stained the cells with fluorescently labeled antibodies specific for each cell type, and subjected the cells to flow cytometric analysis (Fig. 8, A–E). Consistent with the phenotype of _SLy2_−/− mice (16), SLy2-transgenic mice were viable and fertile under basal conditions and did not exhibit obvious defects in B or T cell development. We did not observe any sex-dependent differences on the tested parameters in five male and five female SLy2-transgenic or WT mice in three independent experiments.
FIGURE 7.
Generation of transgenic mice with a T and B cell-specific expression of SLy2. A, complete open reading frame of SLy2 was cloned together with an HA tag into the BamHI site of p1026x, downstream of the chimeric promoter _lck-E_μ. This hybrid promoter assembled from the lck and the IgH genes directs transgene expression exclusively to T and B cells (17). The promoter is assembled from the lck proximal promoter (lck-prox) and the IgH enhancer (_E_μ). The arrow in the SLy2 ORF indicates the reading direction of the frame. Optimal expression of the SLy2 cDNA was ensured by a spliceable but nontranslatable expression cassette of the human growth hormone (hGX), located 3′ of the SLy2 cDNA. B, Northern blot analysis of total RNA from peripheral blood of four SLy2-transgenic mouse strains. The SLy2 cDNA was used as a probe. The different sizes likely originate from different splice variants with respect to the human growth hormone minigene in the 3′ end of the construct. The 18 S and 28 S rRNAs are shown as a loading control. C, expression of the HA-tagged SLy2 transgene in peripheral blood of four different mouse lines. Nucleated blood cells were depleted from erythrocytes with lympholyte M, lysed, and probed by Western blotting. D, expression of the SLy2 transgene in splenic B and T cells, in thymocytes and bone marrow cells (BM). Spleen cells from WT and transgenic animals were separated into B220− and B220+ fractions, lysed, and analyzed by Western blotting. Blots were probed for GAPDH as a loading control. IB, immunoblot.
FIGURE 8.
Flow cytometric analysis of lymphoid populations of SLy2-transgenic mice. Thymocytes, splenocytes, and bone marrow cells were isolated as detailed under “Experimental Procedures.” The analysis included the following: A, double-negative (DN) thymocytes; B, peripheral T cells; C, immature and mature peripheral B cells; D, transitional 1, marginal zone (MZB), and follicular B cells; and E, plasma cells. The cells were stained with the indicated fluorescently labeled antibodies and were analyzed on a FACS Canto II. The quantifications in the corresponding right panels combine the data of three independent experiments, each including five male and five female SLy2-transgenic or WT mice. No sex-dependent differences were observed for any of the tested parameters. The FACS data were evaluated with FlowJo software. SLy2-transgenic mice do not exhibit obvious defects in B or T cell development.
Transgenic Overexpression of SLy2 Impairs B Cell Spreading
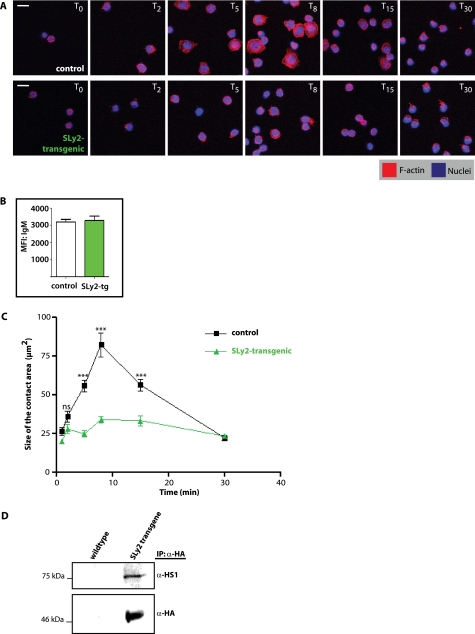
Reorganization of the actin cytoskeleton promotes B cell adhesion and spreading on immobilized antigens and is therefore crucial for B cell activation and IS formation (29). To analyze the role of SLy2 in the kinetics of B cell spreading on antigen-coated surfaces, splenic B cells were purified by positive selection using α-B220 antibodies conjugated to magnetic beads. Wild-type and SLy2-transgenic B220+ splenocytes were seeded onto α-IgM-coated coverslips and were allowed to adhere and spread for predetermined time points. Fig. 9, A and C, shows that control B cells began spreading immediately after making contact with the surface, reaching a maximal surface area approximately 8 min after seeding. Afterward, cells started to contract again, regaining their initial size between 15 and 30 min after seeding. This behavior likely reflects the two-phase cellular response preceding IS formation, which involves spreading and subsequent contraction to facilitate antigen gathering by B cells (2). In contrast, SLy2-overexpressing cells only spread to a minor extent over the entire time course. We did not detect any sex-dependent differences on cell spreading employing splenocytes from one male SLy2-transgenic or WT mouse and two female SLy2-transgenic or WT mice. The diminished spreading capacity of the SLy2-transgenic B cells was not due to altered IgM surface levels as determined by FACS analysis (Fig. 9B). In addition, we did not observe a difference in the rate or extent of initial adhesion on α-IgM-coated surfaces between control and SLy2-transgenic B cells (data not shown), indicating that the effect of SLy2 overexpression is specific for B cell spreading.
FIGURE 9.
SLy2-transgenic splenocytes show impaired spreading to α-IgM-coated surfaces. A, control and SLy2-transgenic splenocytes were purified and MACS-sorted for B220 surface expression. Isolated splenic B cells were prestimulated for 1 h with α-CD40 and IL-4 and were allowed to settle to α-IgM-coated coverslips for 30 min on ice before being incubated at 37 °C for 30 min to induce spreading and contraction. Cells were then fixed at the indicated time points (_T_0–_T_30) and stained for F-actin. Shown are confocal micrographs; scale bar, 10 μm. B, FACS analysis demonstrates that IgM expression levels of control (white bar) and SLy2-transgenic (green bar) splenocytes are indistinguishable. MFI, mean fluorescence intensity. C, quantitative analysis of results shown in A. The spread cell area was determined for 30–50 cells at each time point. All data are representative of three independent experiments employing splenocytes from one male SLy2-transgenic or WT mouse and two female SLy2-transgenic or WT mice (Mann-Whitney rank sum test: ***, p < 0.001). D, SLy2 interacts with the lymphocytic cortactin homolog HS1. Murine splenocytes were isolated from control or SLy2-transgenic spleens as described. SLy2 was precipitated from lysates with α-HA and immunoprecipitates (IP) were analyzed with α-HS1 antibody.
Our cellular and biochemical studies have shown that SLy2 mediates actin cytoskeletal reorganization and that cortactin is a SLy2-SH3 domain-interacting protein that may be involved in SLy2-induced actin remodeling (Fig. 5). Whereas cortactin is broadly distributed, lymphocytes exclusively express the hematopoietic cell specific homolog of cortactin, HS1. Therefore, to analyze a potential interaction between SLy2 and the lymphocyte cortactin homolog HS1, SLy2 was immunoprecipitated from SLy2-transgenic primary B cells, and the samples were probed for endogenous HS1. Fig. 9D shows that endogenous HS1 indeed coimmunoprecipitated with SLy2.
Taken together, our work demonstrates that SLy2 regulates actin cytoskeletal dynamics involved in cell spreading and contraction, and it suggests an important role of the SLy2-SH3 domain for these responses.
DISCUSSION
Appropriate B cell activation, proliferation, and differentiation are essential for adaptive immunity. The recognition of membrane-bound antigen by B cells leads to the formation of an IS (29), which is preceded by extensive cytoskeletal rearrangements that mediate cell spreading and subsequent contraction, thus facilitating antigen gathering by B cells (2). Despite the importance of these processes, the proteins and signaling pathways regulating these cytomechanical events remain incompletely understood.
Here, we have employed a combination of genetic, cell biological, and biochemical approaches to outline a function of the poorly characterized adapter protein SLy2 in the actin cytoskeletal remodeling required for B cell spreading and contraction. The recent description of SLy2-deficient mice confirmed a function of SLy2 as an antiproliferative adapter protein in vivo (16). The results of Wen and co-workers (16) clearly show that SLy2 is required for the suppression of adaptive immunity and suggest that the SLy2 up-regulation observed upon activation- and differentiation-inducing stimuli may indeed serve negative regulatory functions.
Very little is currently known about the physiological interaction partners and the cell biological functions of SLy2. Based on in vitro binding data and on the fact that deletion of the SLy2 and PIR-B genes in mice shows similar phenotypes, Wen and co-workers (16) have proposed a role of SLy2 in the PIR-B inhibitory signaling pathway. Because SLy2 is also expressed in T lymphocytes and nonimmune cells (11), we have generated and characterized SLy2-transgenic Jurkat and HeLa model cell lines to investigate cellular SLy2 functions and to study its interaction partners. Consistent with the effects of SLy2 overexpression or depletion on B cell proliferation (15, 16), SLy2 overexpression inhibits cell proliferation in Jurkat and HeLa cells, pointing to common functions of SLy2 in primary B cells, in an immortalized T lymphocyte cell line, and in nonimmune cells. In addition to the regulation of SLy2-dependent cell proliferation, our experiments also reveal a key role of the SLy2-SH3 domain for cellular morphology, membrane ruffle formation, and cell spreading. An in silico search for potential SLy2-SH3 domain interactors together with immunoprecipitation and subcellular localization analyses led to the identification of the ubiquitously expressed actin nucleation-promoting factor cortactin as a SLy2-SH3 domain-associated protein.
Cortactin is known to be required for platelet-derived growth factor-induced ruffle formation, which can partially be attributed to reduced Rac1 activation in _cortactin_−/− fibroblasts (28). These results suggest that Rac1 can be regulated downstream of cortactin. We observed extensive membrane ruffle formation upon SLy2 overexpression that coincided with SLy2 redistribution to these subcellular areas. Interestingly, SLy2-dependent ruffle formation was abolished upon coexpression of dominant-negative Rac1 and markedly enhanced upon coexpression of SLy2 with GTPase-deficient and thus constitutively active Rac1. Together, these data indicate that, similar to cortactin, SLy2 may function as an upstream regulator of Rac1 in the cytoskeletal remodeling events required for membrane ruffle formation.
As SLy2 is associated with cortactin, we additionally analyzed a potential interaction between SLy2 and its lymphocyte-specific homolog HS1 in SLy2-transgenic primary B cells. In coimmunoprecipitation experiments, we were able to show an interaction of SLy2 with HS1. HS1 is known to play an essential role for antigen-mediated cell spreading and in the formation of the T cell IS (30). Furthermore, the elaboration of the IS in T cells is critically dependent on rapid, Rac1-mediated actin remodeling (31), and Rac2, the hematopoietic isoform of Rac1, has been shown to be critical for IS formation in B cells.
Extensive reorganization of the actin cytoskeleton is necessary for cell spreading. The investigation of SLy2 effects on HeLa cell spreading on extracellular matrix molecules showed that the overexpression of SLy2-WT induced a highly polarized cellular morphology, whereas SLy2-ΔSH3 cells showed accelerated isometric spreading compared with control cells. Importantly, our analysis also demonstrated that SLy2-transgenic B cells were severely defective in spreading on immobilized anti-IgM antibodies. The impaired antigen-induced spreading of the SLy2-transgenic B cells contrasts with the elevated spreading capacities observed in HeLa cells overexpressing SLy2. There are several possible explanations for these opposing phenotypes. First, SLy2 may fulfill different cell type-specific roles in motile lymphocytes as opposed to cells of epithelial origin, which are generally nonmotile and anchored in their respective tissue environments. Second, overexpression of SLy2 in HeLa cells might lead to the induction of F-actin-rich membrane ruffles without a defined spatio-temporal regulation, as evidenced by the synchronous formation of several lamellipodia within one single cell, leading to multipolarity. This activity of SLy2 possibly overrides the highly organized and locally restricted regulation of the F-actin network, which is mandatory for the antigen-induced spreading preceding the establishment of a mature IS at the contact plane between the lymphocyte and the surface (4, 5, 32, 33). In addition, as mentioned above, the effects of SLy2 on the initial spreading of HeLa cells appear to be independent of its binding to cortactin, whereas the spreading and contraction in lymphocytes is clearly dependent on HS1, whose importancy in antigen-mediated cell spreading is firmly established (30, 31).
Together, these findings suggest that the constitutive expression of exogenous SLy2 in B cells above those levels that are observed during physiological B cell stimulation may interfere with the finely tuned actin dynamics necessary for proper B cell spreading on α-IgM-coated surfaces. Given the fact that the SLy2 interactor HS1 is important for the establishment of immunological synapses in T and NK cells (30, 34), our study hints at a similar role for HS1 in B cells.
At present, we cannot formally exclude the possibility that the defective spreading response of SLy2-transgenic B cells is primarily due to defective B cell activation. This would imply that the altered cytoskeletal reorganization of SLy2-transgenic B cells may also be a consequence of altered B cell activation. Nevertheless, actin dynamics and B cell activation are intricately connected and interdependent processes, as actin cytoskeletal dynamics are known to coordinate early events in B cell activation (33).
Taken together, our results extend our mechanistic understanding of the immunoinhibitory roles of SLy2 and suggest that the physiological up-regulation of SLy2 observed upon B cell activation not only functions to dampen B cell proliferation and humoral responses but also to counteract excessive B cell spreading, contraction, and thus antigen gathering.
Acknowledgments
We thank Claudia Müller, Nicole Krafzik, and Karin Buchholz for technical assistance. Plasmids encoding Rac1-N17 and Rac1-V12 were constructed by Dr. Philippe Fort (CNRS, Montpellier, France) and were kindly provided by Dr. Monique Arpin (Institut Curie, Paris, France). The pWPI, psPAX2, and pVSVG plasmids employed for lentivirus production were generously provided by Dr. Didier Trono (University of Lausanne, Switzerland).
*
This work was supported by Grants BE 2813/1-1 and 2813/1-2 (to S. B.), SFB 728, FOR729, and SFB 688 (to A. G.), and SFB 456 (to K.-P. J.) from Deutsche Forschungsgemeinschaft and Forschungskommission of the Heinrich Heine University Duesseldorf and Karls-Eberhard-University Tübingen (to S. B.-H.).
3
The abbreviations used are:
IS
immunological synapse
SH3
Src homology domain 3
ANOVA
analysis of variance
TRITC
tetramethylrhodamine isothiocyanate
SAM
sterile α-motif
IRES
internal ribosome entry site.
REFERENCES
- 1.Pollard T. D., Borisy G. G. (2003) Cell 112, 453–465 [DOI] [PubMed] [Google Scholar]
- 2.Fleire S. J., Goldman J. P., Carrasco Y. R., Weber M., Bray D., Batista F. D. (2006) Science 312, 738–741 [DOI] [PubMed] [Google Scholar]
- 3.Billadeau D. D., Burkhardt J. K. (2006) Traffic 7, 1451–1460 [DOI] [PMC free article] [PubMed] [Google Scholar]
- 4.Harwood N. E., Batista F. D. (2008) Immunity 28, 609–619 [DOI] [PubMed] [Google Scholar]
- 5.Vicente-Manzanares M., Sánchez-Madrid F. (2004) Nat. Rev. Immunol. 4, 110–122 [DOI] [PubMed] [Google Scholar]
- 6.Shaw A. S., Filbert E. L. (2009) Nat. Rev. Immunol. 9, 47–56 [DOI] [PubMed] [Google Scholar]
- 7.Hidaka M., Homma Y., Takenawa T. (1991) Biochem. Biophys. Res. Commun. 180, 1490–1497 [DOI] [PubMed] [Google Scholar]
- 8.Koch C. A., Anderson D., Moran M. F., Ellis C., Pawson T. (1991) Science 252, 668–674 [DOI] [PubMed] [Google Scholar]
- 9.Feng S., Chen J. K., Yu H., Simon J. A., Schreiber S. L. (1994) Science 266, 1241–1247 [DOI] [PubMed] [Google Scholar]
- 10.Beer S., Simins A. B., Schuster A., Holzmann B. (2001) Biochim. Biophys. Acta 1520, 89–93 [DOI] [PubMed] [Google Scholar]
- 11.Claudio J. O., Zhu Y. X., Benn S. J., Shukla A. H., McGlade C. J., Falcioni N., Stewart A. K. (2001) Oncogene 20, 5373–5377 [DOI] [PubMed] [Google Scholar]
- 12.Mitelman F., Mertens F., Johansson B. (1997) Nat. Genet. 15, 417–474 [DOI] [PubMed] [Google Scholar]
- 13.Zeller C., Hinzmann B., Seitz S., Prokoph H., Burkhard-Goettges E., Fischer J., Jandrig B., Schwarz L. E., Rosenthal A., Scherneck S. (2003) Oncogene 22, 2972–2983 [DOI] [PubMed] [Google Scholar]
- 14.Rimkus C., Martini M., Friederichs J., Rosenberg R., Doll D., Siewert J. R., Holzmann B., Janssen K. P. (2006) Br. J. Cancer 95, 1419–1423 [DOI] [PMC free article] [PubMed] [Google Scholar]
- 15.Zhu Y. X., Benn S., Li Z. H., Wei E., Masih-Khan E., Trieu Y., Bali M., McGlade C. J., Claudio J. O., Stewart A. K. (2004) J. Exp. Med. 200, 737–747 [DOI] [PMC free article] [PubMed] [Google Scholar]
- 16.Wang D., Stewart A. K., Zhuang L., Zhu Y., Wang Y., Shi C., Keating A., Slutsky A., Zhang H., Wen X. Y. (2010) FASEB J. 24, 947–956 [DOI] [PubMed] [Google Scholar]
- 17.Iritani B. M., Forbush K. A., Farrar M. A., Perlmutter R. M. (1997) EMBO J. 16, 7019–7031 [DOI] [PMC free article] [PubMed] [Google Scholar]
- 18.Brandt S., Ellwanger K., Beuter-Gunia C., Schuster M., Hausser A., Schmitz I., Beer-Hammer S. (2010) Int. J. Biochem. Cell Biol. 42, 1472–1481 [DOI] [PubMed] [Google Scholar]
- 19.Pollard T. D., Cooper J. A. (2009) Science 326, 1208–1212 [DOI] [PMC free article] [PubMed] [Google Scholar]
- 20.Hall A. (1998) Science 279, 509–514 [DOI] [PubMed] [Google Scholar]
- 21.Ridley A. J., Paterson H. F., Johnston C. L., Diekmann D., Hall A. (1992) Cell 70, 401–410 [DOI] [PubMed] [Google Scholar]
- 22.Li S. S. (2005) Biochem. J. 390, 641–653 [DOI] [PMC free article] [PubMed] [Google Scholar]
- 23.Higgs H. N., Pollard T. D. (2001) Annu. Rev. Biochem. 70, 649–676 [DOI] [PubMed] [Google Scholar]
- 24.Haas A. K., Yoshimura S., Stephens D. J., Preisinger C., Fuchs E., Barr F. A. (2007) J. Cell Sci. 120, 2997–3010 [DOI] [PubMed] [Google Scholar]
- 25.Lanzetti L., Palamidessi A., Areces L., Scita G., Di Fiore P. P. (2004) Nature 429, 309–314 [DOI] [PubMed] [Google Scholar]
- 26.Cosen-Binker L. I., Kapus A. (2006) Physiology 21, 352–361 [DOI] [PubMed] [Google Scholar]
- 27.Weed S. A., Parsons J. T. (2001) Oncogene 20, 6418–6434 [DOI] [PubMed] [Google Scholar]
- 28.Lai F. P., Szczodrak M., Oelkers J. M., Ladwein M., Acconcia F., Benesch S., Auinger S., Faix J., Small J. V., Polo S., Stradal T. E., Rottner K. (2009) Mol. Biol. Cell 20, 3209–3223 [DOI] [PMC free article] [PubMed] [Google Scholar]
- 29.Arana E., Vehlow A., Harwood N. E., Vigorito E., Henderson R., Turner M., Tybulewicz V. L., Batista F. D. (2008) Immunity 28, 88–99 [DOI] [PubMed] [Google Scholar]
- 30.Gomez T. S., McCarney S. D., Carrizosa E., Labno C. M., Comiskey E. O., Nolz J. C., Zhu P., Freedman B. D., Clark M. R., Rawlings D. J., Billadeau D. D., Burkhardt J. K. (2006) Immunity 24, 741–752 [DOI] [PMC free article] [PubMed] [Google Scholar]
- 31.Nolz J. C., Gomez T. S., Zhu P., Li S., Medeiros R. B., Shimizu Y., Burkhardt J. K., Freedman B. D., Billadeau D. D. (2006) Curr. Biol. 16, 24–34 [DOI] [PMC free article] [PubMed] [Google Scholar]
- 32.Bunnell S. C., Kapoor V., Trible R. P., Zhang W., Samelson L. E. (2001) Immunity 14, 315–329 [DOI] [PubMed] [Google Scholar]
- 33.Batista F. D., Treanor B., Harwood N. E. (2010) Immunol. Rev. 237, 191–204 [DOI] [PubMed] [Google Scholar]
- 34.Butler B., Kastendieck D. H., Cooper J. A. (2008) Nat. Immunol. 9, 887–897 [DOI] [PMC free article] [PubMed] [Google Scholar]
