Human and Mouse α-Synuclein Genes: Comparative Genomic Sequence Analysis and Identification of a Novel Gene Regulatory Element (original) (raw)
Abstract
The human α-synuclein gene (SNCA) encodes a presynaptic nerve terminal protein that was originally identified as a precursor of the non-β-amyloid component of Alzheimer's disease plaques. More recently, mutations in SNCA have been identified in some cases of familial Parkinson's disease, presenting numerous new areas of investigation for this important disease. Molecular studies would benefit from detailed information about the long-range sequence context of SNCA. To that end, we have established the complete genomic sequence of the chromosomal regions containing the human and mouse α-synuclein genes, with the objective of using the resulting sequence information to identify conserved regions of biological importance through comparative sequence analysis. These efforts have yielded ∼146 and ∼119 kb of high-accuracy human and mouse genomic sequence, respectively, revealing the precise genetic architecture of the α-synuclein gene in both species. A simple repeat element upstream of SNCA/Snca has been identified and shown to be necessary for normal expression in transient transfection assays using a luciferase reporter construct. Together, these studies provide valuable data that should facilitate more detailed analysis of this medically important gene.
[The genomic DNA sequence data described in this paper have been submitted to GenBank under accession nos. AF163864 (human) and AF163865 (mouse).]
The α-synuclein gene (SNCA) was first identified as the gene encoding a protein of which a subfragment, termed the non-β-amyloid component, was found to be a minor component of Alzheimer's disease plaques (Ueda et al. 1993). Parkinson's disease (PD), the second most common neurodegenerative disease in humans, is a disorder of unknown etiology that causes a progressive and debilitating movement disorder. Interest in SNCA increased substantially when a locus for early onset PD, which can occur as an autosomal dominant trait in a few rare families, was mapped to the same region of chromosome 4 as SNCA (Polymeropoulos et al. 1996) and shown to result from two different missense mutations in the SNCA gene (Polymeropoulos et al. 1997; Kruger et al. 1998). The importance of SNCA in PD was further underscored by the demonstration of α-synuclein in the characteristic protein aggregates, termed Lewy bodies, found in the affected portions of PD patient brains (Spillantini et al. 1997). The mechanisms by which mutated α-synuclein causes PD and why wild-type α-synuclein is deposited in pathological aggregates (Lewy bodies) are unknown.
SNCA belongs to a family of at least three paralogous genes in humans, termed α, β, and γ synucleins. Orthologs of all three paralogs are known to exist in rodent as well as other species (summarized in Lavedan 1998), but little is known about the long-range structure of these genes or how their expression is controlled. It is now firmly established that comparative analysis of human and mouse genomic sequence is an effective approach for identifying biologically important sequences (for review, see Hardison et al. 1997; Miller 2000). Such a strategy rests on the observation that protein-coding regions exhibit significant conservation at the nucleotide level between the two species (Makalowski et al. 1996). Regulatory elements are predicted to be conserved as well, to the extent that a given gene is expressed in a similar fashion in both species. We sought to use genomic sequencing to fully characterize the genomic structure of the α-synuclein gene in mouse and man and to perform a cross-species sequence comparison of genomic sequence as an analytical tool to begin to identify conserved noncoding regions of biological significance.
RESULTS
Genetic Mapping
Human α-synuclein has been mapped to human chromosome 4q21-q23 (Campion et al. 1995; Chen et al. 1995). We have mapped mouse α-synuclein using a polymorphic (CA)n repeat in intron four on the Jackson Laboratory Backcross DNA Panel Mapping Resource ([C57BL/6JEi × SPRET/Ei]F1 × SPRET/Ei; Jackson BSS; Rowe et al. 1994a) and determined its location on mouse chromosome 6 (Fig. 1). The mouse gene is located between Atoh2 and Atoh1 as follows: cen–Atoh2_–(1.1 ± 1.1 cM)–_Snca_–(1.1 ± 1.1 cM)–_Atoh1. Human ATOH1, like SCNA, is found on human chromosome 4q, whereas human ATOH2 maps to human 7p14 and is not part of the conserved syntenic segment between mouse 6 and human 4. All genotyping information is available at http://www.informatics.jax.org/searches/crossdata.cgi.
Figure 1.
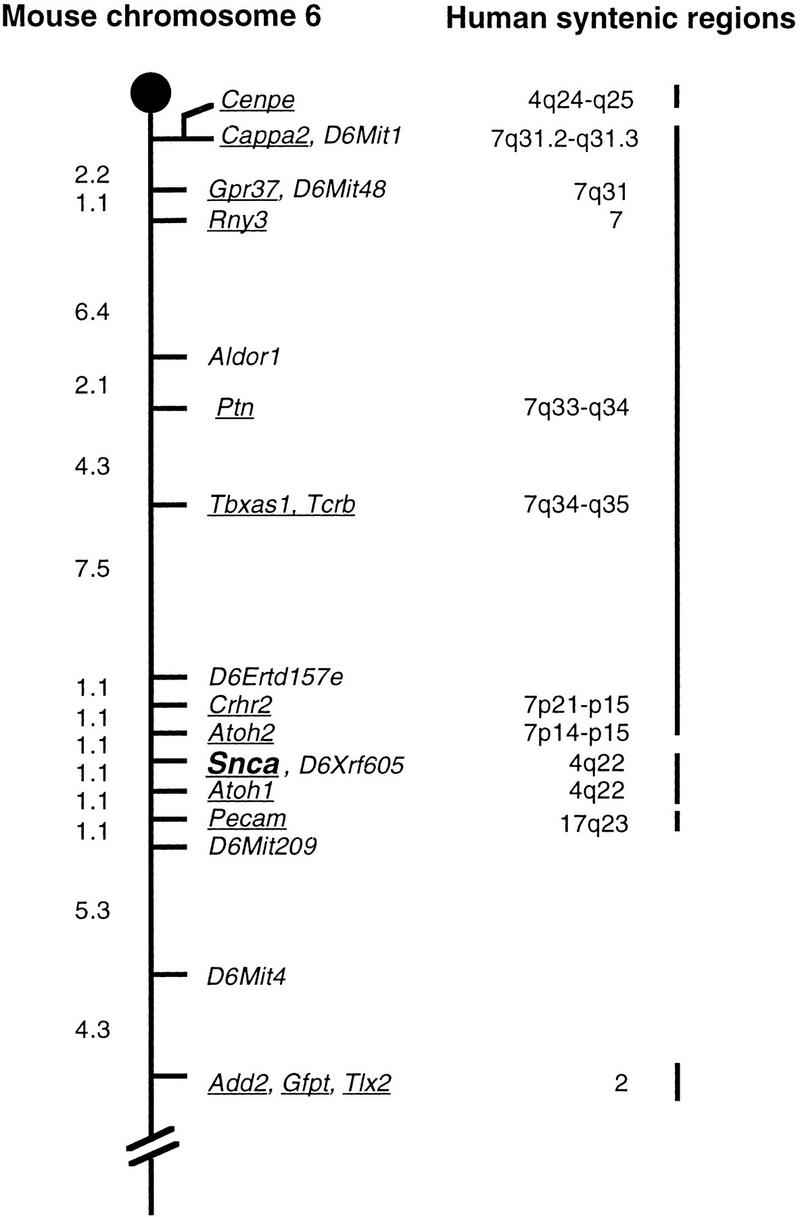
Genetic map showing the position of Snca on mouse chromosome 6. Genetic distances as determined on the Jackson Laboratory Backcross DNA Mapping Panel are shown on the left in centiMorgans (cM). For clarity, not all markers mapped on the BSS backcross are shown for all of the loci. Underlined genes have mapped human homologs; the human map locations are shown on the right. Some of the human homologies were obtained from the Mouse Genome Database (http://www.informatics.jax.org/, July 1999). The extensive region of homology between MMU6 and HSA7 interrupts the region of shared synteny between MMU6 and HSA4q22.
Genomic Sequencing and Database Comparisons
In an effort to study the conserved segments within and surrounding SNCA, we generated ∼146 and ∼119 kb of high-accuracy genomic DNA sequence from the human P1 artificial chromosome (PAC) clone 27M07 and the mouse bacterial artificial chromosome (BAC) clone 155I20, respectively, using a shotgun sequencing strategy. Human SNCA spans ∼112 kb, and comparison of the human PAC sequence with other available _SNCA_-containing genomic sequence (GenBank nos. U46896-U46901) and SNCA cDNA sequences (GenBank nos. NM_007308 and NM_000345) confirms the six exon organization of the gene (Table 1). The available cDNA sequence matches the genomic sequence exactly except for 6 bp at the 5′-most end of the cDNA sequences, which could not be aligned accurately. The alternative-splice form of human SNCA utilizing exon 1′ is reflected by GenBank record U46896. Each intron is flanked by the canonical GT-AG splice-site nucleotidesm and exon sizes are consistent with previous reports (Polymeropoulos et al. 1997). Intron sizes range from 1270 bp (intron 1) to 93,050 bp (intron 4). Mouse Snca spans ∼97 kb of genomic DNA, slightly smaller than its human counterpart. Comparison of the genomic and cDNA (GenBank no. NM_009221) sequence reveals that the intron/exon structures of the mouse and human genes are highly conserved (Table 1), which was expected as the human and rodent protein sequences are 95.3% identical (Lavedan 1998). As with SNCA, each Snca intron is flanked by GT-AG splice-site sequences.
Table 1.
Exon/Intron Organization of Human SNCA and Mouse SNCA
| Human SNCA | |||
|---|---|---|---|
| Exon/intron no. | Exon position1 | Exon length (bp) | Intron length (bp) |
| 1 | 28334–28494 | 161 | 1270 |
| 1‘ | 28334–28713 | 380 | 1052 |
| 2 | 29764–29909 | 146 | 7372 |
| 3 | 37281–37322 | 42 | 5773 |
| 4 | 43095–43237 | 143 | 93050 |
| 5 | 136287–136370 | 84 | 2534 |
| 6 | 138904–140010 | 1107 | |
| Mouse SNCA | |||
| Exon/intron no. | Exon position2 | Exon length (bpP | Intron length (bp) |
| 1 | 19166–19264 | 99 | 1097 |
| 2 | 20361–20507 | 147 | 9125 |
| 3 | 29632–29673 | 42 | 2565 |
| 4 | 32238–32380 | 143 | 82415 |
| 5 | 114795–114878 | 84 | 943 |
| 6 | 115821–116410 | 590 |
Numerous expressed-sequence tags (ESTs) specific for SNCA/Snca were detected in the human and mouse genomic sequence by comparison to dbEST using PowerBLAST (Zhang and Madden 1997). In addition, 25 spurious ESTs from 16 cDNA clones were identified within the lengthy intron 4. Fourteen of these cDNAs appear to have been primed from Alu repeats; the two others were primed from unremarkable intronic sequence. GENSCAN (Burge and Karlin 1997) failed to predict any other credible exons in the human and mouse sequence. Of note, GENSCAN only identified exons 2 (partially), 3, and 4 of SNCA.
Analysis of the 118-kb mouse sequence revealed a G+C content of 37.9%. This level is significantly lower than a current reported average content for mouse of 45.6% (Mallon et al. 2000). Similarly, the 124-kb portion of the human sequence orthologous to the mouse sequence has a G+C content of 36.0%, with an overall content of 36.3% across the entire 146-kb human PAC sequence. As summarized in Table 2, the frequency of SINE repeats is 3.2% and 9.9% in the mouse and human sequence, respectively. Together, these observations agree with other observations that have correlated low SINE and gene frequencies with low G+C content (Bernardi 1995). The frequency of LINE repeats is higher than the SINE frequency at 14.1% and 11.6% for mouse and human, respectively.
Table 2.
Distribution of Repetitive Elements
| Human | ||
|---|---|---|
| Repeat | Number of elements | Percentage of sequence |
| SINE | 55 | 9.89% |
| ALU | 32 | 7.25% |
| MIR | 23 | 2.65% |
| LINE | 37 | 11.59% |
| LINE1 | 20 | 8.85% |
| LINE2 | 17 | 2.74% |
| LTR elements | 14 | 3.67% |
| MaLR | 6 | 1.35% |
| ERVL | 3 | 1.14% |
| ERV-classI | 4 | 1.11% |
| ERV-classII | 0 | 0 |
| DNA elements | 16 | 3.21% |
| MER1 | 9 | 1.44% |
| MER2 | 5 | 1.62% |
| Total interspersed repeats | 28.37% | |
| Mouse | ||
| Repeat | Number of elements | Percentage of sequence |
| SINE | 27 | 3.18% |
| BI | 11 | 1.16% |
| B2–B4 | 14 | 1.93% |
| ID | 1 | 0.06% |
| MIR | 1 | 0.03% |
| LINE | 32 | 14.05% |
| LINE1 | 32 | 14.05% |
| LINE2 | 0 | 0 |
| LTR elements | 14 | 3.21% |
| MaLR | 10 | 2.30% |
| ERVL | 1 | 0.12% |
| ERV-classI | 0 | 0 |
| ERV-classII | 1 | 0.25% |
| DNA elements | 2 | 0.18% |
| MER1 | 1 | 0.12% |
| MER2 | 1 | 0.06% |
| Total interspersed repeats | 20.71% |
Human/Mouse Sequence Comparison
It was our particular interest to investigate whether comparative sequence analysis would identify conserved sequences that play a role in regulating SNCA/Snca expression. As an initial effort, a global alignment of the human and mouse genomic sequences was performed using the VISTA program (Batzoglou et al. 2000; Mayor et al. 2000; Dubchak et al. 2000). This program scans the genomic sequence for areas of high local similarity and uses those as anchor points for a global alignment. A plotting program then scans the alignment with a sliding window of 100 bp, determines the percentage identity within that window for one point of the plot, and moves along the sequence in 25-bp increments. A graphical display of the alignment is shown in Figure 2. Only segments with a similarity of >50% or more are plotted; thus regions that match poorly appear blank. The human PAC sequence was trimmed at the 5′ (18,000 bp) and 3′ (3606 bp) ends for this analysis to better represent the actual length of human sequence orthologous to the mouse BAC sequence.
Figure 2.
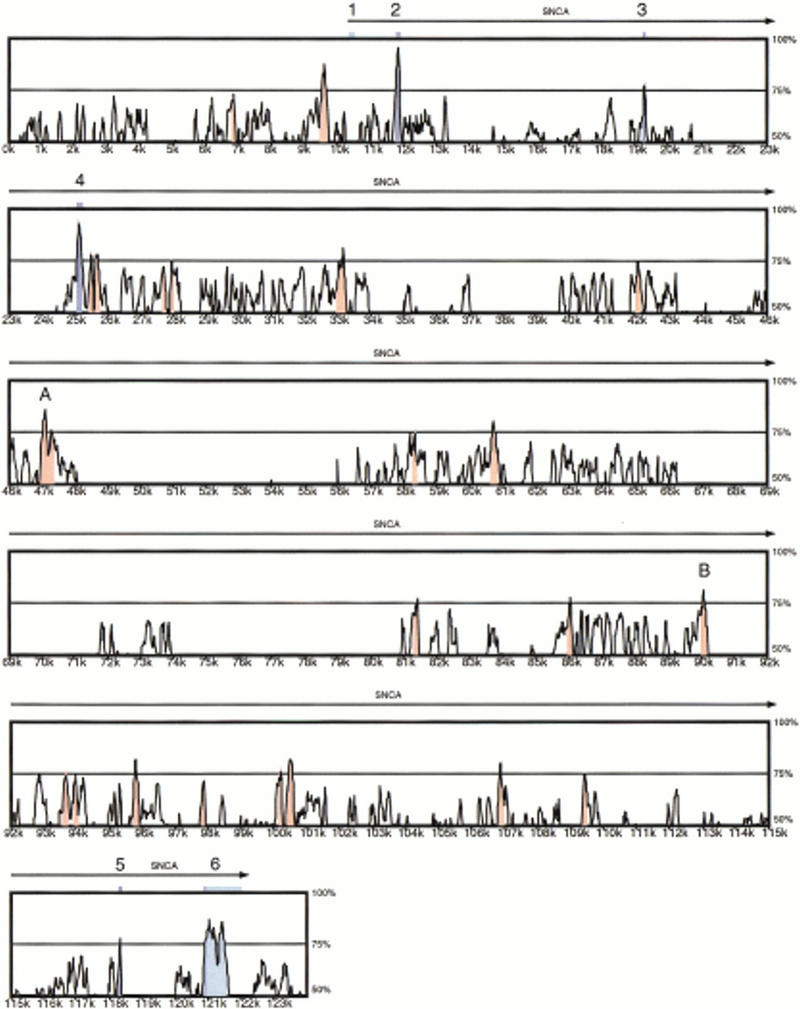
Global alignment of human SNCA and mouse Snca. Numbers on the vertical axis represent the proportion of identical nucleotides in a 100-bp window for a point on the plot. Numbers on the horizontal axis indicate the nucleotide position from the beginning of the human genomic sequence. Peaks shaded in blue correspond to the SNCA/Snca coding regions. Peaks shaded in light blue correspond to SNCA/Snca mRNA untranslated regions. Peaks shaded in red correspond to evolutionary-conserved regions (ECRs), defined as areas where the average identity is >75%.
As expected, the comparison highlights sequence conservation coinciding with the SNCA/Snca coding exons 2–5 and the 5′ coding portion of exon 6 (blue shading, Fig. 2). The 5′ untranslated region (UTR), which is contained almost entirely within the first exon, is not well conserved between human and mouse. In contrast, the 3′ UTR is 80.4% identical up to the first polyadenylation site shared by both species (light-blue shading, Fig. 2). The human transcript also uses an alternative downstream polyadenylation site (shown in Fig. 2) that is not used in mouse, and this human transcript-specific portion of the 3′ UTR is not conserved.
We detected 19 regions within intron 4 that achieve an average cross-species identity of at least 75% (red shading, Fig. 2). A closer examination of these evolutionary conserved regions (ECRs) reveals that most are composed of short ungapped alignments of <60 bp. However, two ungapped segments of 149 bp (83% identity) and 152 bp (77% identity) were discovered (regions A and B, Fig. 2). Examination of each segment reveals no open reading frame on either strand and no sequence database matches using BLASTN and BLASTX (Altschul et al. 1990), providing preliminary evidence that these ECRs do not represent exons. Whether they encode enhancers or other biologically important elements will require additional studies.
The segment extending ∼10 kb upstream of exon 1, the region likely to contain the minimal promotor as well as putative regulatory sequences, also shows high sequence similarity, most notably the region overlapping and immediately upstream of the CpG island harboring exon 1 of SNCA (Fig. 3A). Regions of high similarity in this location represent excellent targets for additional studies. We also confirmed the presence of a complex dinucleotide repeat in human (Xiao et al. 1993) and identified a similar repeat in mouse ∼6.1 kb upstream of the transcriptional start site of Snca. The repeat in mouse is almost certainly not a conserved version of the human repeat, however, as it is contained within an 8208-bp island of mouse sequence that is not orthologous with the human sequence in this region.
Figure 3.
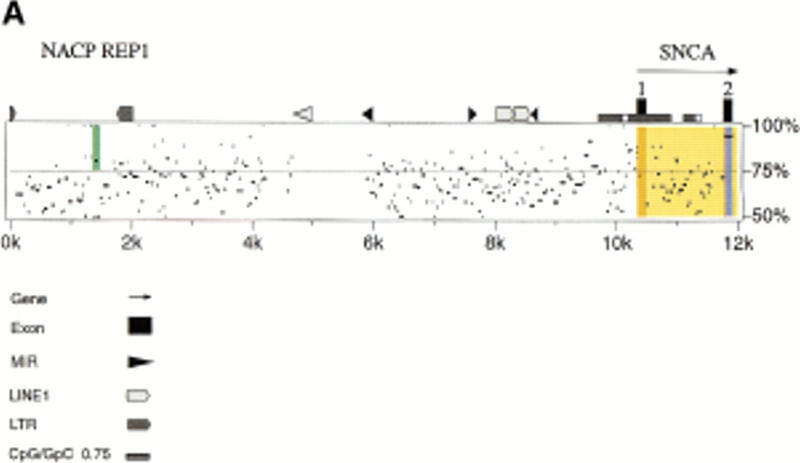

(A) Percentage identity plot (PIP) of human and mouse genomic sequence upstream of the first coding exon of SNCA and Snca. The location of SNCA noncoding and coding exons (orange and blue shading, respectively), introns (yellow shading), and the NACP-REP1 repeat (green shading; half bar) are indicated. A scale representing the degree of sequence identity, indicated as a percentage, is located at the right of each row. Human repetitive elements identified in the human sequence are indicated along the top of the homology window and are described in the key. (B) Alignment of the human NACP-REP1 (126 nt) and mouse (63 nt) repeat by pairwise comparison using the ALIGN program (http://dot.imgen.bcm.tmc.edu:9331/seq-search/alignment.html).
A Simple Repeat Affects Expression of SNCA
NACP-REP1, a complex dinucleotide repeat spanning nucleotide positions 1358–1483 of the trimmed human sequence, is located 8852 bp upstream of the SNCA transcriptional start site (Fig. 3A). Polymorphisms at this locus have been associated with both Alzheimer's and Parkinson's disease (Xia et al. 1996; Kruger et al. 1999), though the Alzheimer's association was not replicated by another group (Hellman et al. 1998). In human populations, the polymorphic alleles at this locus differ in size in increments of two to produce five alleles. The nucleotide basis of the human polymorphisms are not known, though the allele on the sequenced human PAC corresponds to the 259-bp allele 3 (Kruger et al. 1999).
Examination of the mouse sequence reveals a similar complex repeat located 6102 bp upstream of Snca exon 1. An alignment of the human and mouse repeats is depicted in Figure 3B. The human (126 nt) and mouse (63 nt) repeats are only 40% identical but contain similar dinucleotide elements. The human element contains a CA dinucleotide span not present in the mouse element. DNAs from 22 inbred mouse strains derived from Mus musculus musculus, two from M. musculus subspecies (CAST/Ei and MOLG/Dn), and one from the species Mus spretus (SPRET/Ei) were examined by PCR for polymorphisms at this complex dinucleotide repeat. The _M. musculus_-derived strains were not polymorphic; all produce the 225-bp product predicted from the 129Sv/J BAC sequence, which can be denoted as (CT)8N2(AT)9N5 (GT)4N8(GT)3. The CAST/Ei, MOLG/Dn, and SPRET/Ei PCR products differed in size and were sequenced to determine the basis of the polymorphisms. The CAST/Ei and MOLG/Dn sequences differ from this in the size of the AT repeat. The CAST/Ei product contains (AT)29 and is 265 bp in length, while that from MOLG/Dn has (AT)22, which along with two inserted bases and one deleted base in unique regions results in a product of 250 bp. SPRET/Ei shows a more complex polymorphism that can be denoted as (CT)13(AT)35N9(GT)5N8(GT)3, with a 291-bp product (data not shown).
Although the composition of the simple repeat region is not identical between human and mouse, the presence of a repeat in both species in the same general context suggests it might be functional. We studied the importance of the human NACP-REP1 repeat in the regulation of expression of the human α-synuclein gene. A 10.7-kb DNA fragment upstream of the α-synuclein translational start site was cloned into a reporter plasmid (pGL 3-ASP). This fragment harbors the NACP-REP1 repeat region at the 5′ end. We also constructed a second plasmid in which the NACP-REP1 repeat region was deleted (pGL 3-ASPdel). Each plasmid was cotransfected with pRL-TK into 293T cells, and the firefly and Renilla luciferases expression was measured. As a control for the luciferase basal expression, we cotransfected the promoter-less plasmid, pGL 3-Basic, with pRL-TK. For each cotransfection experiment, the relative activity of luciferase was calculated to eliminate the effect of transfection efficiency and cell number (see Methods). The pGL 3-ASP plasmid resulted in a 60-fold increase in luciferase expression relative to the basal level of pGL 3-Basic. Deletion of the repeat region led to a decrease in the expression level to 15-fold relative to the basal level of pGL 3-Basic (Fig. 4). Thus, the 849 bp region containing the repeat contributes a fourfold increase in the α-synuclein promoter activity in 293T cells.
Figure 4.

Fold expression of luciferase activity. 293 T cells were cotransfected with pGL 3-ASP, pGL 3-ASPdel, or pGL 3-Basic and pRL-TK. For each experiment, cells were plated into nine wells. Three wells at a time were independently transfected in parallel with three individually prepared aliquots of each of the three constructs in calcium phosphate. The relative activity with each pGL 3 plasmid was calculated by dividing the luminescence intensity of the firefly luciferase by that of the Renilla luciferase in each independent aliquot of cells and then averaging the three relative luciferase activities seen. The fold expression for pGL 3-ASP or pGL 3-ASPdel was then determined by dividing the average relative activity of each construct by that of the average obtained with pGL 3-Basic. Data shown here are the averages +1 SEM of three independent experiments performed on three separate days.
DISCUSSION
One of the most important outstanding questions for research into the molecular pathogenesis of PD is the role of SNCA and its gene product, α-synuclein, in sporadic PD. Two different missense mutations in SNCA can cause early onset, autosomal dominant PD with high penetrance. However, the vast majority of PD patients do not show Mendelian inheritance and have no missense mutations in SNCA, yet they have deposits of α-synuclein in pathognomonic aggregates, Lewy bodies, in the region of their substantia nigra. The involvement of wild-type α-synuclein in PD could be the result of posttranslational modification or damage to the protein, altered regulation of expression, abnormal degradation, or some combination of all three.
To begin our studies of the role of SNCA expression in PD, we chose to generate and analyze the complete sequence of the human and mouse genomic regions encompassing SNCA for two reasons. First, a number of studies have suggested that α-synuclein is up-regulated in the substantia nigra and striatum of rodents following injury leading to apoptotic neuronal cell death (Kholodilov et al. 1999; Vila et al. 2000). It is conceivable that differences in the regulation of SNCA can result in increased or decreased levels of expression following an initial insult, thereby exacerbating or ameliorating protein aggregation and disease progression. Because comparative sequencing of mouse and human DNA has been shown to reveal potential regulatory sequences (Koop and Hood 1994; Oeltjen et al. 1997; Ellsworth et al. 2000; Gottgens et al. 2000; Ishihara et al. 2000), we sought to identify possible SNCA regulatory elements by sequencing both genes and their surrounding DNA.
Second, a few association studies have suggested a correlation between certain alleles of the NACP-REP1 locus and the development of PD (Xia et al. 1996; Kruger et al. 1999). NACP-REP1 had previously been located ∼10 kb upstream of SNCA, but its relationship to the gene, particularly its role in gene regulation, is unknown. In particular, it is not clear if the association represents linkage disequilibrium or is of actual functional significance. By performing comparative sequence analysis between mouse and human, we determined that mouse also has a repeat sequence located at an analogous position near the Scna gene. This surprising finding led to the hypothesis that the NACP-REP1 sequence may be of functional significance, and we proceeded to test this hypothesis directly using transient transfection assays. Deletion of 849 bp, including the NACP-REP1 locus at the 5′ end of the promoter construct, resulted in a fourfold decrease in promoter activity in cultured 293T cells. Future studies will need to investigate the effect of different human NACP-REP1 alleles and different repeat sequences seen in various mouse species on gene expression. Analyzing differences in regulation of expression of α-synuclein in different mouse species could provide additional insight and tools for developing mouse models for PD in the future.
We have sequenced 146 kb of the human SNCA locus and 118 kb of the homologous region in mouse and mapped the precise location of the genes' exons. The six exons span large genomic distances of 116,675 and 97,245 bp in human and mouse, respectively, with no evidence of other genes located in the immediate surrounding sequence or within introns based on gene prediction and homology searches. We discovered a very low G+C and SINE content in the region, suggesting that the SNCA/Snca loci are contained within gene-poor isochores of human chromosome 4 and mouse chromosome 6 (Bernardi 1995).
Comparative sequence analysis revealed strong conservation of SNCA/Snca coding exons and several other regions of high sequence similarity, particularly in intron 4 and immediately upstream of exon 1. The transient reporter experiments reported here demonstrate that the region upstream of exon 1 contains conserved promotor elements that directly affect the expression of SNCA over and above the contribution of the NACP-REP1 repeat. A search for transcription factor–binding sites using a prediction program (Quandt et al. 1995) and guided by the human/mouse sequence alignments revealed numerous potential sites (data not shown), but we are interpreting these data cautiously. Determining the legitimacy of a predicted transcription factor–binding site will require in vivo experimentation.
The 19 ECRs discovered in intron 4 represent multiple targets for germ-line mutagenesis studies to ascertain their role in SNCA/Snca expression. Because of the high overall conservation of sequence in this intron, we are wary of potential false positive data; in that regard, it would be particularly useful to analyze a third sequence at an evolutionary distance >90 million years (human/mouse), such as 300 million years (human/chicken) or even 900 million years (human/pufferfish; Davidson et al. 2000; Gottgens et al. 2000). Nevertheless, the information gleaned from our human/mouse comparison of the α-synuclein locus facilitates the ongoing characterization of this medically important gene and accelerates our understanding of the role of SNCA in PD pathogenesis.
METHODS
Genetic Mapping and Polymorphism Analysis
Snca was mapped on the Jackson Laboratory Backcross DNA Panel Mapping Resource ([C57BL/6JEi × SPRET/Ei]F1 × SPRET/Ei; Jackson BSS; Rowe et al. 1994b). Primers CTGGATTCCACTGAGGACTGG and CAATGGCTCTCCTC CCTGTAC flank a dinucleotide repeat in intron 4 (position 68762–68922 in mouse BAC sequence) and amplify a 161-bp fragment with (CA)22 from 129Sv/J DNA. The identity of the PCR product was confirmed by digestion with _Nde_1 (at position 68799) and _Hind_III (at position 68820). PCR products were sized on 3.5% low–melting point agarose gels. Polymorphisms of two mouse dinucleotide repeats at the SNCA locus were typed by PCR. The repeat 5′ of the gene was amplified with primers CAACACACTTACAGAGCTC and GTGCAGTT TCTTCTCTTGC (position 12949–13170 in mouse BAC sequence). PCR products were sized on a 6% acrylamide denaturing gel after one primer was end-labeled with α32P-ATP. PCR products that differed in length from the 129SvEv/Tac product were gel purified and sequenced using the same primers. Mapping of human ATOH2, which has not yet been cloned, was accomplished in silico by blast searching against completed human genomic sequence using the human orthologof Atoh2, encoded by EST GI:2739428 (accession no. U69205), and finding the gene mapped to Hs7_1683 in 7p14-p15 with 99% identity (score [bits] = 2944, probability E = 0.0).
Genomic Sequencing
The human PAC clone 27M07 (RPCI-1 library; see http://www.chori.org/bacpac/) and mouse BAC clone 155I20 (129/SvJ mouse strain, RW4 cell line; Genome Systems) were identified for sequencing by PCR screening of arrayed PAC/BAC libraries for the presence of both exon 1 and exon 6 of the SNCA/Snca cDNAs (details available on request). The 27M07 and 155I20 clones were sequenced to high accuracy using an established shotgun sequencing strategy (Wilson and Mardis 1997) modified as described (Touchman et al. 2000). Poor-quality regions and gaps in the projects were resolved by sequencing with custom-designed primers. Consensus sequences were assembled and edited using the Phred/Phrap/Consed suite of programs (Gordon et al. 1998; Ewing and Green 1998; Ewing et al. 1998) to a final estimated error frequency of <1 in 104 bp, as estimated by Phrap. Assembly accuracy was confirmed by forward and reverse read pair concordance of individual plasmid subclones and by alignment with the known SNCA/Snca cDNA sequence.
Sequence Analysis
Genomic sequence comparisons with public databases were performed with PowerBLAST (Zhang and Madden 1997) using the following parameters: BLASTN (M = 1, N = −3, S = 40, S2 = 40) and BLASTX (S = 90, S2 = 90, FILTER = SEG). The gene prediction program GENSCAN (Burge and Karlin 1997) was used to predict putative genes. Precise location of SNCA/Snca exons were determined by BLAST and by cDNA sequence overlap with genomic sequence. RepeatMasker (http://ftp.genome.washington.edu/cgi-bin/RepeatMasker) was used to identify mouse and human repetitive elements and compute G+C content (A.F.A. Smit and P. Green, unpubl.). Simple repeats were detected using the program Sputnik (C. Abajian, unpubl.; http://www.abajian.com/sputnik/).
Sequence Comparisons
Global alignment of the human and mouse genomic sequence was performed with the program VISTA using a window size of 100 bp and a conservation level of 75% (http://sichuan.lbl.gov/vista/). A higher-resolution comparison of the mouse and human region upstream of the first exon was performed with the PipMaker program using the “chaining” option (WWW server: http://bio.cse.psu.edu/pipmaker/). For this analysis, human repetitive sequences were first masked (marked as unalignable) with the program RepeatMasker (http://ftp.genome.washington.edu/cgi-bin/RepeatMasker). The resulting masked sequence was aligned and regions between successive gaps converted into segments of “percentage identity” relative to positions in the human sequence. The resulting data are drawn as a percentage-identity plot (Schwartz et al. 2000). Pairwise sequence comparisons were performed with the ALIGN program (http://dot.imgen.bcm.tmc.edu:9331/seq-search/alignment.html).
Luciferase Reporter Constructs
A 10.7-kb DNA fragment upstream of the α-synuclein translation start site was amplified from human PAC 27M07 (positions 19040–29776). The PCR was performed using the Expand Taq system (Roche Molecular Biochemicals). The forward primer for the amplification was TGAAGTTAACCTC CCCTCAATACC, and the reverse primer was CCTTTACAC CACACTGGAAAACATAAA. The PCR product was cloned into the pCR-XL-TOPO vector (Invitrogen Corporation) following the manufacturer's instructions. For construction of the NACP-REP1 deleted plasmid, the _Stu_I restriction site in the insert (position 19,889) and the _Kpn_I site of the pCR-XL-TOPO vector were used. Next, we restricted each promoter construct at the _Mlu_I-_Xho_I sites of pCR-XL-TOPO and cloned each into the _Mlu_I-_Xho_I sites of the pGL-3 Basic vector (Promega Corporation), which contains the firefly luciferase coding sequence but lacks eukaryotic promoter or enhancer elements. The full-length promoter-enhancer plasmid is designated pGL 3-ASP, and the repeat deletion plasmid is designated pGL 3-ASPdel.
Cell Culture and Transfection
293T cells were grown in Dulbecco's modified Eagles medium (glucose at 4.5 g/L) supplemented with 10% fetal bovine serum, 2 mM glutamine, 100 U/mL penicillin, and 100 mg/mL streptomycin. Cells were maintained at 37°C in a humidified 5% CO2 incubator. Onto each well of a six-well dish, 2.5 × 10⁵ cells were plated the day before transfection. For each cotransfection experiment, 100 ng of pGL 3-ASP or pGL 3-ASPdel or 33 ng of pGL 3-Basic and 1 ng of the reference plasmid, pRL-TK (harboring the HSV thymidine kinase promoter upstream of Renilla luciferase), were mixed and cotransfected by the calcium phosphate method using a mammalian transfection kit (Stratagene) according to the manufacturer's instructions. For each experiment, cells were plated into nine wells. Three wells at a time were independently transfected in parallel with three individually prepared aliquots of each of the three constructs in calcium phosphate. Each experiment was repeated on three separate occasions. Cells were incubated for 24 h at 37°C, washed with phosphate-buffered saline, and incubated in fresh medium for additional 24 h.
Luciferase Assay
293T cells were washed and lysed in 150 μL of Passive Lysis Buffer (Promega). Firefly luciferase and Renilla luciferase activities were measured with 5 μL of cell lysate using the Dual-Luciferase Reporter assay system (Promega) in a luminometer (EG&G Wallac). Relative activity is defined as the ratio of firefly luciferase activity to Renilla luciferase activity and was calculated by dividing luminescence intensity obtained in the assay for firefly luciferase by that obtained for Renilla luciferase. Fold expression is defined as the ratio of promoter induced expression to basal expression and was calculated by dividing the average value of relative activity of each construct to the relative activity of the pGL 3-Basic plasmid.
Acknowledgments
We thank Gerard Bouffard, Steven Beckstrom-Sternberg, Nicole Dietrich, and the staff of the NIH Intramural Sequencing Center for DNA sequencing; William Pavan for aliquots of the Jackson Laboratory BSS Panel DNAs; Lucy Rowe for statistical analysis of the genotyping data; Webb Miller for thoughtful discussion; and Eric Green and James Thomas for critical review of the manuscript. This work was supported in part by the National Parkinson's Foundation.
The publication costs of this article were defrayed in part by payment of page charges. This article must therefore be hereby marked “advertisement” in accordance with 18 USC section 1734 solely to indicate this fact.
Footnotes
E-MAIL rlnuss@nhgri.nih.gov; FAX (301) 402-2170.
REFERENCES
- Altschul SF, Gish W, Miller W, Myers EW, Lipman DJ. Basic local alignment search tool. J Mol Biol. 1990;215:403–410. doi: 10.1016/S0022-2836(05)80360-2. [DOI] [PubMed] [Google Scholar]
- Batzoglou S, Pachter L, Mesirov JP, Berger B, Lander ES. Human and mouse gene structure: Comparative analysis and application to exon prediction. Genome Res. 2000;10:950–958. doi: 10.1101/gr.10.7.950. [DOI] [PMC free article] [PubMed] [Google Scholar]
- Bernardi G. The human genome: Organization and evolutionary history. Annu Rev Genet. 1995;29:445–476. doi: 10.1146/annurev.ge.29.120195.002305. [DOI] [PubMed] [Google Scholar]
- Burge C, Karlin S. Prediction of complete gene structures in human genomic DNA. J Mol Biol. 1997;268:78–94. doi: 10.1006/jmbi.1997.0951. [DOI] [PubMed] [Google Scholar]
- Campion D, Martin C, Heilig R, Charbonnier F, Moreau V, Flaman JM, Petit JL, Hannequin D, Brice A, Frebourg T. The NACP/synuclein gene: Chromosomal assignment and screening for alterations in Alzheimer disease. Genomics. 1995;26:254–257. doi: 10.1016/0888-7543(95)80208-4. [DOI] [PubMed] [Google Scholar]
- Chen X, de Silva HA, Pettenati MJ, Rao PN, George-Hyslop P, Roses AD, Xia Y, Horsburgh K, Ueda K, Saitoh T. The human NACP/α-synuclein gene: Chromosome assignment to 4q21.3–q22 and TaqI RFLP analysis. Genomics. 1995;26:425–427. doi: 10.1016/0888-7543(95)80237-g. [DOI] [PubMed] [Google Scholar]
- Davidson H, Taylor MS, Doherty A, Boyd AC, Porteous DJ. Genomic sequence analysis of fugu rubripes CFTR and flanking genes in a 60 kb region conserving synteny with 800 kb of human chromosome 7. Genome Res. 2000;10:1194–1203. doi: 10.1101/gr.10.8.1194. [DOI] [PMC free article] [PubMed] [Google Scholar]
- Dubchak I, Brudno M, Loots GG, Pachter L, Mayor C, Rubin EM, Frazer KA. Active conservation of noncoding sequences revealed by three-way species comparisons. Genome Res. 2000;10:1304–1306. doi: 10.1101/gr.142200. [DOI] [PMC free article] [PubMed] [Google Scholar]
- Ellsworth RE, Jamison DC, Touchman JW, Chissoe SL, Braden Maduro VV, Bouffard GG, Dietrich NL, Beckstrom-Sternberg SM, Iyer LM, Weintraub LA, et al. Comparative genomic sequence analysis of the human and mouse cystic fibrosis transmembrane conductance regulator genes. Proc Natl Acad Sci. 2000;97:1172–1177. doi: 10.1073/pnas.97.3.1172. [DOI] [PMC free article] [PubMed] [Google Scholar]
- Ewing B, Green P. Base-calling of automated sequencer traces using phred. II. Error probabilities. Genome Res. 1998;8:186–194. [PubMed] [Google Scholar]
- Ewing B, Hillier L, Wendl MC, Green P. Base-calling of automated sequencer traces using phred. I. Accuracy assessment. Genome Res. 1998;8:175–185. doi: 10.1101/gr.8.3.175. [DOI] [PubMed] [Google Scholar]
- Gordon D, Abajian C, Green P. Consed: A graphical tool for sequence finishing. Genome Res. 1998;8:195–202. doi: 10.1101/gr.8.3.195. [DOI] [PubMed] [Google Scholar]
- Gottgens B, Barton LM, Gilbert JG, Bench AJ, Sanchez MJ, Bahn S, Mistry S, Grafham D, McMurray A, Vaudin M, Amaya E, Bentley DR, Green AR. Analysis of vertebrate SCL loci identifies conserved enhancers. Nat Biotechnol. 2000;18:181–186. doi: 10.1038/72635. [DOI] [PubMed] [Google Scholar]
- Hardison RC, Oeltjen J, Miller W. Long human-mouse sequence alignments reveal novel regulatory elements: A reason to sequence the mouse genome. Genome Res. 1997;7:959–966. doi: 10.1101/gr.7.10.959. [DOI] [PubMed] [Google Scholar]
- Hellman NE, Grant EA, Goate AM. Failure to replicate a protective effect of allele 2 of NACP/α-synuclein polymorphism in Alzheimer's disease: An association study. Ann Neurol. 1998;44:278–281. doi: 10.1002/ana.410440223. [DOI] [PubMed] [Google Scholar]
- Ishihara K, Hatano N, Furuumi H, Kato R, Iwaki T, Miura K, Jinno Y, Sasaki H. Comparative genomic sequencing identifies novel tissue-specific enhancers and sequence elements for methylation-sensitive factors implicated in Igf2/H19 imprinting. Genome Res. 2000;10:664–671. doi: 10.1101/gr.10.5.664. [DOI] [PMC free article] [PubMed] [Google Scholar]
- Kholodilov NG, Neystat M, Oo TF, Lo SE, Larsen KE, Sulzer D, Burke RE. Increased expression of rat synuclein in the substantia nigra pars compacta identified by mRNA differential display in a model of developmental target injury. J Neurochem. 1999;73:2586–2599. doi: 10.1046/j.1471-4159.1999.0732586.x. [DOI] [PubMed] [Google Scholar]
- Koop BF, Hood L. Striking sequence similarity over almost 100 kilobases of human and mouse T-cell receptor DNA. Nat Genet. 1994;7:48–53. doi: 10.1038/ng0594-48. [DOI] [PubMed] [Google Scholar]
- Kruger R, Kuhn W, Muller T, Woitalla D, Graeber M, Kosel S, Przuntek H, Epplen JT, Schols L, Riess O. Ala30Pro mutation in the gene encoding α-synuclein in Parkinson's disease. Nat Genet. 1998;18:106–108. doi: 10.1038/ng0298-106. [DOI] [PubMed] [Google Scholar]
- Kruger R, Vieira-Saecker AM, Kuhn W, Berg D, Muller T, Kuhnl N, Fuchs GA, Storch A, Hungs M, Woitalla D, et al. Increased susceptibility to sporadic Parkinson's disease by a certain combined α-synuclein/apolipoprotein E genotype. Ann Neurol. 1999;45:611–617. doi: 10.1002/1531-8249(199905)45:5<611::aid-ana9>3.0.co;2-x. [DOI] [PubMed] [Google Scholar]
- Lavedan C. The synuclein family. Genome Res. 1998;8:871–880. doi: 10.1101/gr.8.9.871. [DOI] [PubMed] [Google Scholar]
- Makalowski W, Zhang J, Boguski MS. Comparative analysis of 1196 orthologous mouse and human full-length mRNA and protein sequences. Genome Res. 1996;6:846–857. doi: 10.1101/gr.6.9.846. [DOI] [PubMed] [Google Scholar]
- Mallon A, Platzer M, Bate R, Gloeckner G, Botcherby MR, Nordsiek G, Strivens MA, Kioschis P, Dangel A, Cunningham D, et al. Comparative genome sequence analysis of the Bpa/Str region in mouse and man. Genome Res. 2000;10:758–775. doi: 10.1101/gr.10.6.758. [DOI] [PMC free article] [PubMed] [Google Scholar]
- Mayor, C., Brudno, M., Schwartz, J.R., Rubin, E.M., Frazer, K.A., Pachter, L.S., and Dubchak, I. 2000. VISTA: Visualization tool for alignments. Bioinformatics (in press). [DOI] [PubMed]
- Miller W. So many genomes, so little time. Nat Biotechnol. 2000;18:148–149. doi: 10.1038/72588. [DOI] [PubMed] [Google Scholar]
- Oeltjen JC, Malley TM, Muzny DM, Miller W, Gibbs RA, Belmont JW. Large-scale comparative sequence analysis of the human and murine Bruton's tyrosine kinase loci reveals conserved regulatory domains. Genome Res. 1997;7:315–329. doi: 10.1101/gr.7.4.315. [DOI] [PubMed] [Google Scholar]
- Polymeropoulos MH, Higgins JJ, Golbe LI, Johnson WG, Ide SE, Di Iorio G, Sanges G, Stenroos ES, Pho LT, Schaffer AA, et al. Mapping of a gene for Parkinson's disease to chromosome 4q21-q23. Science. 1996;274:1197–1199. doi: 10.1126/science.274.5290.1197. [DOI] [PubMed] [Google Scholar]
- Polymeropoulos MH, Lavedan C, Leroy E, Ide SE, Dehejia A, Dutra A, Pike B, Root H, Rubenstein J, Boyer R, et al. Mutation in the α-synuclein gene identified in families with Parkinson's disease. Science. 1997;276:2045–2047. doi: 10.1126/science.276.5321.2045. [DOI] [PubMed] [Google Scholar]
- Quandt K, Frech K, Karas H, Wingender E, Werner T. MatInd and MatInspector: New fast and versatile tools for detection of consensus matches in nucleotide sequence data. Nucleic Acids Res. 1995;23:4878–4884. doi: 10.1093/nar/23.23.4878. [DOI] [PMC free article] [PubMed] [Google Scholar]
- Rowe LB, Nadeau JH, Turner R, Frankel WN, Letts VA, Eppig JT, Ko MS, Thurston SJ, Birkenmeier EH. Maps from two interspecific backcross DNA panels available as a community genetic mapping resource. Mamm Genome. 1994a;5:253–274. doi: 10.1007/BF00389540. [DOI] [PubMed] [Google Scholar]
- Rowe PSN, Francis F, Goulding J. Rapid isolation of DNA sequences flanking microsatellite repeats. Nucleic Acids Res. 1994b;22:5135–5136. doi: 10.1093/nar/22.23.5135. [DOI] [PMC free article] [PubMed] [Google Scholar]
- Schwartz S, Zhang Z, Frazer KA, Smit A, Riemer C, Bouck J, Gibbs R, Hardison R, Miller W. PipMaker—A web server for aligning two genomic DNA sequences. Genome Res. 2000;10:577–586. doi: 10.1101/gr.10.4.577. [DOI] [PMC free article] [PubMed] [Google Scholar]
- Spillantini MG, Schmidt ML, Lee VM, Trojanowski JQ, Jakes R, Goedert M. α-synuclein in Lewy bodies. Nature. 1997;388:839–840. doi: 10.1038/42166. [DOI] [PubMed] [Google Scholar]
- Touchman JW, Anikster Y, Dietrich NL, Maduro VV, McDowell G, Shotelersuk V, Bouffard GG, Beckstrom-Sternberg SM, Gahl WA, Green ED. The genomic region encompassing the nephropathic cystinosis gene (CTNS): Complete sequencing of a 200-kb segment and discovery of a novel gene within the common cystinosis-causing deletion. Genome Res. 2000;10:165–173. doi: 10.1101/gr.10.2.165. [DOI] [PMC free article] [PubMed] [Google Scholar]
- Ueda K, Fukushima H, Masliah E, Xia Y, Iwai A, Yoshimoto M, Otero DA, Kondo J, Ihara Y, Saitoh T. Molecular cloning of cDNA encoding an unrecognized component of amyloid in Alzheimer disease. Proc Natl Acad Sci. 1993;90:11282–11286. doi: 10.1073/pnas.90.23.11282. [DOI] [PMC free article] [PubMed] [Google Scholar]
- Vila M, Vukosavic S, Jackson-Lewis V, Neystat M, Jakowec M, Przedborski S. α-synuclein up-regulation in substantia nigra dopaminergic neurons following administration of the parkinsonian toxin MPTP. J Neurochem. 2000;74:721–729. doi: 10.1046/j.1471-4159.2000.740721.x. [DOI] [PubMed] [Google Scholar]
- Wilson RK, Mardis ER. Shotgun sequencing. In: Birren B, et al., editors. Analyzing DNA. Cold Spring Harbor, NY: Cold Spring Harbor Laboratory Press; 1997. pp. 397–454. [Google Scholar]
- Xia Y, Rohan de Silva HA, Rosi BL, Yamaoka LH, Rimmler JB, Pericak-Vance MA, Roses AD, Chen X, Masliah E, DeTeresa R, et al. Genetic studies in Alzheimer's disease with an NACP/α-synuclein polymorphism. Ann Neurol. 1996;40:207–215. doi: 10.1002/ana.410400212. [DOI] [PubMed] [Google Scholar]
- Xiao H, Merril CR, Polymeropoulos MH. Dinucleotide repeat polymorphism at the D7S476 locus. Hum Mol Genet. 1993;1:549. doi: 10.1093/hmg/1.7.549. [DOI] [PubMed] [Google Scholar]
- Zhang J, Madden TL. PowerBLAST: A new network BLAST application for interactive or automated sequence analysis and annotation. Genome Res. 1997;7:649–656. doi: 10.1101/gr.7.6.649. [DOI] [PMC free article] [PubMed] [Google Scholar]