Hypoxia Induced Energy Stress Regulates mRNA Translation and Cell Growth (original) (raw)
. Author manuscript; available in PMC: 2011 Aug 9.
Abstract
Oxygen deprivation, or hypoxia, has profound effects on cell metabolism and growth. Cells can adapt to low O2 in part through activation of hypoxia-inducible factor (HIF). We report here that hypoxia inhibits mRNA translation by suppressing multiple key regulators including eIF2α, eEF2, and the mTOR effectors 4EBP1, p70S6K, and rpS6, independent of HIF. Hypoxia results in energy starvation and activation of the AMPK/TSC2/Rheb/mTOR pathway. Hypoxic AMPK activation also leads to eEF2 inhibition. Moreover, hypoxic effects on cellular bioenergetics and mTOR inhibition increase over time. Mutation of the TSC2 tumor suppressor gene confers a growth advantage to cells by repressing hypoxic mTOR inhibition and hypoxia-induced G1 arrest. Together, eIF2α, eEF2 and mTOR inhibition represent important HIF-independent mechanisms of energy conservation which promote survival under low O2 conditions.
Keywords: Hypoxia, mTOR, eIF2, eEF2, AMPK, TSC2, Rheb
INTRODUCTION
Oxygen (O2) is essential for the viability and function of most metazoan organisms and closely monitored at both the organismal and cellular levels. To survive O2 deficiency, cells activate a variety of adaptive mechanisms (Hochachka et al., 1996), including inhibition of energy-costly mRNA translation (Arsham et al., 2003; Koumenis et al., 2002; Wouters et al., 2005). mRNA translation is a critical component of cell growth and proliferation that is primarily regulated at the initiation stage, namely the assembly of the m7-GTP cap-binding eIF4E/eIF4A/eIF4G (eIF4F) and the 40S ribosome-binding eIF2/GTP/met-tRNA ternary complexes. Formation of these complexes is closely modulated by the phosphorylation status of 4EBP and eIF2α and highly influenced by environmental stimuli, such as mitogens and nutrients, and environmental stresses. For example, amino acid starvation and UV irradiation inhibit protein synthesis by inducing eIF2α phosphorylation at Ser51, leading to an enhanced affinity for GDP and reduced formation of the eIF2/GTP/met-tRNA complex (Clemens, 2001; Liu and Simon, 2004). Additional regulation also occurs at translation elongation (Patel et al., 2002). Upon energy starvation, the AMP-activated protein kinase (AMPK) phosphorylates eEF2K on Ser398 and activates its kinase activity (Browne et al., 2004). eEF2K then phosphorylates elongation factor eEF2 at Thr56, resulting in the inhibition of peptide elongation (Patel et al., 2002).
The Ser/Thr kinase mammalian target of rapamycin (mTOR) integrates signals from growth factors and nutrients to regulate cell size, division, and metabolism through control of cap-dependent translation (Abraham, 2004). Phosphorylation of downstream targets p70S6K and rpS6 by mTOR results in increased ribosome biogenesis, via enhanced translation of “TOP” mRNAs encoding ribosomal proteins and elongation factors (Schmelzle and Hall, 2000). mTOR also phosphorylates 4EBPs, rendering them unable to bind to and inhibit eIF4E, therefore promoting cap-dependent translation. mTOR activity is regulated by the PI3K/Akt, AMPK, and ERK pathways (Inoki et al., 2002; Inoki et al., 2003; Ma et al., 2005), which converge at the tuberous sclerosis complex (TSC) that consists of TSC1 and TSC2 dimers (Kwiatkowski, 2003; Li et al., 2004a; Manning and Cantley, 2003). The TSC complex represses mTOR by acting as a GTPase-activating protein (GAP) toward the small GTPase Rheb (Li et al., 2004b). While TSC2 phosphorylation by Akt and ERK suppress TSC2 GAP activity (Kwiatkowski, 2003; Ma et al., 2005), TSC2 phosphorylation by AMPK enhances its activity (Inoki et al., 2002; Inoki et al., 2003). The stress-induced proteins REDD1 and REDD2 potently inhibit mTOR signaling and REDD1 functions downstream of Akt and upstream of TSC2 (Corradetti et al., 2005; Schwarzer et al., 2005). Multiple upstream regulators of mTOR, including PTEN, TSC1, TSC2, and LKB1, are frequently mutated in human cancers, suggesting a possible role for deregulated protein synthesis during tumor development (Tee and Blenis, 2005).
We have previously shown that modest hypoxia (1.5% O2) inhibits mRNA translation via the rapid hypophosphorylation of mTOR targets 4EBP1, p70S6K, and rpS6 (Arsham et al., 2003). More recent studies have revealed that hypoxic mTOR regulation requires the TSC1/TSC2 complex and de novo transcription and expression of REDD1 (Brugarolas et al., 2004). REDD1 and its Drosophila homolog Scylla are HIF-target genes induced by low O2 (Brugarolas et al., 2004; Reiling and Hafen, 2004). Simultaneous loss of Scylla and the related protein Charybdis decreases the survival rate of flies under low O2 (Reiling and Hafen, 2004).
While the HIF-dependent REDD1-mediated feedback inhibition of mTOR provides insight into hypoxic regulation of mTOR, the rapid mTOR inhibition (within 15 min) by hypoxia cannot be explained by transcriptional activation of REDD1. In addition, the cellular mechanism by which hypoxia activates TSC2 has not been established, nor has a role for the TSC2 substrate Rheb in this regulation been determined. In this study, we have investigated the effects of modest hypoxia (1.5% and 0.5% O2) on different regulatory steps of mRNA translation. We report that hypoxia concomitantly inhibits eIF2α and eEF2, as well as the mTOR targets 4EBP1, p70S6K, and rpS6. Our data support regulatory roles for TSC2 and HIF-inducible REDD1 during hypoxic mTOR regulation. However, we also demonstrate that hypoxic mTOR inhibition involves additional signaling pathways and can occur independent of HIF. Hypoxia promotes cellular energy starvation and activates the AMPK/TSC2/Rheb pathway, resulting in mTOR inhibition. TSC2 mutation in tumor cells blocks hypoxic mTOR inhibition and hypoxia-induced cell cycle arrest, thereby conferring a growth advantage under low O2. In summary, we present evidence that hypoxia induces conditions of energy starvation which lead to inhibition of protein synthesis. Our findings indicate that AMPK and TSC2 play important roles in coupling hypoxic effects on cellular energy levels to control protein synthesis, cell growth, and proliferation.
RESULTS
Hypoxia inhibits multiple signaling pathways regulating mRNA translation
Multiple reports describe hypoxic (1–1.5% O2) and anoxic (< 0.02% O2) effects on mRNA translation (Arsham et al., 2003; Blais et al., 2004; Brugarolas et al., 2004; Horman et al., 2002; Koumenis et al., 2002). Modest hypoxia can occur in various physiological and pathological conditions (embryogenesis, tumor formation, and inflammation). Therefore, we evaluated the effects of modest hypoxia (1.5% O2) on multiple regulators of protein synthesis using serum replete HEK293 cells and rhabdomyosarcoma Rh30 cells that have been used for analyzing mTOR signaling (Dudkin et al., 2001; Inoki et al., 2003). As expected, insulin enhanced the phosphorylation of p70S6K, rpS6, and 4EBP1, while LY294002 and 2-deoxy-D-glucose (2-DG) resulted in hypophosphorylation of these mTOR effectors in HEK293 cells (Fig. 1A). Notably, hypoxia resulted in hypophosphorylation of p70S6K, rpS6, and 4EBP1 within 6 hr and hypophosphorylation was enhanced by extended exposure to low O2 (20 hr) in HEK293 (Fig. 1A) and Rh30 cells (Fig. Supplement 1A). Hypoxia (up to 20 hr) resulted in no change in total rpS6 (Fig. 1A), 4EBP1, or p70S6K protein levels (data not shown). These results indicate that low O2 alone can effectively inhibit mTOR activity. In addition to mTOR inhibition, hypoxia also caused the hyperphosphorylation and inhibition of eIF2α (Ser51) and eEF2 (Thr56) in HEK293 (Fig. 1B) and Rh30 cells (Fig. Supplement 1B). These changes were detected within 2 hr and enhanced by extended hypoxia. Taken together, these data indicate that moderate hypoxia suppresses translation by inhibiting the activity of mTOR, eIF2, and eEF2.
Figure 1. Hypoxia inhibits protein synthesis by rapidly suppressing multiple key regulators of mRNA translation.
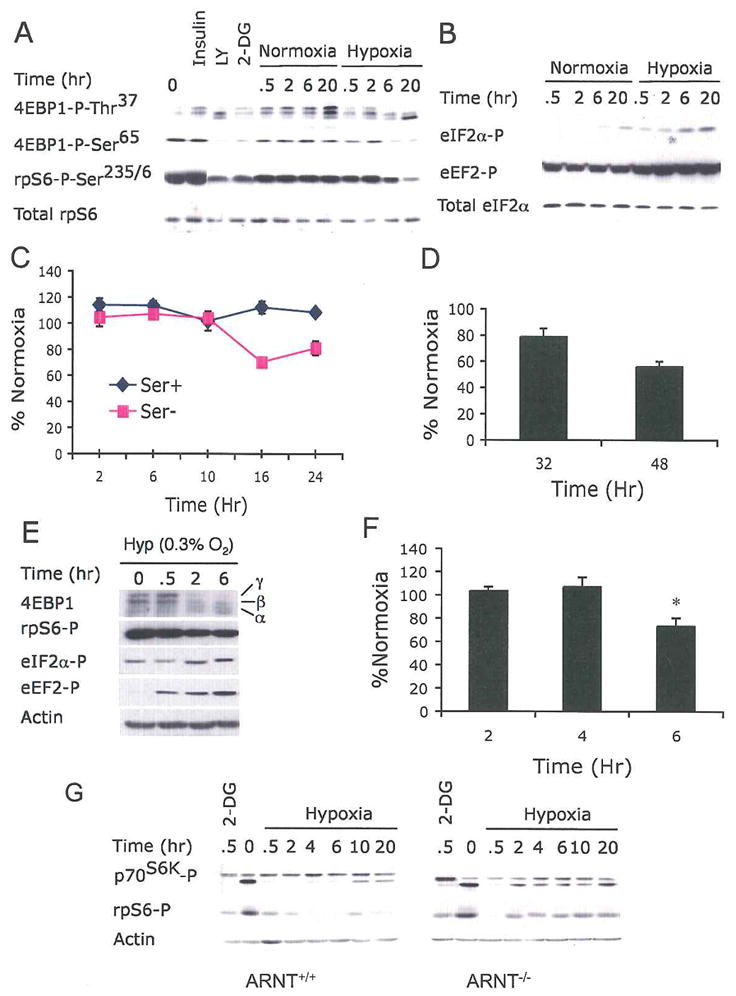
(A) HEK293 cells were subjected to normoxia (21% O2) or hypoxia (1.5% O2) for 0–20 hr, or treated with insulin, LY294002 (LY), or 2-deoxy-D-glucose (2-DG) for 0.5 hr. Whole cell extracts were analyzed by Western blot for phosphorylation of the indicted residues of 4EBP1 and rpS6.
(B) Cell extracts were analyzed for phosphorylation of eIF2α at Ser51 and eEF2 at Thr56. Sample loading was adjusted with total eIF2α protein.
(C–D) Serum replete (Ser+) and serum-depleted (Ser−) HEK293 cells were exposed to 21% or 1.5% O2 for 2–48 hr. Protein synthesis was measured by 35S-Met incorporation followed by TCA precipitation. The same samples were also analyzed by gel electrophoresis (see Fig. Supplement 1D and 1E). Results were expressed relative to cells grown under normoxia. Data for serum replete cells are shown in (D).
(E) HEK293 cells were grown at 0.3% O2 for 0–6 hr and phosphorylation of 4EBP1, rpS6, eIF2α, and eEF2 was examined. 4EBP1 hypophosphorylation is indicated by its shift from the hyperphosphorylated γ and β forms to the less phosphorylated α form.
(F) Protein synthesis for serum replete HEK293 cells grown at 0.3% O2 is shown.
(G) Hypoxic mTOR inhibition can occur independent of HIF activity. ARNT+/+ or ARNT−/− MEFs were treated with 1.5% O2 for 0–20 hr and phosphorylation of p70S6K and rpS6 was examined by Western blot.
Both mTOR and PERK participate in hypoxic inhibition of protein synthesis
Anoxia has been shown to rapidly reduce protein synthesis by 60–70% within 1 hr (Kraggerud et al., 1995) and decrease the amount of polysome-associated mRNA within 4 hr (Wouters et al., 2005). To assess the effect of modest hypoxia on protein synthesis, we measured the levels of 35S-methionine (Met) incorporation in HEK293 cells grown under 1.5% O2. Despite more rapid changes in 4EBP1, eIF2α, and eEF2 phosphorylation status, hypoxia alone (up to 24 hr) did not cause any significant decrease in protein synthesis in serum replete HEK293 cells (Fig. 1C). However, approximately 25% and 40% reductions in protein synthesis were detected after 32 and 48 hr of hypoxia (Fig. 1D). A similar delay in protein synthesis was observed in Rh30 cells where up to 24 hr hypoxia did not result in any significant drop in protein synthesis (Fig. Supplement 1C). Of note, serum starvation facilitated hypoxic reduction of protein synthesis as 20–25% decreases in 35S-Met incorporation were detected in HEK293 cells following 16 and 24 hr of hypoxia (Fig. 1C). Trichloroacetic acid (TCA) precipitation and gel electrophoresis of labeled proteins yielded comparable results for these assays. Densitometric analysis showed a significant 25–30% attenuation in protein synthesis in serum-deprived HEK293 cells after 16–24 hr of hypoxia, but not in serum replete cells (Fig. Supplement 1D and 1E). This delay in protein synthesis inhibition could be due to a requirement for threshold changes (at least 3–4 fold) in eIF4F, eIF2, and eEF2 activities that eventually cause a significant drop in protein synthesis, especially as hypoxic mTOR inhibition becomes more pronounced as the treatment extends. Of note, HEK293 cells cultured under more stringent hypoxia (0.3% O2) exhibited a 25% reduction in protein synthesis by 6 hr (Fig. 1F). This accelerated drop in translation was accompanied by 3–4 fold changes in 4EBP1 and rpS6 by 2 hr (Fig. 1E) as apposed to changes that occur at 6–20 hr at 1.5% O2. Furthermore, a 3-fold change in eEF2 phosphorylation occurred at 1.5% O2 at 2 hr, while a 20–30-fold change was observed at 0.5–2 hr at 0.3% O2. In contrast, we saw comparable changes in eIF2α phosphorylation at 1.5% and 0.3% O2, in agreement with published data (Koumenis et al., 2002). Serum replete HEK293T cells, which exhibited a higher metabolic rate than HEK293 cells (indicated by a higher rate of 35S-Met incorporation), were inhibited more readily by culture at 1.5% O2. Approximately 20–25% reductions were detected as early as 16 hr in HEK293T cells (Fig. Supplement 1C). These results suggest that intracellular ATP levels could influence changes in protein synthesis rates in hypoxic cells. Additionally, hypoxic mTOR inhibition is enhanced by a further decrease in O2 levels and growth factor withdrawal.
The endoplasmic reticulum (ER)-resident kinase PERK, which is activated by ER stress, has been shown to inhibit mRNA translation by phosphorylating eIF2α on Ser51 (Harding et al., 1999). Severe hypoxia activates PERK in a number of cell types (Koumenis et al., 2002). Loss of PERK activity in MEFs significantly attenuated hypoxic inhibition of mRNA translation, as indicated by only a 25% decrease in PERK−/− MEFs relative to a 55% decrease observed in PERK+/+ MEFs following 48 hr exposure to 1.5% O2 (Fig. Supplement 1F). This difference strongly suggests that both the mTOR and eIF2α pathways contribute to hypoxia-induced translation inhibition.
Hypoxic inhibition of mTOR can occur independent of HIF
Brugarolas et al. (2004) recently reported that TSC2 and the HIF target gene REDD1 are necessary and sufficient for hypoxic mTOR inhibition. This is in contrast to our previous report that hypoxia down-regulates mTOR activity within 15 min (Arsham et al., 2003). Therefore, we evaluated the role of HIF and HIF-inducible REDD1 in hypoxic mTOR inhibition using wild type MEFs or those carrying a null mutation for the aryl hydrocarbon nuclear translocator (ARNT), the protein that forms heterodimeric DNA binding complexes with HIF-1α or HIF-2α. HIF activity, examined using a hypoxia response element (HRE)-luciferase reporter assay, was completely abolished in ARNT−/− MEFs (Fig. Supplement 2A), confirming that hypoxic induction of HIF activity is absent in ARNT−/− MEFs. Hypoxia (0.5 hr) resulted in marked hypophosphorylation of 4EBP1, p70S6K, and rpS6 in ARNT−/− MEFs (Fig. 1G), clearly indicating that HIF activity and REDD1 induction are not necessary for the rapid effect of hypoxia on mTOR, especially as REDD1 is induced solely by HIF under hypoxia (Schwarzer et al., 2005). Actinomycin D, a polII transcription inhibitor, effectively blocked hypoxic mTOR inhibition (Fig. Supplement 2B) (Brugarolas et al., 2004). However, treatment with actinomycin D also resulted in hyperphosphorylation of p70S6K, rpS6, and 4EBP1 under both normoxia and reoxygenation conditions (Supplementary Fig. 2B). The latter observation is consistent with a report that actinomycin D has a stimulatory effect on p70S6K and rpS6 (Loreni et al., 2000). Thus, the effects of actinomycin D on hypoxic mTOR inhibition could in part result from mTOR stimulation by actinomycin D.
Interestingly, while p70S6K and rpS6 were hypophosphorylated in both ARNT+/+ and ARNT−/− MEFs throughout the 20 hr of hypoxic treatment, hypophosphorylation was partially reversed within 2 hr in ARNT−/− MEFs. This reversal was not observed until 10 hr in ARNT+/+ MEFs (Fig. 1G). We hypothesize that the reduced mTOR inhibition detected in ARNT−/− MEFs (2–10 hr) could be due to the loss of REDD1-mediated mTOR inhibition. The bi-phasic hypoxic mTOR inhibition described here is likely caused by different mechanisms. While HIF-induced REDD1 activity appears to contribute to hypoxic mTOR inhibition, our data indicate that HIF activity is not necessary for hypoxic mTOR regulation.
Hypoxia affects cellular bioenergetics and activates AMPK
Given that O2 levels regulate oxidative phosphorylation and that AMPK plays an important role in regulating cellular energy homeostasis (Hardie et al., 2003), we investigated the effect of hypoxia on cellular energy status and AMPK activity. AMPK is activated through binding of AMP and subsequent phosphorylation by upstream kinases at a threonine residue within the activation loop of the catalytic α subunit (Thr172 in human AMPK) (Carling, 2004). As shown in Fig. 2A, exposure to 1.5% O2 (2–20 hr) resulted in a mild AMPK hyperphosphorylation at Thr172 in serum replete HEK293 cells. Hyperphosphorylation of AMPK targets acetyl-coA carboxylase (ACC) and eEF2 was more readily detected at all time points examined in both HEK293 (Fig. 2A) and Rh30 cells (Fig. Supplement 3B). Phosphorylation of these effectors in HEK293 cells (including AMPK) was further enhanced when O2 tension was decreased to 0.5% (Fig. Supplement 3A). These results indicate that low O2 alone can activate AMPK, and that hypoxic AMPK stimulation is affected by the severity of O2 deprivation.
Figure 2. Hypoxia-induced energy starvation and AMPK activation are promoted by growth factor withdrawal.
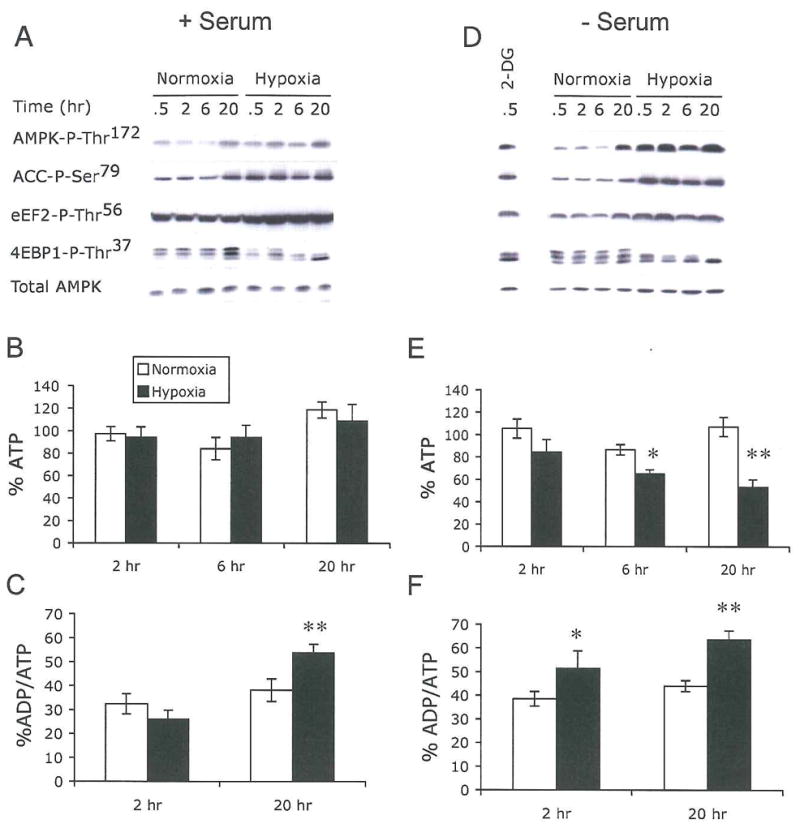
HEK293 cells were exposed to 21% or 1.5% O2 for 0–20 hr in the presence (A–C) or absence (D–F) of 10% serum.
(A and D) Hypoxia activates AMPK.
Cell extracts were analyzed for AMPK, ACC, eEF2, and 4EBP1 phosphorylation. Levels of total AMPK are shown to assess sample loading.
(B–F) Hypoxia modulates cellular ATP and ADP/ATP ratios.
Levels of ATP (B and E) and ADP/ATP (C and F) in cell lysates. Total ATP was adjusted to levels of ATP at 0 hr for both normoxic and hypoxic conditions.
Hypoxia, when coupled with serum starvation, promoted AMPK, ACC, and eEF2 hyperphosphorylation within 30 min to levels comparable to that induced by 2-DG (Fig. 2D). Furthermore, hypoxia resulted in more rapid and significant levels of mTOR inhibition in serum-starved cells when compared with serum replete HEK293 cells. Hypophosphorylation of 4EBP1 and rpS6 was readily detected as quickly as 30 min following a 2 hr serum depletion (Fig. 2A and 2D and data not shown). These changes increased as hypoxic treatment extended. Serum deprivation alone did not cause any significant change in AMPK activity under normoxia (0–6 hr). However, we observed mild increases in AMPK and ACC phosphorylation after 20 hr of normoxia, possibly due to reduced glucose in the culture medium at this time point (Fig. 2D). Hypoxic AMPK activation did not correlate with any significant increase in LKB1 autophosphorylation on Thr189, an AMPKK that has been shown to phosphorylate AMPK (data not shown) (Carling, 2004). Furthermore, Akt activity measured by phosphorylation on Ser473 was only slightly reduced by 6–20 hr hypoxia in HEK293 cells in both serum replete and serum-depleted conditions (data not shown). The latter suggests that the rapid hypoxic mTOR inhibition is unlikely to be caused by the PI3K/Akt cascade.
While 1.5% O2 caused a modest hyperphosphorylation of AMPK, ACC and eEF2, this level of O2 did not correlate with any significant decrease in cellular ATP over a 20 hr time course in serum replete HEK293 cells (Fig. 2B). In contrast, a statistically significant 18% drop occurred at 2 hr in serum-starved cells, while a 50% drop in ATP levels was observed following 20 hr of hypoxia (Fig. 2E). Moreover, 20 hr of hypoxia resulted in an 47% increase in the ADP/ATP ratio in serum replete cells (Fig. 2C), and 30% and 55% increases in ADP/ATP following 2 hr or 20 hr of hypoxia in serum-depleted conditions (Fig. 2F). Hypoxia-induced changes in ADP/ATP were comparable to those caused by both 25 mM 2-DG and staurosporine, which inhibit intracellular bioenergetics (Fig. Supplement 3C and 3D). Taken together, our results indicate that extended hypoxia regulates cellular bioenergetics, and that AMPK is activated by hypoxia, possibly as a consequence of increases in the intracellular ADP/ATP ratio. A combination of hypoxia and growth factor withdrawal further promotes the changes in ATP levels and AMPK activity, rendering AMPK a better substrate for LKB1. We suggest that a 50% drop in ATP levels and a 55% increase in ADP/ATP ratios are necessary to cause a significant decrease in rates of protein synthesis (Fig. 1C).
AMPK inhibits mTOR and eEF2 during hypoxia
To investigate the effect of AMPK activation on hypoxic mTOR modulation, serum-depleted HEK293 cells were treated with the AMPK inhibitor compound C (2 μM or 10 μM), then exposed to 21% or 1.5% O2. As shown in Fig. 3, the AMPK inhibitor effectively blocked 4EBP1, p70S6K, and rpS6 hypophosphorylation caused by 2-DG (Fig. 3A) and low O2 (Fig. 3B), restoring 4EBP1, p70S6K, and rpS6 phosphorylation to levels similar to those observed under normoxic conditions. Compound C itself had negligible effect on mTOR signaling under normoxia (Fig. 3B). In addition, compound C blocked AMPK activation as evidenced by decreased AMPK, ACC and eEF2 phosphorylation (Fig. 3C), indicating that hypoxic activation of eEF2K by AMPK results in the phosphorylation and inhibition of eEF2.
Figure 3. AMPK suppresses mTOR activity under hypoxia.
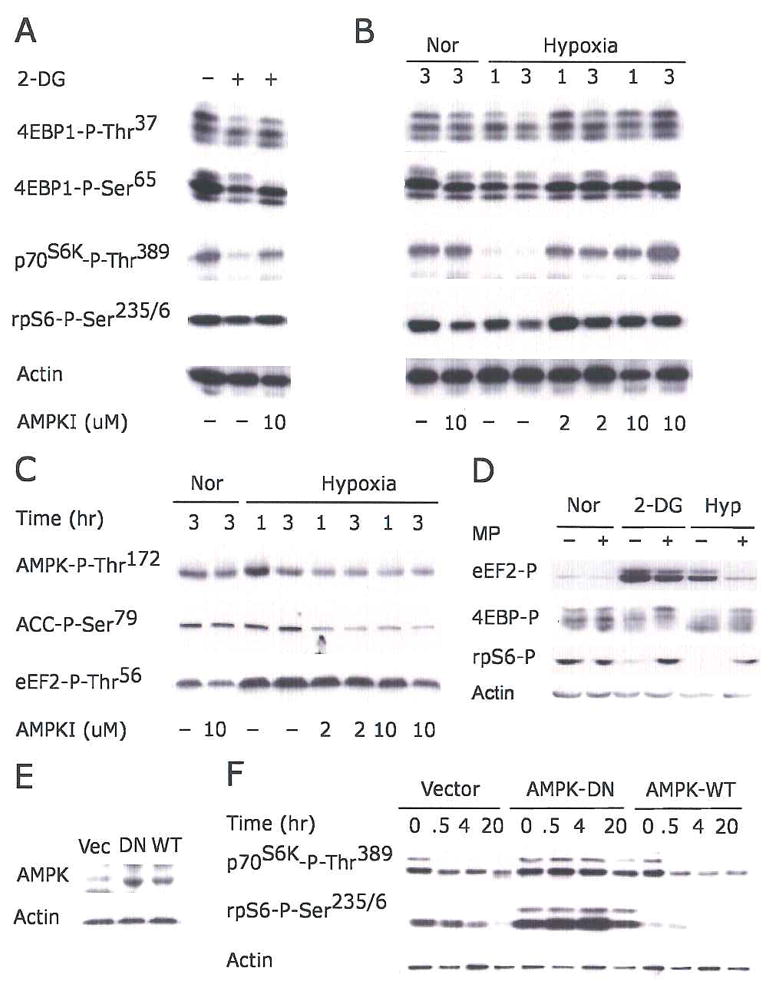
(A–C) Serum-starved HEK293 cells were pretreated with 2 or 10 μM AMPK inhibitor compound C for 30 min before exposure to 2-DG (A), or 21% or 1.5% O2 for 1 or 3 hr (B–C).
(D) Serum replete HEK293 cells were preincubated with 10 mM methylpyruvate (MP) for 2 hr prior to 2-DG or 1.5% O2 (20 hr) treatment. Phosphorylation of eEF2, 4EBP1, and rpS6 are indicated.
(E–F) Kinase-inactive AMPK α2 mutant suppresses hypoxic mTOR inhibition. HEK293 cells were transfected with empty vector, wild-type AMPK-α2 (AMPK-WT), or kinase inactive K45R mutant (AMPK-DN). Clones expressing similar levels of AMPK protein were selected.
(E) Levels of AMPK protein in selected clones.
(F) Phosphorylation of p70S6K and rpS6 in cells exposed to 1.5% O2 for 0–20 hr.
Methylpyruvate (MP) has been shown to be efficiently metabolized by mitochondria, resulting in increased ATP generation (Jijakli et al., 1996). HEK293 cells were preincubated with 10 mM MP prior to 2-DG or low O2 treatment. MP effectively suppressed eEF2 hyperphosphorylation and 4EBP1 and rpS6 hypophosphorylation caused by hypoxia and 2-DG (Fig. 3D). These results strongly support a role for energy depletion as the cause of AMPK activation in hypoxic cells. To further verify the role of AMPK in hypoxia-mediated inhibition of mTOR, we generated HEK293 clones stably expressing the wild-type α2 subunit of AMPK or a dominant negative K45R mutant (Fig. 3E) (Mu et al., 2001). Dominant negative AMPK effectively blocked low O2-induced hypophosphorylation of p70S6K and rpS6, while expression of wild-type AMPK affected neither basal mTOR activity nor hypoxic mTOR inhibition (Fig. 3F). From these data, we conclude that AMPK activation by hypoxia promotes mTOR and eEF2 inhibition.
TSC2–dependent and TSC2-independent effects of hypoxia on mTOR
TSC2 activity has been shown to be regulated by cellular energy status downstream of AMPK. Upon activation by energy starvation, AMPK enhances TSC2 GAP activity via phosphorylation on Ser1337, Ser1341, and Ser1345, resulting in mTOR inhibition (Inoki et al., 2003). To assess the role of TSC2 in hypoxic regulation of mTOR, we examined hypoxic effects on mTOR using cells lacking TSC2. Eker rats are a genetic model for TSC2, and develop spontaneous tumors in multiple organs due to a germline insertional mutation in one allele of the TSC2 gene and a subsequent loss of heterozygosity (Yeung, 2004). Therefore, we employed two TSC2−/− cells derived from mutant rats (ERC15, a renal carcinoma cell line and ELT3, a uterine smooth muscle cell line), and a TSC2+/+ cell line (TRKE2, a kidney epithelial cell line) from wild type rats. Expression of the functional full length TSC2 protein is absent in ERC15 and ELT3 cells, but readily detected in TRKE2 cells (Fig. 5A).
Figure 5. TSC2 and Rheb modulate hypoxia-induced inhibition of mTOR and protein synthesis.

(A–C) TSC2−/− ERC15 cells were stably transected with empty vector (Vec), wild-type (T3 and T21), or N1643K (DN4) TSC2. Clones expressing TSC2 protein at levels similar to TRKE2 cells were selected. *, The asterisk indicates a non-specific polypeptide detected by the anti-TSC2 antibody.
(A) Expression of TSC2 protein in selected ERC15 clones.
(B) ERC15 clones were examined for phosphorylation of p70S6K and rpS6 after 0.5% O2 treatment and serum deprivation.
(C) ERC15 cells were treated with 21% or 0.5% O2 for 48 hr in the presence (Ser+) or absence (Ser−) of 10% serum. *, The asterisk indicates statistically significant difference between Ser+ and Ser− conditions; ◆, The diamond indicates statistically significant differences between normoxic and hypoxic samples.
(D) HEK293 cells were transfected with empty vector or Flag-tagged Rheb. Phosphorylation of 4EBP1 and rpS6, and expression of Flag-Rheb were examined during O2 and serum deprivation by Western blot.
Basal levels of p70S6K and rpS6 phosphorylation were lower in the TSC2+/+ TRKE2 cells compared to that of TSC2−/− ERC15 and ELT3 cells (Fig. 4A), confirming the loss of TSC2 activity in mutant cells. p70S6K and rpS6 were readily hypophosphorylated in cells treated with the PI3K inhibitor LY294002 (Fig. 4A) and rapamycin (data not shown) in all three cell lines. While p70S6K and rpS6 phosphorylation were effectively reduced by 2-DG in TRKE2 cells, TSC2 mutations in ERC15 and ELT3 cells effectively abrogated this change (Fig. 4A). This result confirms that mTOR signaling is refractory to energy stress in TSC2 null cells.
Figure 4. TSC2 modulates hypoxic mTOR inhibition.
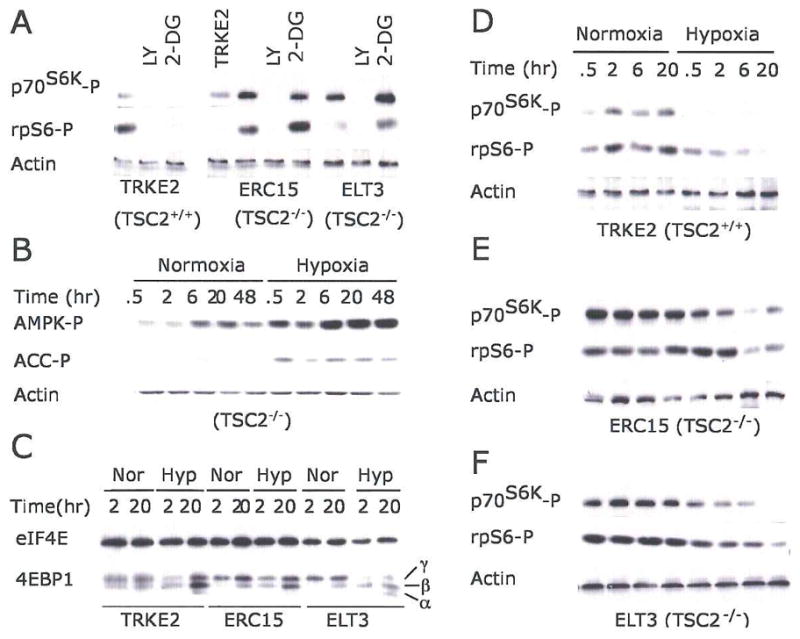
(A) TSC2 null mutation abolishes 2-DG-induced mTOR inhibition.
TRKE2 (TSC2+/+), ERC15 (TSC2−/−), and ELT3 (TSC2−/−) cells were treated with LY294002 or 2-DG for 30 min. Phosphorylation of p70 S6K and rpS6 was assessed by Western blot.
(B) Hypoxia activates AMPK in TSC2−/− ELT3 cells.
Serum-starved ELT3 cells were exposed to 21% or 0.5% O2 for 0.5–48 hr. Levels of AMPK and ACC phosphorylation were examined.
(C–F) Serum-starved TRKE2, ERC15, and ELT3 cells were exposed to 21% or 0.5% O2 for 0–20 hr. Cell extracts from normoxic (Nor) and hypoxic (Hyp) conditions were examined for phosphorylation of 4EBP1 (C), p70S6K and rpS6 (D–F).
Hypoxia (0.5% O2) caused a marked increase in AMPK and ACC phosphorylation in serum-starved TSC2−/− ELT3 cells (Fig. 4B), indicating a regulatory effect of hypoxia on cellular bioenergetics and AMPK activity. In addition, 20 hr of hypoxia resulted in hypophosphorylation of 4EBP1 in all three cell types. This is indicated by the shift of 4EBP1 from the more hyperphosphorylated γ form to the less phosphorylated α and β forms (Fig. 4C). We also observed an enhanced binding of eIF4E to 4EBP1 in all three cell types (data not shown). These results suggest that TSC2 is not absolutely required for hypoxic inhibition of 4EBP1. Hypoxia resulted in p70S6K and rpS6 hypophosphorylation in serum-starved TSC2−/− ERC15 and ELT3 cells after 6–20 hr, confirming that mTOR inhibition by hypoxia could proceed independently of TSC2. However, p70S6K and rpS6 hypophosphorylation was greatly reduced in TSC2−/− cells relative to TSC2−/− TRKE2 cells, especially following 0.5–2 hr hypoxia (Fig, 4D–4F). We also observed a similar reduction in hypoxic mTOR inhibition in serum-starved TSC2−/− MEFs in comparison with TSC2+/+ MEFs (Fig. Supplement 4B). Taken together, these data suggest that, while hypoxic regulation of mTOR could occur independently of TSC2 under long-term low O2, TSC2 is critical for the rapid hypoxic effects on mTOR.
TSC2 contributes to hypoxic inhibition of mRNA translation
To assess the role of TSC2 in hypoxic regulation of mTOR and protein synthesis, we established genetically matched ERC15 cell lines expressing either wild-type TSC2 (clone T3 and T21) or N1643K TSC2 harboring a mutation in the GAP domain (clone DN4). As seen in Fig. 5A, levels of wild type or the mutant protein in ERC15 cells were similar to that of endogenous TSC2 in TRKE2 cells (Fig. 5A). Expression of wild-type TSC2 effectively promoted hypoxic mTOR inhibition in serum-starved TSC2−/− ERC15 cells, as indicated by rapid hypophosphorylation of p70S6K or rpS6 (Fig. 5B). In contrast, hypoxia had little effect on mTOR activity in cells expressing the TSC2 N1643K mutant or empty pcDNA3 vector (Fig. 5B).
We next examined the effect of TSC2 on protein synthesis under hypoxic conditions using these cell lines. As shown in Figure 5C, TSC2 null cells (Vector) or cells expressing the N1643K mutant (DN4) displayed a 15% and 30% decrease in protein synthesis after 48 hr in serum replete and serum-depleted conditions, respectively. Of note, TSC2 expression resulted in statistically significant changes in 35S-Met incorporation: 25% and 47% under serum replete and serum-depleted conditions, respectively (Fig. 5C). Taken together, these data indicate that TSC2 can regulate protein synthesis during hypoxia, and that serum starvation exacerbates this response.
Rheb regulates hypoxic mTOR inhibition
Recent genetic studies in yeast, Drosophila, and mammalian cells have placed Rheb downstream of TSC1/TSC2 in the control of mTOR activity. Biochemical analyses also show that Rheb is a physiological substrate for the GAP activity of TSC2 (Li et al., 2004b). To investigate whether hypoxia-mediated mTOR inhibition involves Rheb, we examined the phosphorylation status of mTOR effectors in serum-starved HEK293 cells overexpressing Rheb under 1.5% O2. As shown in Fig. 5D, expression of Rheb in HEK293 cells induced a modest increase in basal rpS6 phosphorylation. Importantly, it also effectively blocked 4EBP1 and rpS6 hypophosphorylation during 20 hr of hypoxia, indicating that Rheb also mediates hypoxic mTOR regulation.
Hypoxic regulation of cell growth and proliferation requires TSC2
In addition to its regulatory effects on mRNA translation, the TSC1/TSC2 complex negatively modulates cell growth and proliferation (Potter et al., 2001; Tapon et al., 2001). Moreover, low O2 alters cell proliferation by inducing cell cycle arrest or programmed cell death (Goda et al., 2003; Schmaltz et al., 1998). TSC2 deletion results in abnormally high levels of proliferation under hypoxic conditions (Brugarolas et al., 2004), suggesting that TSC2 plays a key role in the control of cell proliferation under low O2. To investigate the role of TSC2 in hypoxic control of cell survival, size, and proliferation, we examined the cell cycle profile of TSC2+/+ TRKE2 cells and TSC2−/− ERC15 cells using BrdU/propidium iodide (PI) staining. As shown in Fig. 6A, 24 hr of hypoxia significantly reduced the proliferation rate of TSC2+/+ TRKE2 cells (Fig. 6A), an effect that was abrogated in cells lacking TSC2 (Fig. 6B). The percentages of TSC2 null ERC15 cells (stably transfected with either vector or the N1643K mutant) in S phase were not changed by low O2 relative to normoxia. However, expression of wild-type TSC2 (T3 and T21) effectively restored hypoxic cell cycle arrest (Fig. 6B and 6C). As shown in Fig. 6B, the reduction of cells in S phase corresponded to an approximately 22% increase in cells in the G1 phase of the cell cycle. These data suggest that loss of TSC2 confers a proliferative advantage to cells under hypoxic conditions, allowing them to overcome hypoxia-induced G1 arrest.
Figure 6. TSC2 mutation enhances cell proliferation under low O2 by abolishing hypoxia-induced cell cycle arrest.

(A–C) Serum replete TRKE2 and ERC15 cells were exposed to 21% or 0.5% O2 for 24 hr. Cell cycle profile was determined by BrdU/PI staining and analyzed by flow cytometry.
(A) Hypoxia suppresses S-phase entry in TSC2+/+ TRKE2 cells. The graph shows the percentages of BrdU+ TRKE2 cells under normoxic and hypoxic conditions.
(B) Representative FACS plots for TSC2−/− ERC15 cells transfected with vector (Vec) or wild-type TSC2 (T21).
(C) Quantification of BrdU+ cells for ERC15 clones.
(D–F) ERC15 cell clones were grown in the presence of 10% FBS under 21 % or 0.5% O2 for 7 days.
(D) ERC15 colonies were stained using 0.2% crystal violet.
(E) Quantifications of size of ERC15 cells subjected to normoxic (light bars) and hypoxic (dark bars) conditions. Cell size was determined by forward scatter (FSC) for cells in G1 phase of the cell cycle.
(F) Representative FACS plots for cell size measurements described in panel E. ERC15 cells (Vec and T3) treated under normoxia (a); Representative plots for Vec (b) and T3 cells (c) under normoxic and hypoxic conditions.
We next investigated the effect of hypoxia and TSC2 on cell survival and cell proliferation using a colony formation assay. ERC15 cells transfected with empty vector, wild-type TSC2, or mutant TSC2 were grown in the presence of 10% serum under 21% or 0.5% O2 for 7 days. Similar numbers of cell colonies were observed among ERC15 cells treated under normoxia or hypoxia (Fig. 6D), suggesting that neither hypoxia nor loss of TSC2 resulted in any significant cell death during this 7-day treatment. Interestingly, hypoxia caused decreases in overall colony size (Fig. 6D). Expression of wild-type TSC2 in TSC2−/− ERC15 cells promoted a further reduction in colony size. We then examined whether the difference in colony size was the result of changes in cell size. As shown in Fig. 6E and 6F, TSC2 inactivation resulted in increased cell size. TSC2-−/− ERC15 cells expressing control vector (Vec) or the GAP mutant (DN4) were approximately 6% larger than wild-type TSC2 expressing cells (T3 and T21). The 7-day hypoxia treatment significantly decreased cell size in all cell types. TSC2 did not show any additive effect with hypoxia on cell size; a 10% decrease in cell size was observed in all ERC15 cell lines regardless of TSC2 status. This result suggests that, while TSC2 plays an important role in mediating hypoxic mTOR inhibition, especially the early response, it has a less significant effect on cell mass accumulation under chronic hypoxic conditions. Since the differences in colony size can not be explained by changes in cell size, our data demonstrate that tumor cells lacking TSC2 have a significant proliferative advantage under low O2 and this enhanced proliferation is likely due to escape from hypoxia-induced G1 cell cycle arrest.
DISCUSSION
We report here several mechanisms of HIF-independent hypoxic regulation of protein synthesis and cell growth: 1) hypoxia-induced cellular energy depletion, 2) mTOR inhibition via the AMPK/TSC2/Rheb pathway, 3) eEF2 inhibition mediated by AMPK, and 4) induction of ER stress that leads to eIF2α inhibition (Fig. 7). AMPK inhibition, TSC2 null mutation, and Rheb overexpression all suppress hypoxic mTOR inhibition. Mutations of TSC2 in tumor cells promote cell growth under low O2 by overcoming hypoxia-induced mTOR inhibition and G1 cell cycle arrest.
Figure 7. Schematic diagram for the signaling pathways modulated by low O2 that lead to translational inhibition.

Hypoxia suppresses signaling for translation initiation, elongation, and ribosome biogenesis via concomitant inhibition of eIF2α eEF2, and mTOR downstream targets 4EBP1, p70S6K, and rpS6. The mTOR regulation involves the AMPK/TSC2/Rheb pathway and is activated by hypoxia-induced decreases in cellular bioenergetics. The eIF2α phosphorylation may be trigged by ER-stress activated PERK and the eEF2 inhibition involves AMPK. HIF-inducible REDD1 has been implicated in the regulation of mTOR upstream of TSC2. Mutations of TSC2 in tumor cells greatly impede hypoxia-induced mTOR inhibition and G1 arrest. Thus, hypoxic translational control may ultimately affect cell growth and proliferation under low O2.
HIF activity and HIF-inducible REDD1 have been previously implicated as necessary for hypoxia-induced mTOR regulation (Brugarolas et al., 2004). However, while our data support a regulatory role for HIF in this hypoxic signaling, we demonstrate that hypoxic mTOR inhibition can occur independent of HIF. The latter is demonstrated by the rapid mTOR inhibition in both ARNT+/+ and ARNT−/− MEFs. Our data support a regulatory role for TSC2 during hypoxic mTOR inhibition. More importantly, we provide a molecular basis for TSC2 regulation, namely hypoxia-induced energy starvation and activation of the AMPK/TSC2/Rheb pathway. We propose that hypoxic mTOR regulation involves multiple pathways, including energy-dependent control mediated by AMPK/TSC2/Rheb, inhibition by the HIF/REDD1/2 pathway, and TSC2-independent mTOR inhibition (Fig. 7).
Protein synthesis consumes a great deal of ATP. Thus, a physiological consequence of hypoxia is the rapid changes in signaling events controlling protein synthesis. We report such inhibitory signaling changes, as indicated by the concomitant inhibition of eIF2α, eEF2, 4EBP1, p70S6K, and rpS6 within 30 min. While eIF2α inhibition is likely induced by ER stress via PERK, eEF2 and mTOR inhibition involves AMPK. In contrast to the rapid signaling changes, we observed a delay (between 24–32 hr) in the direct inhibition of 35S-Met incorporation itself using multiple cell lines. This delay suggests that signaling events occur ahead of a manifested biological change. The delay in protein synthesis inhibition likely results from the requirement of threshold amounts of signaling changes, and from compound effects of multiple stresses such as hypoxia and depletion of growth factors, amino acids, and glucose in the culture medium. This is supported by the acceleration of hypoxia-induced inhibition in protein synthesis by growth factor withdrawal, or more stringent hypoxia (Fig. 1C, 1F and 5C). We observed changes in protein synthesis when ADP/ATP achieved a ratio of 65%. It is noteworthy that the vast majority of solid tumors are characterized by insufficient vasculature and heterogeneous oxygenation. This combination of stresses may mimic the environment in solid tumors where cells experience chronic depletion of O2, growth factors, and glucose. Therefore, the energy starvation and protein synthesis inhibition reported here may reflect the outcome of combined stresses experienced by cells within solid tumors.
Multiple reports have shown that AMPK is critical for coordinating cell growth, proliferation, and survival under energy starvation conditions. Phosphorylation of TSC2 by AMPK protects cells from energy deprivation-induced apoptosis (Inoki et al., 2003). AMPK also coordinates cellular bioenergetics with the metabolic demands of cell proliferation by inducing a p53-dependent cell cycle checkpoint (Jones et al., 2005). Induction of this metabolic arrest promotes cell survival. We show here that AMPK acts as a hypoxic energy sensor and is stimulated by the changes in cellular energy status induced by low O2. AMPK inhibits ATP-consuming anabolic processes during hypoxia, such as mRNA translation and lipid biosynthesis, as reflected by hyperphosphorylation of eEF2 and ACC in our studies. It could also up-regulate ATP-generating catabolic cellular processes such as lipid peroxidation and glycolysis. Thus, the AMPK-mediated mechanisms for energy maintenance could be a cellular mechanism for survival during hypoxia. While it remains to be examined whether or not AMPK plays a role in hypoxic G1 arrest, hypoxia-induced cell cycle arrest observed in our studies is likely another survival mechanism induced under this energy-deficient state. Tumor cells could take advantage of these mechanisms to survive energy deprivation, until hypoxia-stimulated adaptations such as angiogenesis and glycolysis allow for the reestablishment of energetic balance.
AMPK appears not to be required for hypoxic mTOR regulation in some cases (Arsham et al., 2003; Brugarolas et al., 2004). It is worth noting that experimental conditions, such as the duration of hypoxic stress, the severity of hypoxia, and availability of growth factors all affect changes in AMPK activity caused by hypoxia. AMPK is a heterotrimeric complex comprised of a catalytic α subunit and regulatory (β and γ units, and each subunit exists in 2–3 isoforms. The enzyme, when composed of different subunits in different cell types, may respond with varying sensitivity to AMP changes, resulting in different levels of stimulation (Hardie et al., 2003). Moreover, different cells may vary in their relative levels of AMP and ATP during hypoxia, therefore responding differently to energy starvation. Thus, while the AMPK/TSC2/Rheb/mTOR pathway represents an important mechanism for mTOR regulation under chronic hypoxia, distinct cell types may be regulated differently by hypoxia.
Our data clearly demonstrate that TSC2 is involved in hypoxic regulation of protein synthesis and cell proliferation. TSC2 mutation in tumor cells not only effectively suppresses AMPK-induced mTOR inhibition, but also overcomes hypoxia-induced cell growth arrest. We further demonstrate that TSC2 mutations confer a proliferative advantage to tumor cells by abrogating hypoxia-induced G1 arrest. This change in the cell cycle profile cannot be explained by modulation of cyclin D1 or p27, as hypoxia reduces cyclin D1 and enhances p27 levels regardless of their TSC2 status (data not shown). More investigation is needed to determine the mechanism by which TSC2 mutation abrogates hypoxic cell cycle arrest. Our data suggest that the growth advantage of TSC2-null tumor cells under low O2 does not result from increases in cell size. While chronic hypoxia significantly reduces cell size, TSC2 mutation does not block this change. The lack of any significant effect of TSC2 on hypoxic cell size regulation could result from TSC2-independent mTOR inhibition and translational regulation under hypoxia. Alternatively, the lack of cell size regulation may simply be related to the enhanced proliferation of TSC2−/− cells under low O2, especially since cell size is coupled to both cell growth and proliferation.
In summary, we demonstrate that hypoxia controls protein synthesis by concomitantly inhibiting multiple key translational regulators independent of HIF activity. Inhibition of mTOR and eEF2 involves an AMPK-dependent mechanism trigged by hypoxic energy starvation. While hypoxic mTOR regulation is mediated by multiple mechanisms, the AMPK/TSC2/Rheb pathway represents an important mechanism for HIF-independent control of translation, especially during chronic hypoxia. TSC2 is also important for hypoxic regulation of cell growth, and loss of TSC2 function allows cells to escape hypoxia-induced mTOR inhibition and cell cycle arrest. Targeting components of these regulatory pathways may disrupt the growth and proliferation of tumor cells, and hamper their ability to adapt to hypoxia in vivo.
EXPERIMENTAL PROCEDURES
Materials
Anti-TSC2 (C-20) and anti-actin were from Santa Cruz Biotechnology and Chemicon International. Anti-flag was from Sigma. All other antibodies were purchased from Cell Signaling technology. TRKE2 cells, ERC15 cells andELT3 cells were generously provided by Dr. C.L. Walker (University Texas, MD Anderson) (Howe et al., 1995). TSC2−/−, p53−/− and TSC2+/+, p53−/− MEFs were gifts from Dr. Kwiatkowski at Harvard University. Rh30 cells were from Dr. P.J. Houghton (St. Jude Children’s Research Hospital). Rat AMPK-α2 and K45R AMPK-α2 mutant encoded in pcDNA3 vector were generously provided by Dr. M. Birnbaum (University of Pennsylvania). Human wild-type TSC2 and N1643K mutant in pcDNA3-His vector were gifts from Dr. E. Henske (Fox Chase Cancer Institute). The Rheb cDNA was generated by RT-PCR and cloned into pcDNA3 vector with N-terminal 2X Flag tag. AMPK inhibitor compound C was obtained from Merck.
Cell culture, transfection and clone selection
MEFs established from ARNT+/+ and ARNT−/− mice were immortalized by SV40 large T-antigen. Both MEFs and HEK293 cells were maintained in DMEM containing 10% FBS and glutamine. TRKE2, ERC15, and ELT3 cells were cultured in DF8/F12 medium containing 10% FBS as described previously (Howe et al., 1995). For serum starvation, cells were cultured in serum-free media for 2 hr before normoxia, hypoxia or pharmacological treatment. For serum replete conditions, cells were grown in fresh DMEM media containing 10% FBS for 2 hr before any treatment. For pharmacological treatments, cells were exposed to insulin (100 μM) (Sigma), LY294002 (10 μM) (Cayman Chemical), or 2-deoxyglucose (25 μM) (Sigma) for 30 min, or 10 mM methylpyruvate for 2 hr. The cells were plated at densities such that they reached approximately 50%–70% confluence at the time of study and were allowed to adhere overnight prior to any treatment.
HEK293 and ERC15 cells were transfected using Lipofectin (Invitrogen). Stable transfectants for AMPKα2 in HEK293 and TSC2 in ERC15 were selected with 0.8 mg/ml or 0.4 mg/ml geneticin (Invitrogen) respectively. The clones were maintained in 0.5 mg/ml and 0.2 mg/ml geneticin.
Protein synthesis by 35S-Met incorporation
HEK293 or ERC15 cells were exposed to normoxia or hypoxia (1.5% O2) for 2–48 hr in serum replete (10% FBS) or -depleted (0% FBS) conditions. Cells were then switched to Met-free DMEM media supplemented with 10 μCi 35S-Met (Amersham Biosciences) and incubated for 1 hr. The cells were lysed in RIPA buffer containing complete protease inhibitor (Roche) and 1 mM PMSF. Radioactivity in the cell lysate was examined by TCA precipitation followed by Microbeta scintillation counting (Perkin-Elmer) (Lang et al., 2002). Alternatively, cell lysate was resolved by 12.5% SDS-PAGE and examined by autoradiography. The amount of radiolabeling was adjusted with the protein content of each sample.
ATP and ATP/ADP measurements
Levels of ATP or ADP/ATP ratio in HEK293 cell extracts were determined using ATP bioluminescence assay kit CLS II (Roche Applied Science) and ApoGlow assay kit (Cambrex) respectively.
BrdU labeling
ERC15 cells were labeled with 10 μM bromodeoxyuridine (BrdU) for the last 45 min of treatment after exposure to normoxia (21% O2) or hypoxia (0.5% O2) for 24 hr. Cells were fixed with ice cold 70%o ethanol and stained with propidium iodide (10 μg/ml) and Alexa Fluor-488 conjugated anti-BrdU antibody (Molecular Probes) and analyzed by flow cytometry (Becton Dickenson).
Statistical analysis
Results are average ± standard error of mean (S.E.) of 6–8 samples from 2 independent studies. Statistic analyses were done using two-tailed Student’s t test. Error bars represent standard error of the mean (S.E.). Statistical significance was defined as * and ⋄ P < 0.05, ** P < 0.01.
Supplementary Material
Supplementary Data 1. Supplement 1. Hypoxic regulation of mRNA translation.
(A–B) Serum replete Rh30 cells were exposed to 21% or 1.5% O2 for 0–20 hr, or 25 mM 2-DG (30 min) or 5 μg/ml tunicamycin (1.5 hr). Phosphorylation of 4EBP1 and rpS6 (A), or eIF2α and eEF2 (B) was determined. Phosphorylation of eIF2α was attenuated after 20 hr of low O2 in Rh30 cells, likely resulting from hypoxic regulation of the ATF4-GADD34-eIF2α loop (Blais et al., 2004).
(C–E) Serum replete (C and E) and serum-depleted (D) HEK293, HEK293T, and Rh30 cells were exposed to 21% or 1.5% O2 for 2–24 hr, or rapamycin (20 nM) and cycloheximide (50 μM) for 2 hr. 35S-Met labeling was carried out and examined by TCA precipitation (C) or gel electrophoresis (D–E).
(F) PERK mutation suppresses hypoxia-induced inhibition of protein synthesis.
PERK+/+ and PERK−/− MEFs were treated with 21% or 1.5% O2 for 48 hr. The percentages of protein translation relative to normoxia were determined by 35S-Met incorporation and TCA precipitation.
Supplementary Data 2. Supplement 2. mTOR inhibition can occur independent of HIF activity.
(A) HIF activity in ARNT+/+ and ARNT−/− MEFs. MEFs were transfected with wild-type or mutant HRE-Luc reporters. Expression of luciferase was examined after 16 hr exposure to 1.5% O2.
(B) ARNT−/− MEFs were pretreated with rapamycin (20 nM) or actinomycin D (5 μg/ml) for 30 min prior to exposure to 21% or 0.5% O2 for 1 hr. For the reoxygenation study, cells were returned to 21% O2 for 1 hr.
Supplementary Data 3. Supplement 3. Hypoxia activates AMPK.
(A–B) Serum replete HEK293 (A) and Rh30 (B) cells were exposed to 21% or 0.5% O2 for 0–48 hr, or treated with 25 mM 2-DG (30 min) or 5 μg/ml tunicamycin (1.5 hr). Cell extracts were examined for phosphorylation of AMPK, ACC, and eEF2.
(C–D) Levels of ADP/ATP in serum replete (C) and serum-depleted (D) HEK293 cells subjected to treatment of 2 or 20 hr 1.5% O2, 25 mM 2-DG (30 min), or 1 μM staurosporine (1 hr).
Supplementary Data 4. Supplement 4. TSC2 mutation greatly impedes hypoxic mTOR inhibition.
(A) Expression of TSC2 protein in TSC2+/+, p53−/− and TSC2−/−, p53−/− MEFs.
(B) TSC2+/+, p53−/− and TSC2−/−, p53−/− MEFs were exposed to 21% or 0.5% O2 for 0.5–20 hr.
Phosphorylation of 4EBP1, p70S6K, and rpS6 was measured by Western blot.
Acknowledgments
We thank Doug Lin for technical assistance. Special thanks to John Gordan, Bryan Barnhart, and Regina Young for thoughtful discussions and reading of the manuscript. This research was supported by National Institute of Health Grant PO1 CA 104838 and the Abramson Family Cancer Research Institute. MCS is an investigator of the Howard Hughes Medical Institute.
Abbreviation
ACC
Acetyl-coA carboxylase
AMPK
AMP-activated protein kinase
ARNT
Aryl hydrocarbon nuclear translocator
BrdU
Bromodeoxyuridine
2-DG
2-Deoxy-D-glucose
4EBP
eIF4E-binding protein
eEF2K
eEF2 kinase
FBS
Fetal bovine serum
GAP
GTPase activating protein
HIF
Hypoxia Inducible Factor
mTOR
Mammalian target of rapamycin
Met
Methionine
TCA
Trichloroacetic acid
TSC
Tuberous sclerosis complex
References
- Abraham RT. mTOR as a positive regulator of tumor cell responses to hypoxia. Curr Top Microbiol Immunol. 2004;279:299–319. doi: 10.1007/978-3-642-18930-2_18. [DOI] [PubMed] [Google Scholar]
- Arsham AM, Howell JJ, Simon MC. A novel hypoxia-inducible factor-independent hypoxic response regulating mammalian target of rapamycin and its targets. J Biol Chem. 2003;278:29655–29660. doi: 10.1074/jbc.M212770200. [DOI] [PubMed] [Google Scholar]
- Blais JD, Filipenko V, Bi M, Harding HP, Ron D, Koumenis C, Wouters BG, Bell JC. Activating transcription factor 4 is translationally regulated by hypoxic stress. Mol Cell Biol. 2004;24:7469–7482. doi: 10.1128/MCB.24.17.7469-7482.2004. [DOI] [PMC free article] [PubMed] [Google Scholar]
- Browne GJ, Finn SG, Proud CG. Stimulation of the AMP-activated protein kinase leads to activation of eukaryotic elongation factor 2 kinase and to its phosphorylation at a novel site, serine 398. J Biol Chem. 2004;279:12220–12231. doi: 10.1074/jbc.M309773200. [DOI] [PubMed] [Google Scholar]
- Brugarolas J, Lei K, Hurley RL, Manning BD, Reiling JH, Hafen E, Witters LA, Ellisen LW, Kaelin WG., Jr Regulation of mTOR function in response to hypoxia by REDD1 and the TSC1/TSC2 tumor suppressor complex. Genes Dev. 2004;18:2893–2904. doi: 10.1101/gad.1256804. [DOI] [PMC free article] [PubMed] [Google Scholar]
- Carling D. The AMP-activated protein kinase cascade--a unifying system for energy control. Trends Biochem Sci. 2004;29:18–24. doi: 10.1016/j.tibs.2003.11.005. [DOI] [PubMed] [Google Scholar]
- Clemens MJ. Initiation factor eIF2 alpha phosphorylation in stress responses and apoptosis. Prog Mol Subcell Biol. 2001;27:57–89. doi: 10.1007/978-3-662-09889-9_3. [DOI] [PubMed] [Google Scholar]
- Corradetti MN, Inoki K, Guan KL. The stress-inducted proteins RTP801 and RTP801L are negative regulators of the mammalian target of rapamycin pathway. J Biol Chem. 2005 doi: 10.1074/jbc.C400557200. [DOI] [PubMed] [Google Scholar]
- Dudkin L, Dilling MB, Cheshire PJ, Harwood FC, Hollingshead M, Arbuck SG, Travis R, Sausville EA, Houghton PJ. Biochemical correlates of mTOR inhibition by the rapamycin ester CCI-779 and tumor growth inhibition. Clin Cancer Res. 2001;7:1758–1764. [PubMed] [Google Scholar]
- Goda N, Ryan HE, Khadivi B, McNulty W, Rickert RC, Johnson RS. Hypoxia-inducible factor 1 alpha is essential for cell cycle arrest during hypoxia. Mol Cell Biol. 2003;23:359–369. doi: 10.1128/MCB.23.1.359-369.2003. [DOI] [PMC free article] [PubMed] [Google Scholar]
- Hardie DG, Scott JW, Pan DA, Hudson ER. Management of cellular energy by the AMP-activated protein kinase system. FEBS Lett. 2003;546:113–120. doi: 10.1016/s0014-5793(03)00560-x. [DOI] [PubMed] [Google Scholar]
- Harding HP, Zhang Y, Ron D. Protein translation and folding are coupled by an endoplasmic-reticulum-resident kinase. Nature. 1999;397:271–274. doi: 10.1038/16729. [DOI] [PubMed] [Google Scholar]
- Hochachka PW, Buck LT, Doll CJ, Land SC. Unifying theory of hypoxia tolerance: molecular/metabolic defense and rescue mechanisms for surviving oxygen lack. Proc Natl Acad Sci U S A. 1996;93:9493–9498. doi: 10.1073/pnas.93.18.9493. [DOI] [PMC free article] [PubMed] [Google Scholar]
- Horman S, Browne G, Krause U, Patel J, Vertommen D, Bertrand L, Lavoinne A, Hue L, Proud C, Rider M. Activation of AMP-Activated Protein Kinase Leads to the Phosphorylation of Elongation Factor 2 and an Inhibition of Protein Synthesis. Curr Biol. 2002;12:1419. doi: 10.1016/s0960-9822(02)01077-1. [DOI] [PubMed] [Google Scholar]
- Howe SR, Gottardis MM, Everitt JI, Goldsworthy TL, Wolf DC, Walker C. Rodent model of reproductive tract leiomyomata. Establishment and characterization of tumor-derived cell lines. Am J Pathol. 1995;146:1568–1579. [PMC free article] [PubMed] [Google Scholar]
- Inoki K, Li Y, Zhu T, Wu J, Guan KL. TSC2 is phosphorylated and inhibited by Akt and suppresses mTOR signalling. Nat Cell Biol. 2002;4:648–657. doi: 10.1038/ncb839. [DOI] [PubMed] [Google Scholar]
- Inoki K, Zhu T, Guan KL. TSC2 mediates cellular energy response to control cell growth and survival. Cell. 2003;115:577–590. doi: 10.1016/s0092-8674(03)00929-2. [DOI] [PubMed] [Google Scholar]
- Jijakli H, Nadi AB, Cook L, Best L, Sener A, Malaisse WJ. Insulinotropic action of methyl pyruvate: enzymatic and metabolic aspects. Arch Biochem Biophys. 1996;335:245–257. doi: 10.1006/abbi.1996.0505. [DOI] [PubMed] [Google Scholar]
- Jones RG, Plas DR, Kubek S, Buzzai M, Mu J, Xu Y, Birnbaum MJ, Thompson CB. AMP-Activated Protein Kinase Induces a p53-Dependent Metabolic Checkpoint. Mol Cell. 2005;18:283–293. doi: 10.1016/j.molcel.2005.03.027. [DOI] [PubMed] [Google Scholar]
- Koumenis C, Naczki C, Koritzinsky M, Rastani S, Diehl A, Sonenberg N, Koromilas A, Wouters BG. Regulation of protein synthesis by hypoxia via activation of the endoplasmic reticulum kinase PERK and phosphorylation of the translation initiation factor eIF2alpha. Mol Cell Biol. 2002;22:7405–7416. doi: 10.1128/MCB.22.21.7405-7416.2002. [DOI] [PMC free article] [PubMed] [Google Scholar]
- Kraggerud SM, Sandvik JA, Pettersen EO. Regulation of protein synthesis in human cells exposed to extreme hypoxia. Anticancer Res. 1995;15:683–686. [PubMed] [Google Scholar]
- Kwiatkowski DJ. Tuberous sclerosis: from tubers to mTOR. Ann Hum Genet. 2003;67:87–96. doi: 10.1046/j.1469-1809.2003.00012.x. [DOI] [PubMed] [Google Scholar]
- Lang KJ, Kappel A, Goodall GJ. Hypoxia-inducible Factor-1 alpha mRNA Contains an Internal Ribosome Entry Site That Allows Efficient Translation during Normoxia and Hypoxia. Mol Biol Cell. 2002;13:1792–1801. doi: 10.1091/mbc.02-02-0017. [DOI] [PMC free article] [PubMed] [Google Scholar]
- Li Y, Corradetti MN, Inoki K, Guan KL. TSC2: filling the GAP in the mTOR signaling pathway. Trends Biochem Sci. 2004a;29:32–38. doi: 10.1016/j.tibs.2003.11.007. [DOI] [PubMed] [Google Scholar]
- Li Y, Inoki K, Guan KL. Biochemical and functional characterizations of small GTPase Rheb and TSC2 GAP activity. Mol Cell Biol. 2004b;24:7965–7975. doi: 10.1128/MCB.24.18.7965-7975.2004. [DOI] [PMC free article] [PubMed] [Google Scholar]
- Liu L, Simon MC. Regulation of transcription and translation by hypoxia. Cancer Biol Ther. 2004;3:492–497. doi: 10.4161/cbt.3.6.1010. [DOI] [PubMed] [Google Scholar]
- Loreni F, Thomas G, Amaldi F. Transcription inhibitors stimulate translation of 5′ TOP mRNAs through activation of S6 kinase and the mTOR/FRAP signalling pathway. Eur J Biochem. 2000;267:6594–6601. doi: 10.1046/j.1432-1327.2000.01753.x. [DOI] [PubMed] [Google Scholar]
- Ma L, Chen Z, Erdjument-Bromage H, Tempst P, Pandolfi PP. Phosphorylation and functional inactivation of TSC2 by Erk implications for tuberous sclerosis and cancer pathogenesis. Cell. 2005;121:179–193. doi: 10.1016/j.cell.2005.02.031. [DOI] [PubMed] [Google Scholar]
- Manning BD, Cantley LC. Rheb fills a GAP between TSC and TOR. Trends Biochem Sci. 2003;28:573–576. doi: 10.1016/j.tibs.2003.09.003. [DOI] [PubMed] [Google Scholar]
- Mu J, Brozinick JT, Jr, Valladares O, Bucan M, Birnbaum MJ. A role for AMP-activated protein kinase in contraction- and hypoxia-regulated glucose transport in skeletal muscle. Mol Cell. 2001;7:1085–1094. doi: 10.1016/s1097-2765(01)00251-9. [DOI] [PubMed] [Google Scholar]
- Patel J, McLeod LE, Vries RG, Flynn A, Wang X, Proud CG. Cellular stresses profoundly inhibit protein synthesis and modulate the states of phosphorylation of multiple translation factors. Eur J Biochem. 2002;269:3076–3085. doi: 10.1046/j.1432-1033.2002.02992.x. [DOI] [PubMed] [Google Scholar]
- Potter CJ, Huang H, Xu T. Drosophila Tsc1 functions with Tsc2 to antagonize insulin signaling in regulating cell growth, cell proliferation, and organ size. Cell. 2001;105:357–368. doi: 10.1016/s0092-8674(01)00333-6. [DOI] [PubMed] [Google Scholar]
- Reiling JH, Hafen E. The hypoxia-induced paralogs Scylla and Charybdis inhibit growth by down-regulating S6K activity upstream of TSC in Drosophila. Genes Dev. 2004;18:2879–2892. doi: 10.1101/gad.322704. [DOI] [PMC free article] [PubMed] [Google Scholar]
- Schmaltz C, Hardenbergh PH, Wells A, Fisher DE. Regulation of proliferation-survival decisions during tumor cell hypoxia. Mol Cell Biol. 1998;18:2845–2854. doi: 10.1128/mcb.18.5.2845. [DOI] [PMC free article] [PubMed] [Google Scholar]
- Schmelzle T, Hall MN. TOR, a central controller of cell growth. Cell. 2000;103:253–262. doi: 10.1016/s0092-8674(00)00117-3. [DOI] [PubMed] [Google Scholar]
- Schwarzer R, Tondera D, Arnold W, Giese K, Klippel A, Kaufmann J. REDD1 integrates hypoxia-mediated survival signaling downstream of phosphatidylinositol 3-kinase. Oncogene. 2005;24:1138–1149. doi: 10.1038/sj.onc.1208236. [DOI] [PubMed] [Google Scholar]
- Tapon N, Ito N, Dickson BJ, Treisman JE, Hariharan IK. The Drosophila tuberous sclerosis complex gene homologs restrict cell growth and cell proliferation. Cell. 2001;105:345–355. doi: 10.1016/s0092-8674(01)00332-4. [DOI] [PubMed] [Google Scholar]
- Tee AR, Blenis J. mTOR, translational control and human disease. Semin Cell Dev Biol. 2005;16:29–37. doi: 10.1016/j.semcdb.2004.11.005. [DOI] [PubMed] [Google Scholar]
- Wouters BG, van den Beucken T, Magagnin MG, Koritzinsky M, Fels D, Koumenis C. Control of the hypoxic response through regulation of mRNA translation. Semin Cell Dev Biol. 2005 doi: 10.1016/j.semcdb.2005.03.009. [DOI] [PubMed] [Google Scholar]
- Yeung RS. Lessons from the Eker rat model: from cage to bedside. Curr Mol Med. 2004;4:799–806. doi: 10.2174/1566524043359791. [DOI] [PubMed] [Google Scholar]
Associated Data
This section collects any data citations, data availability statements, or supplementary materials included in this article.
Supplementary Materials
Supplementary Data 1. Supplement 1. Hypoxic regulation of mRNA translation.
(A–B) Serum replete Rh30 cells were exposed to 21% or 1.5% O2 for 0–20 hr, or 25 mM 2-DG (30 min) or 5 μg/ml tunicamycin (1.5 hr). Phosphorylation of 4EBP1 and rpS6 (A), or eIF2α and eEF2 (B) was determined. Phosphorylation of eIF2α was attenuated after 20 hr of low O2 in Rh30 cells, likely resulting from hypoxic regulation of the ATF4-GADD34-eIF2α loop (Blais et al., 2004).
(C–E) Serum replete (C and E) and serum-depleted (D) HEK293, HEK293T, and Rh30 cells were exposed to 21% or 1.5% O2 for 2–24 hr, or rapamycin (20 nM) and cycloheximide (50 μM) for 2 hr. 35S-Met labeling was carried out and examined by TCA precipitation (C) or gel electrophoresis (D–E).
(F) PERK mutation suppresses hypoxia-induced inhibition of protein synthesis.
PERK+/+ and PERK−/− MEFs were treated with 21% or 1.5% O2 for 48 hr. The percentages of protein translation relative to normoxia were determined by 35S-Met incorporation and TCA precipitation.
Supplementary Data 2. Supplement 2. mTOR inhibition can occur independent of HIF activity.
(A) HIF activity in ARNT+/+ and ARNT−/− MEFs. MEFs were transfected with wild-type or mutant HRE-Luc reporters. Expression of luciferase was examined after 16 hr exposure to 1.5% O2.
(B) ARNT−/− MEFs were pretreated with rapamycin (20 nM) or actinomycin D (5 μg/ml) for 30 min prior to exposure to 21% or 0.5% O2 for 1 hr. For the reoxygenation study, cells were returned to 21% O2 for 1 hr.
Supplementary Data 3. Supplement 3. Hypoxia activates AMPK.
(A–B) Serum replete HEK293 (A) and Rh30 (B) cells were exposed to 21% or 0.5% O2 for 0–48 hr, or treated with 25 mM 2-DG (30 min) or 5 μg/ml tunicamycin (1.5 hr). Cell extracts were examined for phosphorylation of AMPK, ACC, and eEF2.
(C–D) Levels of ADP/ATP in serum replete (C) and serum-depleted (D) HEK293 cells subjected to treatment of 2 or 20 hr 1.5% O2, 25 mM 2-DG (30 min), or 1 μM staurosporine (1 hr).
Supplementary Data 4. Supplement 4. TSC2 mutation greatly impedes hypoxic mTOR inhibition.
(A) Expression of TSC2 protein in TSC2+/+, p53−/− and TSC2−/−, p53−/− MEFs.
(B) TSC2+/+, p53−/− and TSC2−/−, p53−/− MEFs were exposed to 21% or 0.5% O2 for 0.5–20 hr.
Phosphorylation of 4EBP1, p70S6K, and rpS6 was measured by Western blot.