Variety of genomic DNA patterns for nucleosome positioning (original) (raw)
Abstract
Precise positioning of nucleosomes along DNA is important for a variety of gene regulatory processes. Among the factors directing nucleosome positioning, the DNA sequence is highly important. Two main classes of nucleosome positioning sequence (NPS) patterns have previously been described. In the first class, AA, TT, and other WW dinucleotides (where W is A or T) tend to occur together (in-phase) in the major groove of DNA closest to the histone octamer surface, while SS dinucleotides (where S is G or C) are predominantly positioned in the major groove facing outward. In the second class, AA and TT are structurally separated (AA backbone near the histone octamer, and TT backbone further away), but grouped with other RR (where R is purine A or G) and YY (where Y is pyrimidine C or T) dinucleotides. As a result, the RR/YY pattern includes counter-phase AA/TT distributions. We describe here anti-NPS patterns, which are inverse to the conventional NPS patterns: WW runs inverse to SS, and RR inverse to YY. Evidence for the biological relevance of anti-NPS patterns is presented.
It is commonly recognized that nucleosomes serve not just as a mere DNA packing device but also as part of various regulatory schemes in which their precise positioning along the DNA molecule is important. Many _cis_- and _trans_-acting factors that may direct positioning of a histone octamer have been suggested and studied (Simpson 1991; Thoma 1992; Lu et al. 1994; Wolffe 1994; Radman-Livaja and Rando 2009; Segal and Widom 2009b). It is frequently assumed that the underlying DNA sequence plays an important role in defining some fraction of nucleosome positions across a genome. Several rather different nucleosome DNA sequence patterns have been suggested (Mengeritsky and Trifonov 1983; Zhurkin 1983; Drew and Travers 1985; Calladine and Drew 1986; Satchwell et al. 1986; Uberbacher et al. 1988; Ioshikhes et al. 1992; Baldi et al. 1996; Ioshikhes et al. 1996; Lowary and Widom 1998; Kogan et al. 2006; Segal et al. 2006; Albert et al. 2007; Salih et al. 2007; Mavrich et al. 2008a). The observation of the periodical appearance of some dinucleotides, primarily AA and TT, along eukaryotic DNA sequences with a period close to that of the DNA helical repeat (∼10 bp) was long ago spelled out as a nucleotide sequence pattern that may facilitate anisotropic DNA bendability and nucleosome formation (Trifonov and Sussman 1980). More recent studies have built on this finding to show that this periodicity may be somewhat disrupted in the central part of the nucleosome, around its dyad (see, e.g., Ioshikhes et al. 1996; Albert et al. 2007; Travers et al. 2009). An alternative class of DNA sequence signals, such as poly(dA:dT) tracts, may help position nucleosomes by exclusion, shifting them away from such motifs, so they are sometimes called anti-positioning signals (Iyer and Struhl 1995; Mavrich et al. 2008a; Segal and Widom 2009a).
Nucleosome positioning sequence (NPS) patterns may be used for nucleosome mapping in silico (Ioshikhes et al. 2006; Segal et al. 2006; Mavrich et al. 2008a,b), but the accuracy of the mapping on the genomic scale has so far been rather limited. One study reported successful prediction of ∼50% of experimental nucleosome positions with a resolution of 35 bp, in which ∼39% were expected by chance (Segal et al. 2006). Accordingly, another 50% evaded such mapping. Subsequent attempts were directed at computational nucleosome mapping using optimization of nucleosome/linker discrimination based on respective ROC curves (Peckham et al. 2007; Chung and Vingron 2009). Although such approaches provide better discrimination rates compared to previous algorithms, it is not clear how successful they were in terms of prediction of nucleosome positions: Neither study reported a larger percentage of the nucleosome positions mapped with better resolution compared to earlier studies. Hence, the use of NPS-based mapping may still lead to better nucleosome prediction if additional sequence information could be explored. Here we describe novel positioning patterns and compare them with the patterns previously described (Ioshikhes et al. 1996; Segal et al. 2006; Albert et al. 2007; Mavrich et al. 2008a).
WW/SS and RR/YY classes of NPS patterns
Certain dinucleotides such as AA or TT make DNA more bendable. Since DNA must bend as it wraps around a histone octamer to form a nucleosome, such dinucleotides and other bendable sequence motifs promote nucleosome formation. Since the bend is directional, any ∼10-bp periodical placement of AA/TT dinucleotides in-phase with the helical twist of DNA would be cooperative for nucleosome formation. Periodic AA and TT dinucleotides are thought to contribute to nucleosome formation, at least in some species such as yeast. Hence we focus on their distributions in nucleosomal DNA in this study.
Despite a variety of nucleosomal DNA sequence patterns, they generally may be divided into two distinct dinucleotide classes, which we refer to here as WW/SS and RR/YY (W = A or T; S = G or C; R = A or G; Y = C or T). The WW/SS class reflects stiff but intrinsically curved DNA (Drew and Travers 1985; Satchwell et al. 1986; Lowary and Widom 1998; Segal et al. 2006), whereas the RR/YY class reflects flexible but not intrinsically curved DNA (Mengeritsky and Trifonov 1983; Ioshikhes et al. 1992; Ioshikhes et al. 1996; Ioshikhes et al. 2006; Mavrich et al. 2008a). Both would favor nucleosome formation but through distinct physical properties of the DNA. Below we describe these classes in more detail, focusing primarily on AA and TT as predominant dinucleotide contributors to nucleosome formation.
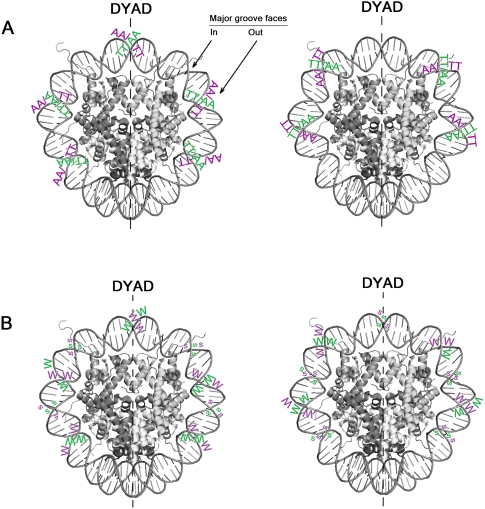
In the WW/SS class, AA and TT dinucleotides are distributed in the same phase in their positions along nucleosomal DNA sequence. Thus, in a population of nucleosomal sequences, either AA or TT may be found at a given distance from the nucleosome dyad (Supplemental Fig. 1). Structurally that means that AA and TT have similar rotational positions with respect to the histone surface (Fig. 1A, left panel). The more general case of WW/SS is presented in Figure 1B (left panel). AA (or TT) at the dyad has its major groove facing toward the histone surface. Flanking the dyad, a phase change of WW and SS occurs (for detailed review, see Travers et al. 2009; see also Ioshikhes et al. 1996; Albert et al. 2007). This may lead to a local disruption of the 10-bp dinucleotide periodicity in this area, as reflected in Figures 1 and 2 (see also the central part of the measured WW dinucleotide distribution on nucleosomal DNA in Fig. 3). In regions flanking the dyad, periodic AA (or TT) has its major groove facing outward (Fig. 1A). Albert et al. (2007) have presented a dinucleotide pattern that is consistent with the general WW/SS case (Fig. 1B, left panel), although differing in WW/SS placement around the dyad compared to Travers et al. (2010). Trifonov (2010) switches positions of WW and SS dinucleotides in the flanking regions in his model of the canonical WW/SS pattern. For either model, such dinucleotide positioning should be related to intrinsically and persistently curved DNA segments (Drew and Travers 1985; Cohanim et al. 2006), and the periodicity of ∼10 bp would further augment nucleosome stability.
Figure 1.
Spatial presentation of the various AA, TT nucleosome DNA sequence patterns (scheme). (A) Specific example of AA (or TT). (Left panel) The pattern described by Albert et al. (2007). (Right panel) The “anti” configuration. Note, AA or TT at each indicated position on each strand is allowable. (B) The general case from panel A is shown. Smaller letters for SS indicate a small contribution. The patterns are shown only in the area close to the dyad.
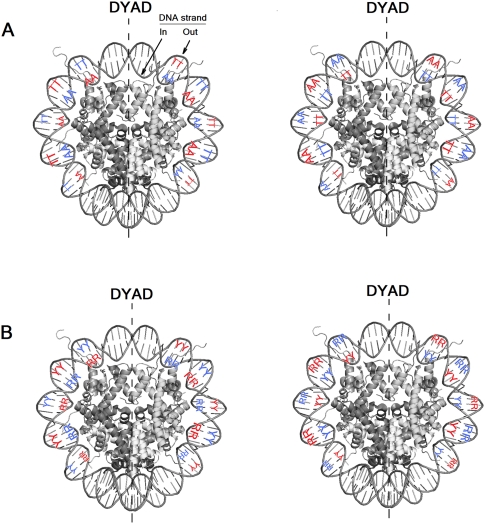
Figure 2.
Spatial presentation of the various nucleosome DNA sequence patterns (scheme). (A) Counter-phase AA/TT (left) and anti-AA/TT (right) patterns. (B) RR/YY (left) and anti-RR/YY (right) patterns. The variable size of the letters reflects variable peak magnitude of respective dinucleotide distributions at subsequent figures (no precise scale was kept). The patterns are shown only in the area close to the dyad.
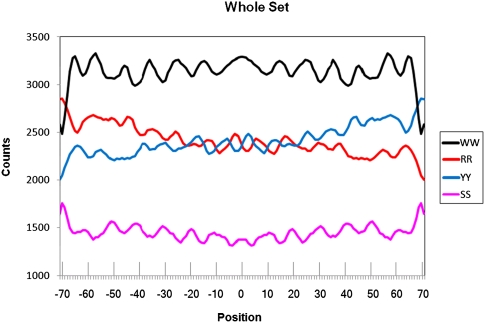
Figure 3.
Counts for combined dinucleotide distributions (smoothed by 3-points sliding average) for the well-phased H2A.Z nucleosomes used as a training set (according to Albert et al. 2007). Positions are for the aligned nucleosome DNA sequences. Position 0 coincides with the dyad symmetry of the nucleosome. Normalized frequency distributions can be found in Supplemental Figure 2.
In the RR/YY class of nucleosomal sequences patterns, AA and TT dinucleotides are counter-phase in their positional distributions (Fig. 2A, left panel). Thus, when there is AA on one side of the dyad, there likely is symmetrical to it TT (but not AA) on the opposite side, and vice versa (Supplemental Fig. 1). These patterns are dyad-symmetrical to each other but not self-symmetrical. As a result, the AA distribution maxima coincide with the minima of TT, and vice versa. Structurally this is related to preferential separation of these dinucleotides with respect to the surface of the histone octamer: The AA dinucleotides backbone is preferentially located on the histone octamer surface, while the TT backbone is located furthest from the surface (Fig. 2A, left panel), which is consistent with the geometric properties of AA and TT (Salih et al. 2007). In the general case, the RR backbone is located on the histone surface, while the YY backbone is furthest from the surface (Fig. 2B, left panel).
In contrast to the intrinsically curved but stiff WW/SS pattern, the RR/YY class of patterns is related to relatively flexible DNA, with relatively moderate intrinsic curvature, but able to wind relatively easily around the histone octamer (Salih et al. 2007). Note that AA/TT patterns differ in the WW/SS versus RR/YY classes (cf. Figs. 1A and 2A), and so we will refer to the WW/SS class as “in-phase AA/TT,” and the RR/YY class as “counter-phase AA/TT.”
Kogan et al. (2006) report that a 10.4-bp periodicity of GG and CC dinucleotides distributed along nucleosome DNA sequences contribute to nucleosome positioning in human cells. Mavrich et al. (2008b) demonstrated that nucleosome positions in Drosophila may be mapped better by CC and GG patterns over those by other dinucleotides. These patterns have CC and GG separated on the sequence and structure level consistent with the patterns of the RR/YY class. Rapoport et al. (2011) provided a comprehensive study of the periodical distributions of sequence elements, thought to be related to nucleosome positioning in 13 different species. Their positioning regarding the nucleosome surface is consistent with the RR/YY and WW/SS classes described here or combinations thereof (Trifonov 2010). Since nucleosome organization has been studied most extensively in Saccharomyces, we use nucleosomal sequences in this species as a study system for our analyses. We expect that our main conclusions should hold for other species as well, since positioning of nucleosome sequence elements in other species is consistent with the two major patterns (WW/SS and RR/YY) described to date. Nonetheless, further studies on other species would directly test this assumption.
WW/SS and RR/YY NPS patterns are represented in comparable portions along the yeast genome (Cohanim et al. 2006), suggesting that both patterns may be used to a similar extent to form nucleosomes. In addition, we also consider the possibility of anti-NPS patterns, where the dinucleotide positioning pattern appears inverse to that of NPS. Anti-NPS patterns are illustrated in the right panels of Figures 1 and 2. Anti-NPS patterns have their major dinucleotide components flipped compared to the NPS patterns, both at the level of structure and sequence. As such, preferential positions for SS in the anti-WW/SS patterns are equivalent to those for WW in the regular WW/SS pattern, and vice versa (Fig. 1B, cf. left and right panels). The same is true for preferential positions for RR and YY in the RR/YY and anti-RR/YY patterns (Fig. 2B, cf. right and left panels). As explained below, the anti-RR/YY pattern leads to higher correlations of the anti-NPS patterns to nucleosomal sequences in genomic regions where regular NPS patterns are less effective. To search for anti-NPS patterns, we focused on some of the best-positioned nucleosomes in the yeast genome, which tend to be those that surround promoters and contain H2A.Z (Albert et al. 2007; http://atlas.bx.psu.edu/yeast-maps/yeast-index.html). Such nucleosomes tend to be well-positioned and thus more likely to have sequence features relevant to their position. Importantly, they were not pre-selected to have correlations with any NPS pattern. We explore the possibility that anti-NPS patterns, particularly those that surround promoter regions, may be responsible for sequence-related positioning at those nucleosomes that evade mapping by known NPS patterns.
Results
Natural NPS patterns are a mixture of WW/SS and RR/YY classes
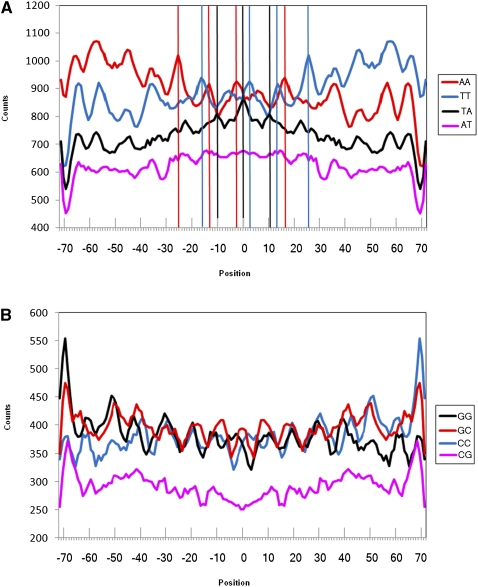
Unlike the DNA recognition sequences of transcription factors, the representation of the NPS patterns at any given nucleosomal sequence is subtle and diffusely distributed across about 150 bp of nucleosomal DNA. The entirety of any one composite pattern illustrated in Figure 1 or 2 may not exist in any one nucleosomal sequence (as illustrated in Supplemental Fig. 1). This may partially explain the variety of NPS patterns published to date. The distribution of WW/SS and RR/YY for those nucleosomal sequences described by Albert et al. (2007) is presented in Figure 3. Examination of the individual AA and TT distributions shows that these distributions actually are not in the same phase (Fig. 4A), in particular across the central 50 bp of the nucleosomal sequences.
Figure 4.
Counts of individual dinucleotides along nucleosomal DNA for the studied nucleosomes from Albert et al. (2007). (A) Individual WW dinucleotides. (B) Individual SS dinucleotides. Vertical lines are drawn through the peaks for AA, TT, and AT dinucleotides that are clearly out of phase.
How then do WW dinucleotides, when taken as a composite, generate periodical and symmetrical patterns (Fig. 3), whereas their component dinucleotide patterns are neither self-symmetrical nor clearly periodical (Fig. 4A)? One potential explanation is that AA and TT distributions contain components that are in-phase with distributions of other respective WW dinucleotides (i.e., with each other, AT and TA). This would create the periodical pattern in the composite WW plot. The same is true for SS dinucleotides (Fig. 4B). Composite WW or SS plots enhance the in-phase components of respective dinucleotide distributions. Similarly, by combining all dinucleotide distributions of RR or YY, we enhance the in-phase components for them, thereby producing the composite RR/YY pattern (Fig. 3). As a consequence, RR and YY components are in opposite phases to each other, as are also WW and SS. These patterns should be periodical by ∼10 bp. Both WW/SS (Albert et al. 2007) and RR/YY (Ioshikhes et al. 1996) patterns were shown to be periodical along most of the nucleosomal DNA. Although this periodicity is generally observed for the nucleosomes studied here (see Fourier distributions in Supplemental Fig. 3), RR/YY are periodical by ∼10 bp only in the very central part of the composite graph for the considered nucleosomes (Fig. 3; Albert et al. 2007). In contrast, the WW/SS pattern demonstrates the periodicity over most of the nucleosome length.
One possible explanation for why the RR/YY periodicity appears to be restricted to nucleosomal dyad regions, whereas the WW/SS pattern is more distributed (Fig. 3), may be the existence of a WW/SS pattern (with in-phase AA/TT) that is superimposed with RR/YY. That may be the case if a larger portion of the nucleosomal sequences uses the WW/SS pattern, while a smaller fraction uses the RR/YY pattern. Hence, one may expect that the majority of nucleosomes would have a positive correlation with the WW/SS pattern. From those with a negative correlation to the WW/SS pattern, many may follow the RR/YY pattern instead.
This gives a rationale for a preliminary separation of the patterns: AA dinucleotide distributions of the RR pattern should be in opposite phase to those of the WW pattern in some of the nucleosomes. Hence, we may expect a clearer picture of the different patterns if we separate the nucleosomal sequences according to different possible phases of AA or TT. The implementation of this idea is described in the following section.
Anti-NPS patterns are widespread
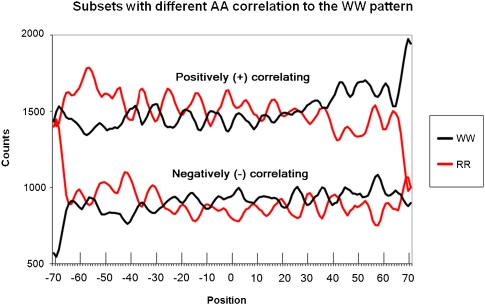
To elucidate the WW/SS (including in-phase AA/TT) and RR/YY (including counter-phase AA/TT) patterns independently, we separated H2A.Z-containing nucleosomal sequences (Albert et al. 2007) into 5718 sequences in which the distribution of AA dinucleotides had a positive correlation to the WW pattern, and 3422 had a negative correlation (see Eq. 1 in Methods). The black traces in Figure 5 display the WW dinucleotide distribution for both sets. RR distributions were also examined (red traces in Fig. 5). As expected, the WW and RR patterns for the same subsets were in opposite phases. Remarkably, separation of the nucleosomal sequences into the positively and negative correlating subsets led to a clearer periodicity of ∼10 bp for all dinucleotide combinations considered (see respective Fourier spectra in Supplemental Fig. 3).
Figure 5.
Combined dinucleotide distributions (smoothed by 3 points) for subsets with AAs positively correlating with the major WW pattern from Albert et al. (2007) (+, higher in the graph) and with AAs negatively correlating with the major WW pattern (−, lower in the graph).
Much more surprising was the existence of well-pronounced opposite phasing counterparts for both conventional WW and RR patterns (Fig. 5, cf. WW+ with WW− and RR+ with RR−). We refer to the patterns attained from the negatively correlating sequences as anti-WW and anti-RR. As these nucleosomal sequences were not pre-selected to have correlations with any of the NPS patterns, it is quite surprising that a significant fraction of them showed the anti-correlation. To our knowledge, this represents the first description of anti-NPS patterns that are used by a substantial fraction of experimentally determined nucleosomes.
The analysis of AA distributions in H2A.Z nucleosomal sequences thus far revealed known NPS patterns as well as anti-NPS patterns. We were therefore prompted to directly examine the positive versus negative correlations of individual nucleosome sequences with the in-phase and counter-phase AA/TT patterns.
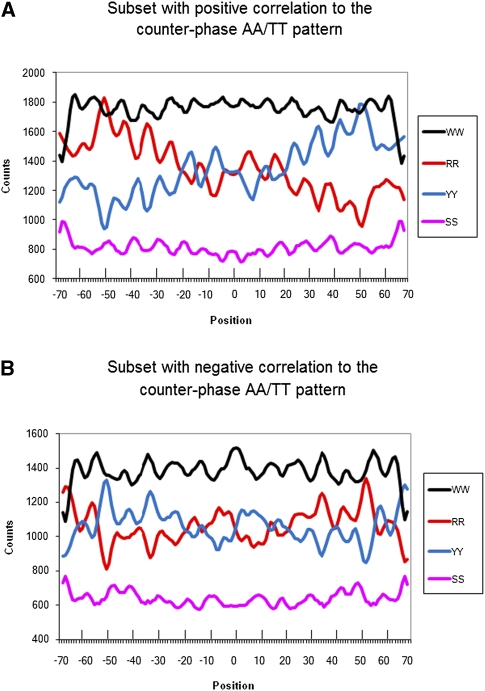
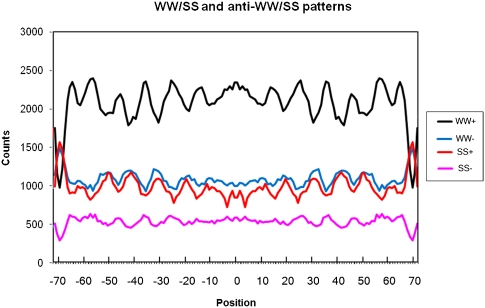
We divided the entire nucleosome set into two subsets based on dinucleotide correlation with each of the major patterns: (1) as shown in Figure 6, those with positive (Fig. 6A) and negative (Fig. 6B) correlations to the counter-phase AA/TT pattern from Ioshikhes et al. (1996), using Equation 2, described in the Methods; and (2) as shown in Figure 7, those with positive and negative correlation to the WW/SS pattern from Albert et al. (2007), using Equation 3.
Figure 6.
Combined dinucleotide distributions (smoothed by 3) for nucleosome subsets with positive (A) and negative (B) AA/TT correlation to the counter-phase AA/TT pattern from Ioshikhes et al. (1996). Notice opposite phases for RR patterns at A and B, for YY patterns at A and B, and steep gradients for RR and WW patterns at A (no obvious gradients at B). The opposite phases for the patterns in the A and B panels are related to inverse positioning of respective sequence elements in conventional (major) patterns and respective anti-patterns (presented in Fig. 2, left and right sides, respectively).
Figure 7.
WW and SS patterns (smoothed by 3) for subsets with positive (+) and negative (−) WW/SS correlation to the major WW/SS patterns from Albert et al. (2007). Notice identical phases for the WW− and SS+ and for the WW+ and SS− patterns.
In Figure 6, both the regular and anti-RR and YY patterns were very well pronounced. The patterns for sequences with positive correlation to the counter-phase AA/TT are highly consistent with the counter-phase pattern, with RR and YY in opposite phases to each other (Fig. 6A, cf. RR and YY), which is expected. Consistent with expectations from the previous section, WW and SS patterns are relatively weak for this subset (Fig. 6A). The patterns for the sequences having a negative correlation to the counter-phase AA/TT pattern were also clear (Fig. 6B, see RR and YY). The magnitude of the dinucleotide distributions in the latter sequences is clearly above the random level, which is rather surprising. The WW/SS pattern is better pronounced for these sequences. A subset of 5107 sequences from the entire sequence set of 9140 (for details, see Methods) showed positive correlation to the counter-phase AA/TT pattern (Ioshikhes et al. 1996), while 4033 sequences showed negative correlation. The respective ratio of the number of NPS/anti-NPS nucleosomes (i.e., those with positive and negative correlation to the counter-phase AA/TT pattern) is ∼5/4 = 1.25. The statistical significance of the separation by the chi-square test is almost 8 StD (p < 0.0001), i.e., extremely high if the number of members in each group is compared with those randomly expected (50% or 4570). Yet the most intriguing finding of our study is that the number of nucleosomes described by an anti-NPS pattern is almost as high as the number obtained by the standard NPS pattern, which almost doubles the number of predictable nucleosomes.
We next parsed the H2A.Z nucleosomal sequences according to their positive or negative correlation to the WW/SS pattern of (Albert et al. 2007), as defined by Equation 3 described in Methods. This resulted in clear WW/SS and anti-WW/SS patterns (Fig. 7): WW(+), SS(+), and WW(−), SS(−), respectively, as reported in Supplemental Material 2. Of these, 6030 sequences were related to the WW/SS, and 3110 were related to the anti-WW/SS pattern, with the NPS/anti-NPS ratio being ∼2:1 (22 Std Dev; p < 0.0001).
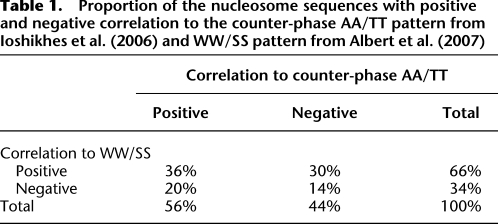
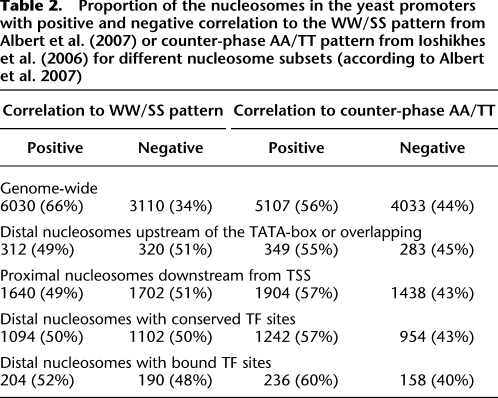
Tables 1 and 2 provide proportions of the total number of the nucleosomes split into the different subsets, according to the correlation with RR/YY and WW/SS patterns as calculated above. As seen from Table 1, 50% of the nucleosomal sequences conform to either the WW/SS or RR/YY patterns, whereas 14% conform to neither. Supplemental Figure 4 presents histogram distributions of the correlation levels of the individual nucleosomes with the counter-phase AA/TT pattern from Ioshikhes et al. (1996) (Supplemental Fig. 4, top panel) and the WW pattern from Albert et al. (2007) (Supplemental Fig. 4, bottom panel). As may be seen from the histograms, magnitudes of the positive and negative correlations are overall comparable. Hence, the contributions of the anti-patterns to nucleosome formation are similar to those of the conventional patterns.
Table 1.
Proportion of the nucleosome sequences with positive and negative correlation to the counter-phase AA/TT pattern from Ioshikhes et al. (2006) and WW/SS pattern from Albert et al. (2007)
Table 2.
Proportion of the nucleosomes in the yeast promoters with positive and negative correlation to the WW/SS pattern from Albert et al. (2007) or counter-phase AA/TT pattern from Ioshikhes et al. (2006) for different nucleosome subsets (according to Albert et al. 2007)
While the existence of the canonical WW/SS and RR/YY patterns in the H2A.Z nucleosomal sequence set is somewhat expected, the existence of the “anti” patterns (both anti-WW/SS and anti-RR/YY) is a novel finding. Further examination of the WW/SS and anti-WW/SS patterns shows that, even though these patterns have the same periodicity (∼10 bp) while being in opposite phases, they are genuinely different patterns that cannot be interconverted by simply shifting one of the patterns by half of the period (5 bp). Thus, experimental mapping uncertainty of nucleosome positions, for example, by 5 bp, would alter potential alignments but not produce an altered pattern. Indeed, the ∼10-bp dinucleotide periodicity is disrupted in the central part of the nucleosome (around its dyad), so a shift of either pattern by 5 bp could not result in its anti-counterpart. The same is true for the RR/YY and anti-RR/YY patterns. The high amplitudes of the patterns mean that they both are relatively well pronounced on their respective nucleosome subsets. If the canonical WW/SS and RR/YY patterns are related to stable nucleosome structures, their “anti” counterparts appear opposite to them and thus may be related to relatively unstable nucleosome structures (Figs. 1, 2, right panels) and genomic regions harboring unstable nucleosomes.
Structural implications of WW/SS and RR/YY patterns
Conceivably, the four NPS patterns presented here (Fig. 2) might be related to nucleosomes of different stability. The WW/SS pattern (Fig. 1, left panel) defined by Segal et al. (2006) and Albert et al. (2007), or as depicted in the right panel of Figure 1 according to Trifonov (2010), may be the most stable structure. This arrangement would involve intrinsically curved DNA that may promote nucleosome formation (Drew and Travers 1985; Anselmi et al. 2000). The WW/SS class of nucleosomal DNA is relatively stiff but intrinsically curved, and nucleosomes containing such DNA should be relatively stable. Its DNA is analogous to an aluminum wire wrapped around a pencil: Its shape persists when the pencil is removed, and the pencil may fit back into it. However, rigid DNA of a different shape [e.g., those containing poly(dA:dT) tracts] would rather preclude nucleosome formation in that it would be energetically unfavorable to bend it around the histone octamer.
On the other hand, the RR/YY pattern (Fig. 2, left) relates to nucleosomes that have lower intrinsic curvature but higher bendability. Its DNA rather resembles thread wrapped around the pencil: It may be easily wrapped around (high bendability), but its shape does not persist when the pencil is removed (no intrinsic curvature). The rotational positioning of the YY backbone further from the octamer surface compared to RR in such nucleosomes may be explained by the lower energy of stacking interaction between pyrimidines versus purines (Trifonov 1985; Salih et al. 2007) that favors DNA bending in the direction of the inward facing RR backbone (Trifonov 1985). DNA in such nucleosomes may be easier to wind/unwind around a histone octamer, yet it would not preserve its curvature in nucleosome-free DNA. These nucleosomes are less stable and may be more easily displaced, which may be beneficial for the nucleosomes around transcription start sites, TATA-boxes, and other promoter elements. Indeed, our computational mapping of nucleosome positioning (Ioshikhes et al. 2006) by the counter-phase AA/TT pattern (AA/TT component of the RR/YY pattern discussed here) (Ioshikhes et al. 1996) in combination with a comparative genomics approach (Ioshikhes et al. 2006) was significantly more successful for yeast promoters than mapping by WW/GC pattern (Segal et al. 2006). In those studies, our predictions generated more calls closer to the experimental nucleosome data set from Yuan et al. (2005) and less calls further away, compared to the Segal et al. (2006) study. Mapping by the updated AA/TT pattern shows an even better performance in the proximal promoter area (Mavrich et al. 2008a).
The anti-RR/YY pattern represents a more unstable structure (Fig. 2, right), with unfavorable RR/YY positioning for DNA bending. Of the four patterns, anti-WW/SS may generate the most unstable nucleosomes, with DNA that would bend around a histone octamer in the direction opposite to its intrinsic curvature. Intuitively, the latter nucleosomes should be quite unfavorable in their occurrence along the genome. Hence, the anti-WW/SS pattern may be related to genomic regions that are relatively depleted of nucleosomes.
The anti-RR/YY pattern has the backbone of AAs and other RRs facing mostly outward from the histone surface and TTs, and other YYs facing inward, which is not a favorable structure according to the geometrical properties of dinucleotides (Salih et al. 2007). It may be favorable, however, if the number of RRs and YYs following the anti-pattern is greater than the number of YYs and RRs following the regular pattern (see Fig. 2B). In addition, inspection of the regular RR/YY patterns (Ioshikhes et al. 1996; Mavrich et al. 2008a) shows a clear and steep gradient in RR distributions from the 5′ to the 3′ end of the nucleosomal DNA (see Fig. 6A). However, the opposite (3′-to-5′) gradient is much less (if at all) pronounced in the anti-RR/YY pattern (Fig. 6B).
Promoter nucleosomes favor RR/YY and anti-WW/SS NPS patterns
What are the biological implications of the different patterns? The RR/YY pattern may be related to nucleosomes that require facile shifting from their positions upon chromatin remodeling. This may be relevant to nucleosomes situated in the proximal promoter area, in particular, around the TSS, TATA-box, or interacting with specific TFs, which are especially susceptible to chromatin remodeling. To test this hypothesis directly, we counted the nucleosomal sequences that correlated positively or negatively with either the WW/SS or counter-phase AA/TT patterns in the promoter regions of various classes of genes (Table 2). Generally, for the promoter nucleosomes, more nucleosomes were associated with the counter-phase AA/TT (RR/YY) pattern compared to the WW/SS pattern, which is the opposite of what is observed genome-wide. In addition, unlike genome-wide, the number of promoter nucleosomes following the anti-WW/SS pattern was higher or close to the number of nucleosome following the conventional WW/SS pattern. Thus, promoter nucleosomes use RR/YY and anti-WW/SS patterns in a disproportionately higher number than the rest of the genome. They may be well-suited for promoting chromatin remodeling at promoters.
Anti-NPS patterns are linked to the NFR and unstable promoter nucleosomes
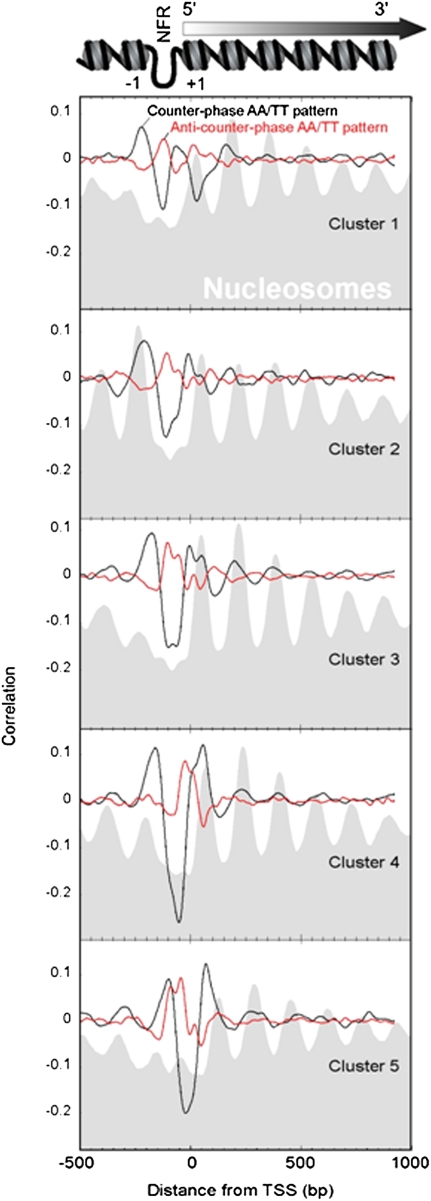
We examined whether the regular and anti-, counter-phase AA/TT NPS patterns (both of the RR/YY class) could model nucleosome organization around the 5′ ends of genes, which is where DNA-encoding of nucleosome organization is most predominant. To facilitate the examination of a large number of genes and look for overarching patterns, we used groups of genes that were previously clustered by K-means (Zhang et al. 2011), based on their in vivo–determined nucleosome organization (Fig. 8).
Figure 8.
Counter-phase AA/TT NPS and anti-NPS correlations predict subsets of nucleosome locations. Regular (black trace) and anti- (red trace) counter-phase AA/TT correlations are shown for composite subsets of nucleosomes defined by K-means clustering (from −500 to +1000 bp) of in vivo patterns for genes aligned by their TSS (Zhang et al. 2011). The gray-filled background shows the composite nucleosome distribution for each cluster of genes.
Each cluster was defined by the combination of two attributes: nucleosome positions and occupancy levels. Cluster 1 is characterized as having a low-occupancy, and thus potentially unstable, +1 nucleosome. This nucleosome was positioned upstream of the canonical location, which places the TSS in a more repressive location closer to the nucleosome dyad. Cluster 2 had high nucleosome occupancy at the −1 position. Clusters 3–5 had genic nucleosomal arrays starting at different distances from the TSS. Like cluster 1, cluster 5 also displayed nucleosome encroachment in the NFR, but near the −1 position instead of the +1 position.
Clusters 1 and 5 genes tend to be TATA-containing, SAGA-dominated, chromatin-regulated, and stress-induced. Genes of such character tend to have plasticity and stochastic fluctuations in gene expression (Newman et al. 2006; Tirosh and Barkai 2008). Clusters 3 and 4 are enriched with genes in the TATA-less, TFIID-dominated, housekeeping class, which represents the majority of all yeast genes and is consistent with their nucleosome organization being more canonical.
Figure 8 (black trace) shows that for clusters 2–4, which comprise most genes, stronger counter-phase AA/TT NPS correlations to a large extent matched with the measured positions of the −1 and +1 nucleosomes (and to a small extent +2 and +3) in native chromatin. Remarkably, the anti-counter-phase AA/TT pattern (red trace) matched with NFRs. This relationship was also most evident in subsets of stress-related genes (see Supplemental Data; Supplemental Fig. 5), but was also found generally at most genes (Supplemental Fig. 6). As reported in recent papers (Jin and Felsenfeld 2007; Schones et al. 2008; Henikoff 2009; Weiner et al. 2010), some NFRs may be occupied by unstable nucleosomes. Such nucleosomes may be easily removed from their sites during gene expression, yet cannot be mapped well by regular NPS patterns, which show strong negative correlation to the NFR.
For cluster 1 and to a lesser extent cluster 5, the regular counter-phase AA/TT NPS correlation reached a local minimum at or near where the +1 nucleosome was positioned (Fig. 8, top panel for cluster 1). In contrast, the anti-counter-phase AA/TT pattern reached a local maximum at the +1 position. This is consistent with the lower nucleosome occupancy level at this position as well as its highly dynamic state (based on analysis of dynamic nucleosomes from Dion et al. 2007; data not shown). It also provides evidence for intrinsically sequence-encoded nucleosome destabilization at this position. Such destabilization may contribute to the expression plasticity that is characteristic of cluster 1 genes.
Nucleosome mapping by alternative patterns
We used the conventional counter-phase AA/TT pattern published by us earlier (Mavrich et al. 2008a) and anti-counter-phase AA/TT pattern (AA/TT component of the anti-RR/YY pattern described here) (Fig. 6B) for genome-wide nucleosome mapping of in vivo nucleosome positions defined by the consensus of six experimental high-resolution nucleosome positioning data sets considered previously (Jiang and Pugh 2009). (The patterns used for mapping are presented in a numerical form in Supplemental Material 2.) Of the 55,387 identified nucleosomes, we chose a subset of 10,961 well-positioned nucleosomes for modeling (for criteria and further details, see Methods). Dinucleotide frequency distributions for the anti-AA/TT pattern were double symmetrized as in Ioshikhes et al. (1996). The percentage of nucleosomes mapped within 35 bp of the in vivo–determined position by the conventional counter-phase AA/TT pattern was ∼45%. This percentage is consistent with the previous accuracy assessments obtained for much smaller experimental data sets (Ioshikhes et al. 2006; Segal et al. 2006). The percentage of the nucleosomes mapped by the anti-counter-phase AA/TT pattern alone was lower (38.5%), yet consistent with the proportions mentioned in the previous sections. However, involvement of both the regular and anti-counter-phase AA/TT patterns allowed successful mapping of up to ∼75% of the nucleosomes compared to ∼39% randomly expected (Z score 13 StD). Mapping by the counter-phase AA/TT pattern obtained here (AA/TT component of the RR/YY pattern represented in Fig. 6A) brought similar results (data not shown). In comparison, the alternative approach (Kaplan et al. 2008; http://genie.weizmann.ac.il/software/nucleo_prediction.html) allows successful mapping of only 40%–42% of the nucleosomes considered here. (Several examples of the mapping of individual nucleosomes by various patterns are shown in Supplemental Fig. 7.) Only 9% of the nucleosomes are detected by both patterns simultaneously, much lower than the 17.5% expected by chance (Z score 17 StD), which means that the patterns essentially are mutually exclusive. Hence, addition of the alternative anti-NPS pattern allows dramatic improvement of the nucleosome mapping.
Conclusions
Remarkably, while the sequence-preferable positioning of the NPS and anti-NPS nucleosomes is mutually exclusive, overall it is also not random in both situations. Hence, the discovery of the anti-NPS patterns provides a plausible explanation to the fact that only a fraction of the nucleosomes were successfully mapped by previously described computational approaches. We provide evidence that the anti-NPS patterns contribute to the organization of many of the remaining nucleosomes. Combining of the NPS and anti-NPS patterns leads to an improved efficiency of nucleosome mapping. With that said, we are far from the opinion that all or even most well-positioned nucleosomes are purely sequence-encoded: Other factors such as DNA-binding proteins, chromatin remodelers, and strong barrier nucleosomes play essential roles in establishing the positioning of nucleosomes around the beginning and end of genes (Zhang et al. 2011).
Methods
The 2285 well-phased H2A.Z nucleosomes out of about 60,000 that exist in Saccharomyces (Albert et al. 2007) were used as a training set for calculation of the NPS and anti-NPS patterns. This subset was selected to have the left and right consensus ends of the nucleosome 146 ± 1 bp apart, and average dinucleotide distributions were calculated for the nucleosome sequences of 146 bp centered around their experimentally mapped dyad positions. The latter could be inferred from positions of the nucleosome ends mapped by MNase, 73 bp away from them. We used both nucleosome ends separately to reconstitute the position of the center, which doubled the number of considered nucleosomes. We also considered sequences of the two DNA strands, which resulted in a total of 9140 sequences in the study set.
Correlation of the dinucleotide patterns to particular DNA sequences was calculated as in Mavrich et al. (2008a) and Ioshikhes et al. (2006). Particular implementation varied by the considered dinucleotides and particular problem.
To separate the nucleosome data set according to the correlation of AA distribution in the individual sequences with the WW pattern, the correlations were calculated as follows:

where i is position in nucleosomal DNA, AA(i) and WW(i) are occurrence frequencies of AA and WW dinucleotides in the position i, whereas index_s_ at AAs(i) represents occurrence frequencies of AA dinucleotides in a single sequence, index_p_ at WWp(i) occurrence frequencies of WW dinucleotide in a WW pattern published earlier (Albert et al. 2007), and M() are their averages along the nucleosomal DNA.
Separation of the sequences into those with positive and negative correlations to the AA/TT pattern from Ioshikhes et al. (1996) and to the WW/SS pattern from Albert et al. (2007) and those with positive and negative correlations with the counter-phase was performed using Equations 2 and 3, respectively:


with index_s_ and index_p_ pertaining to distributions of respective dinucleotides in a given sequence and particular pattern, respectively. The results are presented in Supplemental Material 2.
For the genome-wide nucleosome mapping, genomic sequences were scanned with a 1-bp step. Positional correlation maps between AA/TT distributions in the sequence and various patterns were calculated as in Equation 2, inside a window of a size of a nucleosomal DNA centered in the scanning point. The correlation maps were averaged across the sequences to obtain average NPS/anti-NPS correlation maps in the promoters.
Promoter sequences were retrieved from SGD database when aligned according to the first codon (ORF start) as in Ioshikhes et al. (2006) or according to TSS position (David et al. 2006). Various promoter groups were analyzed (see averaged correlation maps for different gene groups in Supplemental Fig. 5).
Nucleosome mapping was performed for six experimental data sets considered in Jiang and Pugh (2009), with NPS correlation maps calculated according to the protocol described in Ioshikhes et al. (2006), using the AA/TT NPS pattern from Mavrich et al. (2008a) and the AA/TT component of the anti-RR/YY pattern described here. To avoid possible distortion of the mapping results due to experimental error, only consensus nucleosome positions that most consistently mapped across the six data sets from Jiang and Pugh (2009) (see below) were selected for the present analysis. The data sets from Jiang and Pugh (2009) included 55,387 unique nucleosomes. To obtain the nucleosomes studied here, data were filtered, so that only 10,961 nucleosomes associated with genes (as defined in Additional Data File 1 of Jiang and Pugh 2009) in the lowest 50% of expression level (as defined by Holstege et al. 1998) were analyzed. Data were further filtered to retain only nucleosomes with low fuzziness: There were 8435 nucleosomes with sigma < 12; only 474 of them were part of our training set. For sigma < 6, there were 2526 nucleosomes; only 158 of them were part of the training set. Hence, the training set and the test sets were essentially non-redundant. The percentage of successfully mapped nucleosomes was similar for the both test sets. The smoothing of the NPS distributions was done by a triangular filter with a 21-bp window. The highest-scoring location was identified inside the interval 90 bp from the experimental position of the nucleosome, with such locations inside 35 bp from the experimental position considered as successful prediction.
Acknowledgments
This work was supported by a grant from NIH (HG004160) to B.F.P. and I.I., and CFI LOF/ORF grant 22880 to I.I. and S.H. We thank D. Yang and C. Joslin for assistance in preparation of Figures 1 and 2, Z. Zhang for assistance in preparation of Figure 8, J. Dilworth and S. Bennett for critical editing of the manuscript, D. Bickel for corrections, and E.N. Trifonov for useful discussions.
Authors' contributions: I.I. conceived the study, performed calculations of the NPS/anti-NPS patterns and NPS correlations, analyzed the results, and wrote the manuscript. S.H. performed analysis of the NPS correlations and their match with experimental data. B.F.P. directed the work, including data analysis, figure assembly, and manuscript writing.
Footnotes
[Supplemental material is available for this article.]
References
- Albert I, Mavrich TN, Tomsho LP, Qi J, Zanton SJ, Schuster SC, Pugh BF 2007. Translational and rotational settings of H2A.Z nucleosomes across the Saccharomyces cerevisiae genome. Nature 446: 572–576 [DOI] [PubMed] [Google Scholar]
- Anselmi C, Bocchinfuso G, De Santis P, Savino M, Scipioni A 2000. A theoretical model for the prediction of sequence-dependent nucleosome thermodynamic stability. Biophys J 79: 601–613 [DOI] [PMC free article] [PubMed] [Google Scholar]
- Baldi P, Brunak S, Chauvin Y, Krogh A 1996. Naturally occurring nucleosome positioning signals in human exons and introns. J Mol Biol 263: 503–510 [DOI] [PubMed] [Google Scholar]
- Calladine CR, Drew HR 1986. Principles of sequence-dependent flexure of DNA. J Mol Biol 192: 907–918 [DOI] [PubMed] [Google Scholar]
- Chung HR, Vingron M 2009. Sequence-dependent nucleosome positioning. J Mol Biol 386: 1411–1422 [DOI] [PubMed] [Google Scholar]
- Cohanim AB, Kashi Y, Trifonov EN 2006. Three sequence rules for chromatin. J Biomol Struct Dyn 23: 559–565 [DOI] [PubMed] [Google Scholar]
- David L, Huber W, Granovskaia M, Toedling J, Palm CJ, Bofkin L, Jones T, Davis RW, Steinmetz LM 2006. A high-resolution map of transcription in the yeast genome. Proc Natl Acad Sci 103: 5320–5325 [DOI] [PMC free article] [PubMed] [Google Scholar]
- Dion MF, Kaplan T, Kim M, Buratowski S, Friedman N, Rando OJ 2007. Dynamics of replication-independent histone turnover in budding yeast. Science 315: 1405–1408 [DOI] [PubMed] [Google Scholar]
- Drew HR, Travers AA 1985. DNA bending and its relation to nucleosome positioning. J Mol Biol 186: 773–790 [DOI] [PubMed] [Google Scholar]
- Henikoff S 2009. Labile H3.3+H2A.Z nucleosomes mark ‘nucleosome-free regions.' Nat Genet 41: 865–866 [DOI] [PubMed] [Google Scholar]
- Holstege FC, Jennings EG, Wyrick JJ, Lee TI, Hengartner CJ, Green MR, Golub TR, Lander ES, Young RA 1998. Dissecting the regulatory circuitry of a eukaryotic genome. Cell 95: 717–728 [DOI] [PubMed] [Google Scholar]
- Ioshikhes I, Bolshoy A, Trifonov EN 1992. Preferred positions of AA and TT dinucleotides in aligned nucleosome DNA sequences. J Biomol Struct Dyn 9: 1111–1117 [DOI] [PubMed] [Google Scholar]
- Ioshikhes I, Bolshoy A, Derenshteyn K, Borodovsky M, Trifonov EN 1996. Nucleosome DNA sequence pattern revealed by multiple alignment of experimentally mapped sequences. J Mol Biol 262: 129–139 [DOI] [PubMed] [Google Scholar]
- Ioshikhes IP, Albert I, Zanton SJ, Pugh BF 2006. Nucleosome positions predicted through comparative genomics. Nat Genet 38: 1210–1215 [DOI] [PubMed] [Google Scholar]
- Iyer V, Struhl K 1995. Poly(dA:dT), a ubiquitous promoter element that stimulates transcription via its intrinsic DNA structure. EMBO J 14: 2570–2579 [DOI] [PMC free article] [PubMed] [Google Scholar]
- Jiang C, Pugh BF 2009. A compiled and systematic reference map of nucleosome positions across the Saccharomyces cerevisiae genome. Genome Biol 10: R109 doi: 10.1186/gb-2009-10-10-r109 [DOI] [PMC free article] [PubMed] [Google Scholar]
- Jin C, Felsenfeld G 2007. Nucleosome stability mediated by histone variants H3.3 and H2A.Z. Genes Dev 21: 1519–1529 [DOI] [PMC free article] [PubMed] [Google Scholar]
- Kaplan N, Moore IK, Fondufe-Mittendorf Y, Gossett AJ, Tillo D, Field Y, LeProust EM, Hughes TR, Lieb JD, Widom J, et al. 2008. The DNA-encoded nucleosome organization of a eukaryotic genome. Nature 458: 362–366 [DOI] [PMC free article] [PubMed] [Google Scholar]
- Kogan SB, Kato M, Kiyama R, Trifonov EN 2006. Sequence structure of human nucleosome DNA. J Biomol Struct Dyn 24: 43–48 [DOI] [PubMed] [Google Scholar]
- Lowary PT, Widom J 1998. New DNA sequence rules for high affinity binding to histone octamer and sequence-directed nucleosome positioning. J Mol Biol 276: 19–42 [DOI] [PubMed] [Google Scholar]
- Lu Q, Wallrath LL, Elgin SCR 1994. Nucleosome positioning and gene regulation. J Cell Biochem 55: 83–92 [DOI] [PubMed] [Google Scholar]
- Mavrich TN, Ioshikhes IP, Venters BJ, Jiang C, Tomsho LP, Qi J, Schuster SC, Albert I, Pugh BF 2008a. A barrier nucleosome model for statistical positioning of nucleosomes throughout the yeast genome. Genome Res 18: 1073–1083 [DOI] [PMC free article] [PubMed] [Google Scholar]
- Mavrich TN, Jiang C, Ioshikhes IP, Li X, Venters BJ, Zanton SJ, Tomsho LP, Qi J, Glaser RL, Schuster SC, et al. 2008b. Nucleosome organization in the Drosophila genome. Nature 453: 358–362 [DOI] [PMC free article] [PubMed] [Google Scholar]
- Mengeritsky G, Trifonov EN 1983. Nucleotide sequence-directed mapping of the nucleosomes. Nucleic Acids Res 11: 3833–3851 [DOI] [PMC free article] [PubMed] [Google Scholar]
- Newman JR, Ghaemmaghami S, Ihmels J, Breslow DK, Noble M, DeRisi JL, Weissman JS 2006. Single-cell proteomic analysis of S. cerevisiae reveals the architecture of biological noise. Nature 441: 840–846 [DOI] [PubMed] [Google Scholar]
- Peckham HE, Thurman RE, Fu Y, Stamatoyannopoulos JA, Noble WS, Struhl K, Weng Z 2007. Nucleosome positioning signals in genomic DNA. Genome Res 17: 1170–1177 [DOI] [PMC free article] [PubMed] [Google Scholar]
- Radman-Livaja M, Rando OJ 2009. Nuclesome positioning: How is it established, and why does it matter? Dev Biol 339: 258–266 [DOI] [PMC free article] [PubMed] [Google Scholar]
- Rapoport AE, Frenkel ZM, Trifonov EN 2011. Nucleosome positioning pattern derived from oligonucleotide compositions of genomic sequences. J Biomol Struct Dyn 28: 567–574 [DOI] [PubMed] [Google Scholar]
- Salih F, Salih B, Trifonov EN 2007. Sequence-directed mapping of nucleosome positions. J Biomol Struct Dyn 24: 489–494 [DOI] [PubMed] [Google Scholar]
- Satchwell SC, Drew HR, Travers AA 1986. Sequence periodicities in chicken nucleosome core DNA. J Mol Biol 191: 659–675 [DOI] [PubMed] [Google Scholar]
- Schones DE, Cui K, Cuddapah S, Roh TY, Barski A, Wang Z, Wei G, Zhao K 2008. Dynamic regulation of nucleosome positioning in the human genome. Cell 132: 887–898 [DOI] [PMC free article] [PubMed] [Google Scholar]
- Segal E, Widom J 2009a. Poly(dA:dT) tracts: major determinants of nucleosome organization. Curr Opin Struct Biol 19: 65–71 [DOI] [PMC free article] [PubMed] [Google Scholar]
- Segal E, Widom J 2009b. What controls nucleosome positions? Trends Genet 25: 335–343 [DOI] [PMC free article] [PubMed] [Google Scholar]
- Segal E, Fondufe-Mittendorf Y, Chen L, Thastrom A, Field Y, Moore IK, Wang JP, Widom J 2006. A genomic code for nucleosome positioning. Nature 442: 772–778 [DOI] [PMC free article] [PubMed] [Google Scholar]
- Simpson RT 1991. Nucleosome positioning: Occurrence, mechanisms, and functional consequences. Prog Nucleic Acid Res Mol Biol 40: 143–184 [DOI] [PubMed] [Google Scholar]
- Thoma F 1992. Nucleosome positioning. Biochim Biophys Acta 1130: 1–19 [DOI] [PubMed] [Google Scholar]
- Tirosh I, Barkai N 2008. Two strategies for gene regulation by promoter nucleosomes. Genome Res 18: 1084–1091 [DOI] [PMC free article] [PubMed] [Google Scholar]
- Travers A, Caserta M, Churcher M, Hiriart E, Di Mauro E 2009. Nucleosome positioning—what do we really know? Mol Biosyst 5: 1582–1592 [DOI] [PubMed] [Google Scholar]
- Travers A, Hiriart E, Churcher M, Caserta M, Di Mauro E 2010. The DNA sequence-dependence of nucleosome positioning in vivo and vitro. J Biomol Struct Dyn 27: 713–724 [DOI] [PMC free article] [PubMed] [Google Scholar]
- Trifonov EN 1985. Curved DNA. CRC Crit Rev Biochem 19: 89–106 [DOI] [PubMed] [Google Scholar]
- Trifonov EN 2010. Nucleosome positioning by sequence, state of the art and apparent finale. J Biomol Struct Dyn 27: 741–746 [DOI] [PubMed] [Google Scholar]
- Trifonov EN, Sussman JL 1980. The pitch of chromatin DNA is reflected in its nucleotide sequence. Proc Natl Acad Sci 77: 3816–3820 [DOI] [PMC free article] [PubMed] [Google Scholar]
- Uberbacher EC, Harp JM, Bunick GJ 1988. DNA sequence patterns in precisely positioned nucleosomes. J Biomol Struct Dyn 6: 105–120 [DOI] [PubMed] [Google Scholar]
- Weiner A, Hughes A, Yassour M, Rando OJ, Friedman N 2010. High-resolution nucleosome mapping reveals transcription-dependent nucleosome packaging. Genome Res 20: 90–100 [DOI] [PMC free article] [PubMed] [Google Scholar]
- Wolffe AP 1994. Nucleosome positioning and modification: chromatin structures that potentiate transcription. Trends Biochem Sci 19: 240–244 [DOI] [PubMed] [Google Scholar]
- Yuan GC, Liu YJ, Dion MF, Slack MD, Wu LF, Altschuler SJ, Rando OJ 2005. Genome-scale identification of nucleosome positions in S. cerevisiae. Science 309: 626–630 [DOI] [PubMed] [Google Scholar]
- Zhang Z, Wippo CJ, Wal M, Ward E, Korber P, Pugh BF 2011. A packing mechanism for nucleosome organization reconstituted across a eukaryotic genome. Science 332: 977–980 [DOI] [PMC free article] [PubMed] [Google Scholar]
- Zhurkin VB 1983. Specific alignment of nucleosomes on DNA correlates with periodic distribution of purine–pyrimidine and pyrimidine–purine dimers. FEBS Lett 158: 293–297 [DOI] [PubMed] [Google Scholar]
