RNA mimics of green fluorescent protein (original) (raw)
. Author manuscript; available in PMC: 2012 Mar 28.
Published in final edited form as: Science. 2011 Jul 29;333(6042):642–646. doi: 10.1126/science.1207339
Abstract
Green fluorescent protein (GFP) and its derivatives have transformed the use and analysis of proteins for diverse applications. Like proteins, RNA has complex roles in cellular function and is increasingly used for various applications, but a comparable approach for fluorescently tagging RNA is lacking. Here we describe the generation of RNA aptamers that bind fluorophores resembling the fluorophore in GFP. These RNA-fluorophore complexes create a palette that spans the visible spectrum. An RNA-fluorophore complex resembling enhanced GFP (EGFP), termed Spinach, emits a green fluorescence comparable in brightness to fluorescent proteins. Spinach is markedly resistant to photobleaching, and Spinach fusion RNAs can be imaged in living cells. These RNA mimics of GFP provide an approach for genetic encoding of fluorescent RNAs.
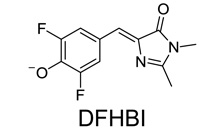
The fluorophore in GFP is formed from three residues in the nascent protein, Ser65-Tyr66-Gly67, which undergo an autocatalytic intramolecular cyclization. The resulting fluorophore, 4-hydroxybenzlidene imidazolinone (HBI) (Fig. 1A), is encased within the protein, enabling its fluorescence (1). Chemically synthesized HBI is nonfluorescent (2), as is denatured GFP (3). However, upon refolding, the fluorescence of GFP is recovered (3). The folded GFP protein forms specific contacts with the fluorophore that prevent intramolecular motions, making fluorescence the major pathway available to dissipate the energy of the excited state fluorophore (4).
Fig. 1. RNA aptamers switch on the fluorescence of GFP-like fluorophores.
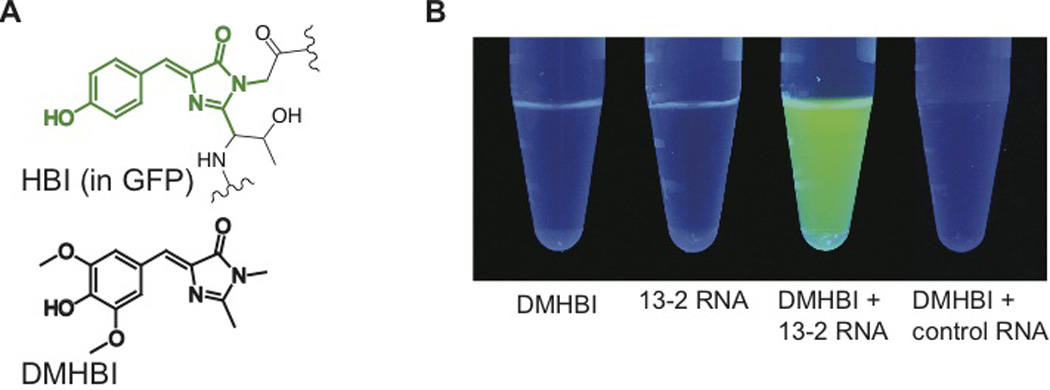
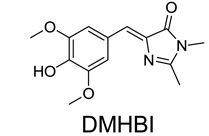
(A) Structure of HBI (green) in the context of GFP, and DMHBI.
(B) 13-2 enhances the fluorescence of DMHBI. Solutions containing DMHBI, 13-2 RNA, DMHBI with 13-2 RNA, or DMHBI with total HeLa cell RNA were photographed under illumination with 365 nm light. The image is a montage obtained under identical image acquisition conditions.
The ability to confer GFP-like functionality to RNA would facilitate studies of RNA biology and advance RNA-based applications. An RNA sequence with GFP-like properties should exhibit fluorescence upon binding a small molecule fluorophore. However, in order to have fluorescence only associated with the RNA, the small molecule would need to be in a nonfluorescent form when not bound, and switch to a fluorescent form only when bound. Antibodies and aptamers capable of eliciting the fluorescence of conditionally fluorescent dyes have been described (5–7). However, most conditional fluorophores can also be activated nonspecifically (4), or have other undesirable properties such as cytotoxicity (8) (See Supplementary Online Text). We therefore sought to identify a small molecule whose fluorescence could be activated by a specific RNA sequence, yet not activated by other cellular constituents.
Because fluorescence enhancement of HBI requires suppression of subtle movements of the fluorophore (4), we reasoned that the fluorescence of HBI would not be induced by cellular constituents. To test this, we prepared several HBI derivatives (fig. S1A) and found that these compounds were not detectably fluorescent upon incubation with cells (fig. S1B), or cellular RNA or DNA (fig. S1C). Incubation of GFP-like fluorophores with cells illuminated for 10 min at 37 °C resulted in negligible cell death, while another conditional fluorophore, malachite green, exhibited considerable cytotoxicity (fig. S1D).
We next sought to identify RNA sequences that bind and activate the fluorescence of GFP fluorophores beginning with 3,5-dimethoxy-4-hydroxybenzylidene imidazolinone (DMHBI) (Fig. 1A). We performed SELEX (9, 10) with a library containing ~5 × 10¹³ RNA molecules and selected RNAs for their ability to bind DMHBI-agarose. After five rounds of selection, the pool of RNAs weakly activated DMHBI fluorescence, with further increases in fluorescence up to round 10 (fig. S2A).
To identify individual RNA aptamers that accounted for DMHBI fluorescence, we screened individual sequences and identified one RNA, 13-2 (fig. S2B,C), which exhibited the highest degree of aptamer-induced fluorescence (Fig. 1B). The spectra of the 13-2-DMHBI complex contained a single emission peak at 529 nm and single excitation peak at 398 nm (fig. S2B). The brightness of 13-2-DMHBI was 12% relative to GFP (table 1) and the _K_D for the 13-2-DMHBI complex is 464 nM (fig. S2D). Truncation and mutagenesis experiments supported the secondary structure predicted by Mfold (11) (fig. S2E) and resulted in a 60-nt minimal domain with enhanced quantum yield (table 1, fig. S2E).
Table 1.
Photophysical and binding properties of RNA-fluorophore complexes
| Fluorophore | Excitationmaximum (nm) | Emissionmaximum (nm) | Extinctioncoefficient(M−1cm−1)b | Fluorescencequantum yield | KD | Brightnessc |
|---|---|---|---|---|---|---|
| Aequorea GFPa | 395 | 508 | 27,600 | 0.79 | - | 100 |
| EGFPa | 489 | 508 | 55,000 | 0.60 | - | 151 |
 |
394 | 487 | 23,336 | 0.0005 | - | 0.05 |
| 2-4 | 397 | 464 | 21,536 | 0.10 | N.D. | 6 |
| 13-2 | 398 | 529 | 23,391 | 0.06 | 514 nM | 12 |
| 13-2-min | 398 | 529 | 23,391 | 0.11 | 514 nM | 12 |
| 3-6 | 398 | 537 | 25,300 | 0.05 | 490 nM | 6 |
| 17-3 | 405 | 547 | 18,127 | 0.09 | N.D. | 7 |
 |
447 | 519 | 14,329 | 0.003 | - | 0.2 |
| 11-3 | 489 | 512 | 18,743 | 0.05 | N.D. | 4 |
 |
399 | 461 | 10,943 | 0.0005 | - | 0.02 |
| 2-8 | 396 | 588 | 10,714 | 0.004 | N.D. | 0.2 |
 |
405 | 498 | 11,864 | 0.0007 | - | 0.04 |
| 24-2 (Spinach) | 469 | 501 | 24,271 | 0.72 | 562 nM | 80 |
To determine if DMHBI could be spectrally tuned by RNA to exhibit a range of fluorescence properties, we performed further SELEX screens (12). Several aptamers were identified which exhibited markedly different spectral properties, including cyan (2–4), greenish-yellow (3–6), and yellow (17-3) fluorescence (Fig. 2, A–D, table 1). Sequence alignment of these aptamers reveals little sequence similarity, and secondary structure analysis predicts a range of structures (fig. S3).
Fig. 2. Spectral tuning and fluorophore diversity produce a palette of RNA-fluorophore complexes.
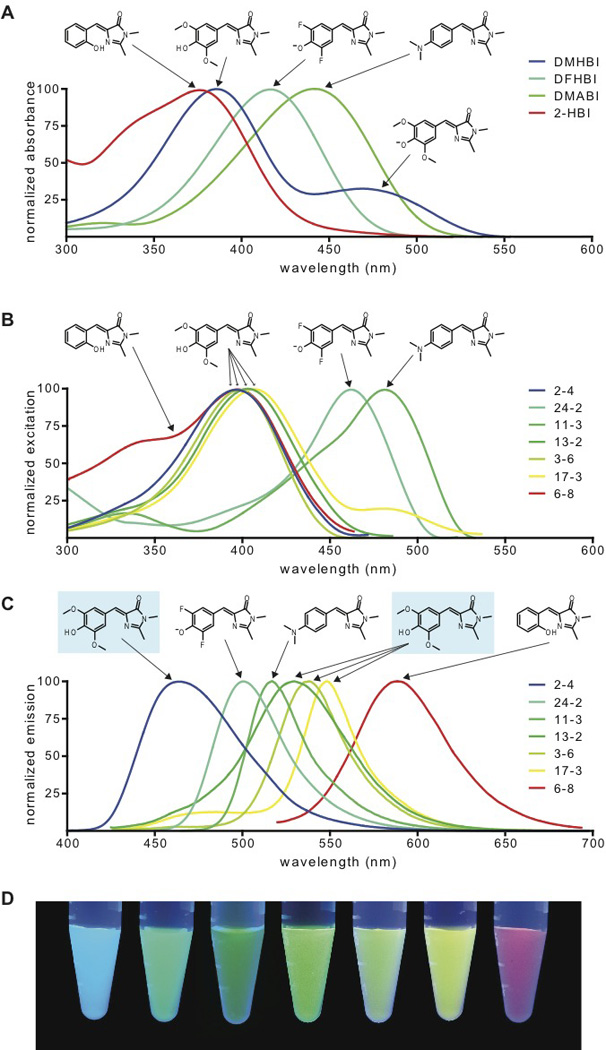
(A) Absorbance spectra of GFP-like fluorophores. Spectra were collected in the absence of RNA at pH 7.4.
(B,C) Excitation (B) and emission (C) spectra of RNA-fluorophore complexes. Spectra were collected in the presence of excess fluorophore at pH 7.4 for RNAs binding to DMHBI (2–4, 13-2, 3–6 and 17-3), DFHBI (24-2), DMABI (11-3) and 2-HBI (6–8). Spectra are normalized to the excitation and emission peak for each complex. Arrows indicate the fluorophore from which each spectrum is derived. For emission spectra (C), DMHBI is indicated by blue shading.
(D) RNA-fluorophore complexes were illuminated with UV light (365 nm) and photographed. From left to right, the tubes contain RNAs 2–4, 24-2, 11-3, 13-2, 3–6, 17-3, 6–8 and fluorophores as indicated above. The image is a montage obtained under identical image acquisition conditions.
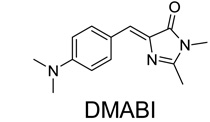
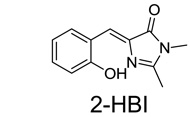
To further extend spectral properties, we generated two additional GFP-like fluorophores, 4-dimethylaminobenzylidene imidazolinone (DMABI) and 2-hydroxybenzlidene imidazolinone (2-HBI) (fig. S1A). An aptamer selected against DMABI exhibited green fluorescence, while an aptamer selected against 2-HBI exhibited orange-red fluorescence (Fig. 2D, fig. S3). Thus, a range of RNA-fluorophore complexes spanning the visible spectrum can be generated using GFP-like fluorophores.
A significant advance in GFP technology was the discovery of EGFP (13). The HBI fluorophore in GFP/EGFP can exist in either the phenol (protonated) or phenolate (deprotonated) form. In GFP, the phenol form predominates at neutral pH because of the relatively high p_K_a of HBI (14), while in EGFP HBI is almost exclusively in the phenolate form (13). The phenolate species exhibits a higher extinction coefficient, which contributes to the increased brightness of EGFP (13).
Characterization of the DMHBI-binding aptamers suggested that these complexes mimic GFP rather than EGFP. Like HBI, DMHBI at pH 7.4 is primarily in the phenol form, with a small portion in the phenolate form (Fig. 2A), consistent with its p_K_a of 8.0 (fig. S4A). When bound to 17-3, the excitation spectrum reveals both forms, indicating this aptamer binds DMHBI irrespective of its protonation state (Fig. 2B). Thus, the 17-3-DMHBI complex most closely resembles GFP. In contrast, when DMHBI is bound to either 13-2, 2-4, or 3–6, the excitation spectra reveals that RNA binds exclusively to the phenolic form of the fluorophore (Fig. 2B).
To generate RNA-fluorophore complexes that exhibit the spectral properties of EGFP, we employed a biomimetic strategy to obtain RNAs that bind the phenolate form of a GFP-like fluorophore. We designed a new HBI derivative, 3,5-difluoro-4-hydroxybenzylidene imidazolinone (DFHBI), which is exclusively in the phenolate form due to the introduction of fluorine residues which reduce the p_K_a (Fig. 2A). An aptamer selected against DFHBI (24-2) exhibited an excitation spectra consistent with exclusive binding to the phenolate form of DFHBI (Fig. 3A), and a markedly enhanced quantum yield of 0.72, which is 20% higher than EGFP (table 1). The molar brightness of 24-2-DFHBI is 53% of EGFP, but brighter than many other fluorescent proteins (15) (table 1).
Fig. 3. RNA-fluorophore complexes with EGFP-like properties.
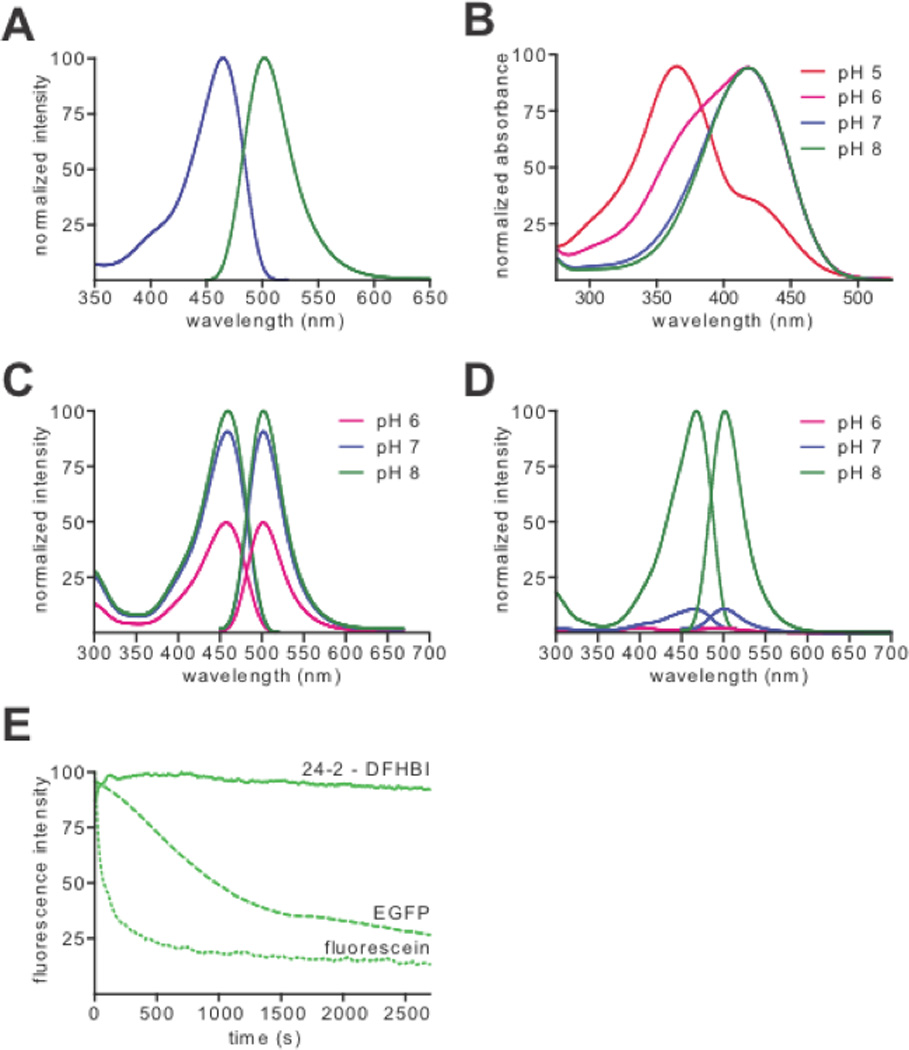
(A) Normalized excitation (blue) and emission (green) spectra of 24-2-DFHBI complex.
(B) Normalized absorbance spectra of DFHBI at pHs 5.0, 6.0, 7.0 and 8.0.
(C,D) 24-2 incubated with excess DFHBI (C) or HBI (D) at pHs 6.0, 7.0 and 8.0.
(E) Photobleaching curves for 24-2-DFHBI, EGFP and fluorescein. Fluorophores were immobilized on glass slides and illuminated continuously with a 130 W mercury lamp. Total fluorescence was then plotted against exposure time and normalized to the maximum intensity of each fluorophore.
To determine if 24-2 selectively recognizes the phenolate form of DFHBI we measured its spectral properties at different pHs. When the pH is lowered to pH 6.0, both the phenolic and phenolate forms of DFHBI are detected (Fig. 3B). However, at pH 6.0, the 24-2-DFHBI complex exhibits only the phenolate excitation peak, indicating preferential binding of the RNA to the phenolate form of the fluorophore (Fig. 3C). We also examined the binding of 24-2 to HBI, which resembles DFHBI, but lacks fluorines. 24-2 weakly binds and activates the fluorescence of HBI at pH 8.0, where both the phenol and phenolate forms are present (16). However, at pH 7.0 and 6.0, where only the phenol form is present, 24-2 fails to activate HBI fluorescence. Taken together, these data suggest that 24-2 selectively recognizes the phenolate form of the fluorophore.
We next examined the photobleaching properties of 24-2-DFHBI complexes. 24-2 was immobilized to a glass surface, and total fluorescence was measured with DFHBI in solution over 45 min of continuous illumination. Compared to fluorescein and EGFP, 24-2-DFHBI exhibited negligible photobleaching, suggesting that exchange of bound DFHBI with DFHBI in solution prevents the accumulation of photobleached complexes.
Because of the green fluorescence and useful spectral properties of 24-2-DFHBI complexes, we termed the 24-2 sequence Spinach. To examine Spinach fluorescence in cells, we transformed E. coli with plasmids expressing Spinach fused to a short RNA stabilizing element (17). After a brief incubation with DFHBI, we found that fluorescence was readily detectable in individual cells (fig. S5A) as well as in colonies on a plate (fig. S5B).
To determine if Spinach could be used to tag RNAs in living mammalian cells, we fused Spinach to the 3’ end of 5S, a small noncoding RNA transcribed by RNA polymerase III (Pol III) that associates with the large ribosomal subunit (fig. S6), and transfected this construct into HEK293T cells. The 3’ end of 5S is solvent exposed, and addition of short sequences to the 3’ end does not affect 5S localization (18). 5S-Spinach fluorescence was detected throughout cells (Fig. 4A), with a distribution similar to that of endogenous 5S in the same cell type (18). Following application of 600 mM sucrose, a form of cellular stress which induces the formation of cytoplasmic RNA granules (19), 5S-Spinach relocalized to large (~2–3 µm) cytosolic foci, many of which colocalize with TIAR, a marker of stress granules (20) (fig. S7).
Fig. 4. Live cell imaging of Spinach fusion RNAs.

(A) Live cell imaging of Spinach-tagged 5S RNA. Fluorescence and phase images of HEK293T cells expressing 5S tagged with either Spinach or Lamda, a control RNA. Fluorescence is detected in 5S-Spinach expressing cells in the presence of 20 µM DFHBI, with granule formation present in cells treated with 600 mM sucrose for 30 min (↑Suc). White dashed lines indicate nuclear borders assessed by Hoescht 33342 staining.
(B) 5S-Spinach RNA induction in response to stress. 5S-Spinach-expressing HEK293T cells were pretreated with 30 nM ML-60128 for 16 hours and then treated with vehicle or 600 mM sucrose for 60 min. Treatment of cells with sucrose resulted in a rapid induction of 5S-Spinach RNA and an increase in total 5S-Spinach levels compared to control cells.
(C) 5S-Spinach RNA localization into granules. 5S-Spinach-expressing HEK293T cells were stimulated with 600 mM sucrose to monitor the rate of formation of 5S-Spinach-containing granules. Arrowheads indicate granules that formed earliest, and arrows indicate granules that developed later during the time course of treatment. Scale bar, 10 µm.
To monitor live cell 5S dynamics, cells were treated with the Pol III inhibitor ML-60218 (21), which reduces 5S-Spinach fluorescence to baseline levels (movie S1). We first monitored nuclear export of 5S-Spinach. After washout of ML-60218, cells were incubated with leptomycin B, an inhibitor of nuclear export of 5S (22). Under these conditions, 5S-Spinach accumulates in the nucleus. Upon removal of leptomycin-B, 5S-Spinach rapidly appeared in the cytosol (movie S1), indicating highly efficient nucleocytoplasmic trafficking of 5S. We next monitored the induction of 5S-Spinach in response to sucrose. After washout of ML-60218, treatment of cells with sucrose resulted in rapid induction of 5S-Spinach over 60 min, and a higher total level of 5S-Spinach than in untreated cells (Fig. 4B, movie S2). Unlike control cells, sucrose treatment caused 5S-Spinach to accumulate to higher levels in the nucleus than in the cytosol (fig. S8), possibly reflecting saturation of the nuclear export machinery. Additionally, 5S-Spinach accumulated in cytoplasmic granular structures 30 min after sucrose treatment, consistent with stress granule formation (movie S2). We next examined the time course of relocalization of 5S-Spinach into granules in cells not treated with ML-60218. Prior to experimental treatment, 5S-Spinach exhibited diffuse nuclear and cytoplasmic localization (Fig. 4C). Following sucrose treatment, 5S-Spinach clustered into granules in as little as 9 min (movie S3), with new granules continuing to form up to 30 min later. Together, these data indicate the ability of Spinach to the reveal intracellular dynamics of RNA in living cells.
Here we describe a palette of RNA-fluorophore complexes spanning much of the visible spectrum. RNAs can be tagged with Spinach, providing a simple strategy for introducing a compact fluorescent tag for live cell imaging of RNAs, while avoiding the problems associated with current methods for tagging RNAs (23). Spinach is different from GFP in that it exhibits considerable resistance to photobleaching, and fluorescence is observed shortly after Spinach transcription in cells, which contrasts with the delay in acquisition of fluorescence by nascent GFP due to the requirement for fluorophore maturation (24). The results described here raise the possibility of using genetically encoded RNA-fluorophore complexes for other applications, including RNA-RNA and RNA-protein fluorescence resonance energy transfer, and simultaneous imaging of multiple RNAs.
Supplementary Material
Supplementary Information
Acknowledgments
We thank M. S. Cohen, A. Deglincerti, J. D. Warren and S. C. Blanchard (Weill Cornell Medical College) and D. S. Tan (Sloan-Kettering Institute) for useful comments and suggestions, D. Engelke (University of Michigan) for providing plasmids containing the 5S sequence, and F. Dardel (Université Paris Descartes) for providing plasmids containing the tRNA scaffold sequence. This work was supported by the McKnight Neuroscience Technology Innovation Award, Weill Cornell Medical College, and NINDS NS064516 (S.R.J.), and training grant T32CA062948 (J.S.P.).
Footnotes
*
Publisher's Disclaimer: This manuscript has been accepted for publication in Science. This version has not undergone final editing. Please refer to the complete version of record at http://www.sciencemag.org/. The manuscript may not be reproduced or used in any manner that does not fall within the fair use provisions of the Copyright Act without the prior, written permission of AAAS.
Supporting Online Material
Materials and Methods
SOM Text
Figs. S1 to S8
Movies S1 to S3
References
REFERENCES AND NOTES
- 1.Chudakov DM, Matz MV, Lukyanov S, Lukyanov KA. Fluorescent Proteins and Their Applications in Imaging Living Cells and Tissues. Physiol. Rev. 2010;90:1103. doi: 10.1152/physrev.00038.2009. [DOI] [PubMed] [Google Scholar]
- 2.Niwa H, et al. Chemical nature of the light emitter of the Aequorea green fluorescent protein. Proc Natl Acad Sci USA. 1996;93:13617. doi: 10.1073/pnas.93.24.13617. [DOI] [PMC free article] [PubMed] [Google Scholar]
- 3.Ward WW, Bokman SH. Reversible denaturation of Aequorea green-fluorescent protein: physical separation and characterization of the renatured protein. Biochemistry (Mosc) 1982;21:4535. doi: 10.1021/bi00262a003. [DOI] [PubMed] [Google Scholar]
- 4.Meech S. Excited state reactions in fluorescent proteins. Chem. Soc. Rev. 2009 doi: 10.1039/b820168b. [DOI] [PubMed] [Google Scholar]
- 5.Babendure J, Adams S, Tsien R. Aptamers switch on fluorescence of triphenylmethane dyes. J. Am. Chem. Soc. 2003;125:14716. doi: 10.1021/ja037994o. [DOI] [PubMed] [Google Scholar]
- 6.Constantin TP, et al. Synthesis of new fluorogenic cyanine dyes and incorporation into RNA fluoromodules. Org Lett. 2008;10:1561. doi: 10.1021/ol702920e. [DOI] [PubMed] [Google Scholar]
- 7.Szent-Gyorgyi C, et al. Fluorogen-activating single-chain antibodies for imaging cell surface proteins. Nat. Biotechnol. 2008;26:235. doi: 10.1038/nbt1368. [DOI] [PubMed] [Google Scholar]
- 8.Liao JC, Roider J, Jay DG. Chromophore-assisted laser inactivation of proteins is mediated by the photogeneration of free radicals. Proc Natl Acad Sci USA. 1994;91:2659. doi: 10.1073/pnas.91.7.2659. [DOI] [PMC free article] [PubMed] [Google Scholar]
- 9.Ellington AD, Szostak JW. In vitro selection of RNA molecules that bind specific ligands. Nature. 1990;346:818. doi: 10.1038/346818a0. [DOI] [PubMed] [Google Scholar]
- 10.Tuerk C, Gold L. Systematic evolution of ligands by exponential enrichment: RNA ligands to bacteriophage T4 DNA polymerase. Science. 1990;249:505. doi: 10.1126/science.2200121. [DOI] [PubMed] [Google Scholar]
- 11.Zuker M. Mfold web server for nucleic acid folding and hybridization prediction. Nucleic Acids Res. 2003;31:3406. doi: 10.1093/nar/gkg595. [DOI] [PMC free article] [PubMed] [Google Scholar]
- 12.Information on materials and methods is available on Science Online.
- 13.Heim R, Cubitt AB, Tsien RY. Improved green fluorescence. Nature. 1995;373:663. doi: 10.1038/373663b0. [DOI] [PubMed] [Google Scholar]
- 14.Tsien RY. The green fluorescent protein. Annu. Rev. Biochem. 1998;67:509. doi: 10.1146/annurev.biochem.67.1.509. [DOI] [PubMed] [Google Scholar]
- 15.Shaner NC, et al. Improved monomeric red, orange and yellow fluorescent proteins derived from Discosoma sp. red fluorescent protein. Nat. Biotechnol. 2004;22:1567. doi: 10.1038/nbt1037. [DOI] [PubMed] [Google Scholar]
- 16.Bell AF, He X, Wachter RM, Tonge PJ. Probing the ground state structure of the green fluorescent protein chromophore using Raman spectroscopy. Biochemistry. 2000;39:4423. doi: 10.1021/bi992675o. [DOI] [PubMed] [Google Scholar]
- 17.Ponchon L, Dardel F. Recombinant RNA technology: the tRNA scaffold. Nat Methods. 2007;4:571. doi: 10.1038/nmeth1058. [DOI] [PubMed] [Google Scholar]
- 18.Paul CP, et al. Localized expression of small RNA inhibitors in human cells. Mol. Ther. 2003;7:237. doi: 10.1016/s1525-0016(02)00038-2. [DOI] [PubMed] [Google Scholar]
- 19.Thomas MG, Loschi M, Desbats MA, Boccaccio GL. RNA granules: The good, the bad and the ugly. Cell. Signal. 2010 doi: 10.1016/j.cellsig.2010.08.011. [DOI] [PMC free article] [PubMed] [Google Scholar]
- 20.Kedersha NL, Gupta M, Li W, Miller I, Anderson P. RNA-binding proteins TIA-1 and TIAR link the phosphorylation of eIF-2 alpha to the assembly of mammalian stress granules. J. Cell Biol. 1999;147:1431. doi: 10.1083/jcb.147.7.1431. [DOI] [PMC free article] [PubMed] [Google Scholar]
- 21.Wu L, et al. Novel small-molecule inhibitors of RNA polymerase III. Eukaryot. Cell. 2003;2:256. doi: 10.1128/EC.2.2.256-264.2003. [DOI] [PMC free article] [PubMed] [Google Scholar]
- 22.Murdoch K, Loop S, Rudt F, Pieler T. Nuclear export of 5S rRNA-containing ribonucleoprotein complexes requires CRM1 and the RanGTPase cycle. Eur. J. Cell Biol. 2002;81:549. doi: 10.1078/0171-9335-00271. [DOI] [PubMed] [Google Scholar]
- 23.Tyagi S. Imaging intracellular RNA distribution and dynamics in living cells. Nat Methods. 2009 doi: 10.1038/nmeth.1321. [DOI] [PubMed] [Google Scholar]
- 24.Heim R, Prasher DC, Tsien RY. Wavelength mutations and posttranslational autoxidation of green fluorescent protein. Proc Natl Acad Sci USA. 1994;91:12501. doi: 10.1073/pnas.91.26.12501. [DOI] [PMC free article] [PubMed] [Google Scholar]
- 25.Chen K-Y, et al. Ortho green fluorescence protein synthetic chromophore; Excited-state intramolecular proton transfer via a seven-membered-ring hydrogen-bonding system. J. Am. Chem. Soc. 2007;129:4534. doi: 10.1021/ja070880i. [DOI] [PubMed] [Google Scholar]
- 26.Davis J, Szostak J. Isolation of high-affinity GTP aptamers from partially structured RNA libraries. Proc Natl Acad Sci USA. 2002;99:11616. doi: 10.1073/pnas.182095699. [DOI] [PMC free article] [PubMed] [Google Scholar]
- 27.Stewart W. Synthesis of 3, 6-disulfonated 4-aminonaphthalimides. J. Am. Chem. Soc. 1981 [Google Scholar]
- 28.Anderson M, et al. Pairs of violet-light-excited fluorochromes for flow cytometric analysis. Cytometry. 1998;33:435. doi: 10.1002/(sici)1097-0320(19981201)33:4<435::aid-cyto7>3.0.co;2-1. [DOI] [PubMed] [Google Scholar]
- 29.Olmsted J. Calorimetric determinations of absolute fluorescence quantum yields. J. Phys. Chem. 1979 [Google Scholar]
- 30.Dugave C, Demange L. Cis-trans isomerization of organic molecules and biomolecules: Implications and applications. Chem. Rev. 2003;103:2475. doi: 10.1021/cr0104375. [DOI] [PubMed] [Google Scholar]
- 31.Ippen E, Shank C, Bergman A. Picosecond recovery dynamics of malachite green. Chem Phys Lett. 1976;38:611. [Google Scholar]
- 32.Kim S, Fleming G. Reorientation and isomerization of trans-stilbene in alkane solutions. J. Phys. Chem. 1988;92:2168. [Google Scholar]
- 33.Nagele T, Hoche R, Zinth W, Wachtveitl J. Femtosecond photoisomerization of cis-azobenzene. Chem Phys Lett. 1997;272:489. [Google Scholar]
- 34.Sension R, Repinec S, Szarka A, Hochstrasser R. Femtosecond laser studies of the cis-stilbene photoisomerization reactions. J. Chem. Phys. 1993;98:6291. [Google Scholar]
- 35.Sundstrom V, Gillbro T. Viscosity-dependent isomerization yields of some cyanine dyes - a picosecond laser spectroscopy study. J. Phys. Chem. 1982;86:1788. [Google Scholar]
- 36.Baffour-Awuah N, Zimmer M. Hula-twisting in green fluorescent protein. Chem Phys. 2004;303:7. [Google Scholar]
- 37.Zapata-Hommer O, Griesbeck O. Efficiently folding and circularly permuted variants of the Sapphire mutant of GFP. BMC Biotechnol. 2003;3:5. doi: 10.1186/1472-6750-3-5. [DOI] [PMC free article] [PubMed] [Google Scholar]
- 38.London RE. Methods for measurement of intracellular magnesium: NMR and fluorescence. Annu. Rev. Physiol. 1991;53:241. doi: 10.1146/annurev.ph.53.030191.001325. [DOI] [PubMed] [Google Scholar]
- 39.Srisawat C, Goldstein IJ, Engelke DR. Sephadex-binding RNA ligands: rapid affinity purification of RNA from complex RNA mixtures. Nucleic Acids Res. 2001;29:E4. doi: 10.1093/nar/29.2.e4. [DOI] [PMC free article] [PubMed] [Google Scholar]
Associated Data
This section collects any data citations, data availability statements, or supplementary materials included in this article.
Supplementary Materials
Supplementary Information