Tbx1 is a negative modulator of Mef2c (original) (raw)
Abstract
The developmental role of the T-box transcription factor Tbx1 is exquisitely dosage-sensitive. In this study, we performed a microarray-based transcriptome analysis of E9.5 embryo tissues across a previously generated Tbx1 mouse allelic series. This analysis identified several genes whose expression was affected by Tbx1 dosage. Interestingly, we found that the expression of the gene encoding the cardiogenic transcription factor Mef2c was negatively correlated to Tbx1 dosage. In vivo data revealed Mef2c up-regulation in the second heart field (SHF) of Tbx1 null mutant embryos compared with wild-type littermates at E9.5. Conversely, Mef2c expression was decreased in the SHF and in somites of Tbx1 gain-of-function mutants. These results are consistent with the described role of Tbx1 in suppressing cardiac progenitor cell differentiation and indicate also a negative effect of Tbx1 on Mef2c during skeletal muscle differentiation. We show that Tbx1 occupies conserved regulatory regions of the Mef2c locus, suggesting a direct effect on Mef2c transcription. However, we also show that Tbx1 interferes with the Gata4→ Mef2c regulatory pathway. Overall, our study uncovered a target of Tbx1 with critical developmental roles, so highlighting the power of the dosage gradient approach that we used.
INTRODUCTION
The T-box transcription factor TBX1 is encoded by the main gene haploinsufficient in DiGeorge syndrome, which is characterized by congenital heart defects, hypo/aplasia of the parathyroid and thymus glands, craniofacial dysmorphism as well as learning and behavioral abnormalities (1–5). Mutation of murine Tbx1 can model the DiGeorge syndrome phenotype (6–8). A progressive dosage reduction in Tbx1 mRNA is associated with the non-linear increase in phenotypic severity (9) while over-expression of Tbx1 results in structural heart and thymic defects (10), confirming that Tbx1 function, during embryonic development, is exquisitely dosage-sensitive. Uncovering the genetic and phenotypic changes resulting from Tbx1 haploinsufficiency might help dissection of molecular mechanisms underlying the DiGeorge syndrome etiology.
Loss of Tbx1 is associated with reduced proliferation and premature differentiation in the second heart field (SHF) (11–14). Accordingly, Fgf8 and Fgf10 were down-regulated in Tbx1_−/_− mutants (13,15,16) while genes required for myocardial differentiation (like Raldh2, Gata4 and Tbx5) were ectopically expressed (13).
The mechanisms by which Tbx1 regulates its targets are not all clear; there are now examples of transcription-dependent and transcription-independent actions. For example, in vitro and in vivo evidences show that Tbx1 positively regulates expression of the Vegfr3 gene through interaction with a T-box-binding element (TBE) (17), as expected for T-box transcription factors.
On the other hand, it is also clear that Tbx1 can function in a transcription-independent manner. Indeed, Tbx1 is able to negatively regulate the bone morphogenic protein–Smad1 pathway by binding Smad1 and thus preventing the Smad1–Smad4 interaction (18), which is required for the activation of Smad1 target genes (19).
Furthermore, Tbx1 can interact with the serum response factor (Srf) and promote its proteasome-mediated degradation (17), which, in turn, results in cardiac actin and α-smooth muscle actin protein down-regulation (17,20,21). This non-transcriptional interaction, although not yet completely clarified, probably contributes to the inhibition of cardiomyocyte differentiation observed in vivo (13,14).
In this study, starting from microarray-based gene expression data, collected across an allelic series of Tbx1 embryo mutants, we found that Tbx1 negatively modulates Mef2c through several mechanisms.
Mef2c belongs to the MEF2 (myocyte-specific enhancer-binding factor 2) subfamily of MADS [MCM1 (Minichromosome Maintenance 1 Protein), AG (Agamous), DEFA (Deficiens) and SRF (Serum Response Factor)] transcription factors (22). Mef2 genes are expressed in cardiac, smooth and skeletal muscle cells, endothelial cells as well as in a restricted set of other tissues (23–25). Targeted inactivation of the Mef2c gene in the mouse resulted in cardiac and vascular defects and embryonic lethality at E9.5 (26–28). In particular, in Mef2c_−/_− mice, the heart tube does not undergo looping morphogenesis, the future right ventricle does not form and several cardiac muscle genes are down-regulated. These data indicate a key role of Mef2c in the transcriptional pathways controlling myocyte differentiation.
We provide in vivo and in vitro data, indicating that Tbx1 plays an inhibitory role onto the Gata4→Mef2c regulatory pathway, and we propose that this is a mechanism by which Tbx1 affects muscle cell differentiation.
Our data also highlight the power of multiallelic gene expression analysis as a tool to identify developmentally critical genes that correlate genotype-dependent phenotypic changes to genome-wide transcriptional features.
RESULTS
Identification of Tbx1 dosage-sensitive transcripts
We have previously generated a series of genotypes associated with a nearly continuous variation of Tbx1 mRNA dosage between 0 and 100% of the wild-type (wt) level by combining two different hypomorphic alleles, Tbx1Neo2 and Tbx1Neo, and a null allele, Tbx1− (9). To identify Tbx1 dosage-dependent genes in vivo, we performed a microarray-based transcriptome analysis across the allelic series; RNA isolated from whole E9.5 embryos with nine different genotypes (9) was hybridized to Affymetrix GeneChip Mouse Genome 430 2.0 arrays. For each genotype, we used two embryos, each hybridized to one array; thus, we analyzed a total of 18 arrays (the whole set of results has been deposited in NCBI's Gene Expression Omnibus and is accessible through GEO Series accession number GSE33064; http://www.ncbi.nlm.nih.gov/geo/query/acc.cgi?token=rxiphqgaeyioipy&acc=GSE33064).
We developed a data analysis strategy to identify genes that respond significantly to dosage variation of Tbx1 mRNA (see Materials and Methods) and we found 2230 transcripts with significant differential expression (Supplementary Material, Table S1). At a second filtering step (see Materials and Methods), we narrowed down the list to 497 transcripts (in addition to Tbx1) differentially expressed across the allelic series (Supplementary Material, Table S2). Among these genes, we found very limited overlaps with previously reported gene lists derived from Tbx1 mutants (13,29); these genes are highlighted in green color in Supplementary Material, Table S2. However, those studies were carried out using different developmental stages and different experimental approaches that did not use allelic series.
We applied a Gene Ontology (GO) search to the more stringent data set using DAVID (30,31) and found 14 GO categories that are significantly enriched (Supplementary Material, Table S3).
We also carried out a cluster analysis that returned four main clusters (Fig. 1). Cluster 2 includes Tbx1 and transcripts that have an expression trend similar to Tbx1 across genotypes. Cluster 3 behaves in an opposite way as transcripts in this group tend to be more expressed as Tbx1 expression goes down. Clusters 1 and 4, which are also the richest in transcripts (see Supplementary Material, Table S4, for transcript content of clusters), are very different and have somewhat complementary patterns. In these two clusters, there appears to be a threshold-like effect at dosages between experimental points 4 and 5, corresponding to genotypes Tbx1+/− and Tbx1Neo2/Neo2, which are associated with a small overall difference in Tbx1 RNA dosage (10–15%) (9), but genetically, they have an important difference, i.e. the former has an intact wt allele and the latter has none. How this genetic difference can translate into the expression patterns represented in Clusters 1 and 4 remains to be investigated.
Figure 1.

Cluster analysis of differentially expressed genes across the allelic series. Lines represent the average profile of each cluster and the shaded areas represent the error (SD). Profiles were obtained by plotting the log ratios of all dosage points with respect to the control (wt) point for all genes, and then, the average profile, for each cluster, was determined. Tbx1 profile in Cluster 2 is highlighted by black circles. The transcript content of each cluster is listed on Supplementary Material, Table S4.
Tbx1 negatively regulates Mef2c expression
Among the 497 differentially expressed genes, we noted that Mef2c expression increased as Tbx1 dosage decreased (similarly to Cluster 3 of Fig. 1; Supplementary Material, Table S2). Mef2c is important for heart development and cardiomyocyte differentiation. The heart of Mef2c homozygous mutant mice does not undergo looping and has gross abnormalities in the outflow tract, while the right ventricle fails to form (28), suggesting a key role for Mef2c in SHF development. In particular, it regulates transcriptional pathways controlling differentiation. So, the negative modulation of Mef2c expression by Tbx1 could contribute to explain the role of Tbx1 in suppressing cell differentiation (14).
We confirmed Mef2c up-regulation in Tbx1_−/_− embryos by quantitative real-time reverse transcriptase–polymerase chain reaction (qRT–PCR) of mRNA from E9.5 whole embryos (Fig. 2A). In addition, in situ hybridization (ISH) on embryo cryosections at E9.5 revealed up-regulation and ectopic expression of Mef2c in the SHF of Tbx1_−/_− mutants (Fig. 2F–I) compared with wt littermates (Fig. 2B–E). If Mef2c expression is Tbx1 dosage-dependent in vivo, we expected to observe a Mef2c down-regulation in Tbx1 gain-of-function mutants. Whole-mount ISH was performed on COET;Mesp1Cre/+ embryos at E9.5; the COET (for Conditional Over-Expression of Tbx1) transgene expresses Tbx1 mRNA in response to Cre recombination (10). Mesp1Cre drives Tbx1 expression in mesodermal domains of the pharynx, head mesenchyme and splanchnic mesoderm (Fig. 3A–D). Whole-mount ISH showed a strong reduction in Mef2c somite expression in COET;Mesp1Cre/+ embryos (arrowheads in Fig. 3E and H) and a mild Mef2c down-regulation in the SHF (ovals in Fig. 3G and L) or splanchnic mesoderm (arrows in Fig. 3E, H, F and I). This different effect upon Mef2c expression in different tissues may be due to biological reasons (different mechanisms of regulation in different tissues) or to technical reasons (e.g. different levels of expression of the COET transgene or different efficiency of Cre-mediated excision). We confirmed that Mef2c expression is Tbx1 dosage-dependent using qRT–PCR of mRNA from C2C12 myoblasts transfected with different amounts of a _Tbx1_-expressing vector (pCDNA-Tbx1-c-myc) (Fig. 4A and B). Western blotting (WB) analysis of nuclear protein extracts from transfected C2C12 cells with an anti-Mef2c antibody confirmed negative regulation at a protein level, too (Fig. 4C).
Figure 2.

Mef2c is up-regulated in Tbx1 loss-of-function mutants. (A) qRT–PCR analysis showed Mef2c up-regulation in _Tbx1_-null mutant embryos compared with wt littermates at E9.5. Values are means ± standard error (SE), _n_= 3, *P < 0.05. (B–I) Mef2c is up-regulated (arrows) and ectopically expressed (arrowheads) in the SHF of Tbx1_−/_− mutants (G and I) compared with wt littermates at E9.5 (C and E), as shown by section ISH. (C and E) and (G and I) are high-magnification views of the same wt (B and D) and mutant sections (F and H) respectively.
Figure 3.

Mef2c is down-regulated in Tbx1 gain-of-function mutants. (A–L) Left- and right-side views of whole wt (A, B and E–G) and COET; Mesp1Cre/+ mutants (C, D, H, I and L) at E9.5. Tbx1 is over-expressed in the mesodermal domains of the pharynx, head mesenchyme and splanchnic mesoderm of COET; Mesp1Cre/+ mutants (C and D) compared with wt littermates (A and B). Mef2c is mildly down-regulated in the SHF (ovals in G and L) and splanchnic mesoderm (arrows in E, F, H and I), and more extensively in the somites (arrowheads in E and H) of COET; Mesp1Cre/+ mutants (H, I and L) compared with wt littermates (E, F and G).
Figure 4.

Tbx1 negatively regulates Mef2c expression in C2C12 myoblasts. (A–C) Mef2c mRNA and Mef2c protein levels are affected by Tbx1 dosage in transfected C2C12 myoblasts as confirmed by qRT–PCR (A and B) and WB analysis (C). (D) qRT–PCR analysis showed Tbx1-dependent inhibition of Mef2c up-regulation during in vitro C2C12 myoblast differentiation. Values are means ± SE, _n_= 3, *P < 0.05.
Tbx1 interferes with Mef2c expression and muscle cell differentiation
We tested the response of Mef2c expression to Tbx1 dosage during skeletal muscle differentiation. C2C12 myoblasts can be induced to differentiate, in vitro, by switching culture conditions from a medium supplemented with 10% fetal bovine serum to a medium supplemented with 2% horse serum (32). Under these conditions, we observed an increased expression of myogenic markers MyoD and myogenin at day 2 of differentiation (data not shown). Also Mef2c expression was increased at day 2 and, interestingly, transfected Tbx1 inhibited this up-regulation (Fig. 4D). These data are consistent with those obtained in vivo with the gain-of-function model (Fig. 3E–L) and suggest that Tbx1 may inhibit skeletal muscle differentiation through Mef2c down-regulation. To further support this hypothesis, we transfected C2C12 cells with Tbx1, let them differentiate for 5 days and test different skeletal muscle differentiation markers by qRT–PCR. Results showed that while Myogenin did not change in response to Tbx1 transfection, all the genes encoding muscle structural proteins tested (Myh1, 2, 8 and Acta1) were significantly down-regulated (Supplementary Material, Fig. S1). However, myotube formation did not appear to be grossly affected (data not shown).
Tbx1 inhibits Gata4- but not Isl1-induced up-regulation of Mef2c activity
To test the effects of Tbx1 upon Mef2c transcriptional activity, we performed luciferase assays using a MEF2 luciferase reporter construct (_des_MEF2-luc) on transfected C2C12 cells (33,34). With this reporter, luciferase activity is proportional to active MEF2 transcription factors. Mef2b is expressed at a very low level in these cells (data not shown); Mef2a and Mef2d are detectable, but their expression is not significantly affected by Tbx1 over-expression (Supplementary Material, Fig. S2). Luciferase activity increased in response to Gata4 or Isl1 transfection of C2C12 cells, confirming the ability of Gata4 and Isl1 to activate Mef2c transcription (35) also in this system (Fig. 5A and B). Transfection of a Tbx1 expression vector alone did not affect luciferase activity (Fig. 5A). However, co-transfection of Tbx1 and Gata4 showed that Tbx1 inhibited the ability of Gata4 to transactivate the reporter (Fig. 5C). In contrast, Tbx1 did not inhibit the Isl1-induced activation of the reporter (Fig. 5D), suggesting that Tbx1 may regulate Mef2c expression through a Gata4-dependent mechanism.
Figure 5.

Tbx1 inhibits Gata4-dependent activation of the MEF2 reporter construct in luciferase assays. (A and B) Gata4 and Isl1 are able to activate the MEF2 reporter construct in transfected C2C12 cells (A and B) while Tbx1 is not able to repress it (A). (C and D) Tbx1 is able to contrasts Gata4- (C) but not Isl1-dependent activation of the MEF2 reporter construct (D). Luciferase activity was normalized to β-galactosidase activity. Values are means ± SE, _n_= 3, *P < 0.05.
It has been shown that Gata4 is up-regulated in Tbx1_−/_− mutants (13). We analyzed Gata4 expression at E8.5 and E9.5 by whole-mount ISH on control and COET;Mesp1Cre/+ mutant embryos, and we found a marked Gata4 down-regulation in COET;Mesp1Cre/+ mutant hearts (Fig. 6C and D) compared with control embryos (Fig. 6A and B), thus confirming that Tbx1 can negatively affect Gata4 expression. Since Mef2c is regulated by Gata4 (13), one can argue that reduced Mef2c expression observed in our experiments is merely the result of Gata4 down-regulation by Tbx1. However, this is unlikely since we performed our luciferase assays on cells transfected with a Gata4 expression vector, which is not regulated by Tbx1. Indeed, co-transfection of Tbx1 did not affect the amount of protein produced by the Gata4 expression vector (Supplementary Material, Fig. S3).
Figure 6.
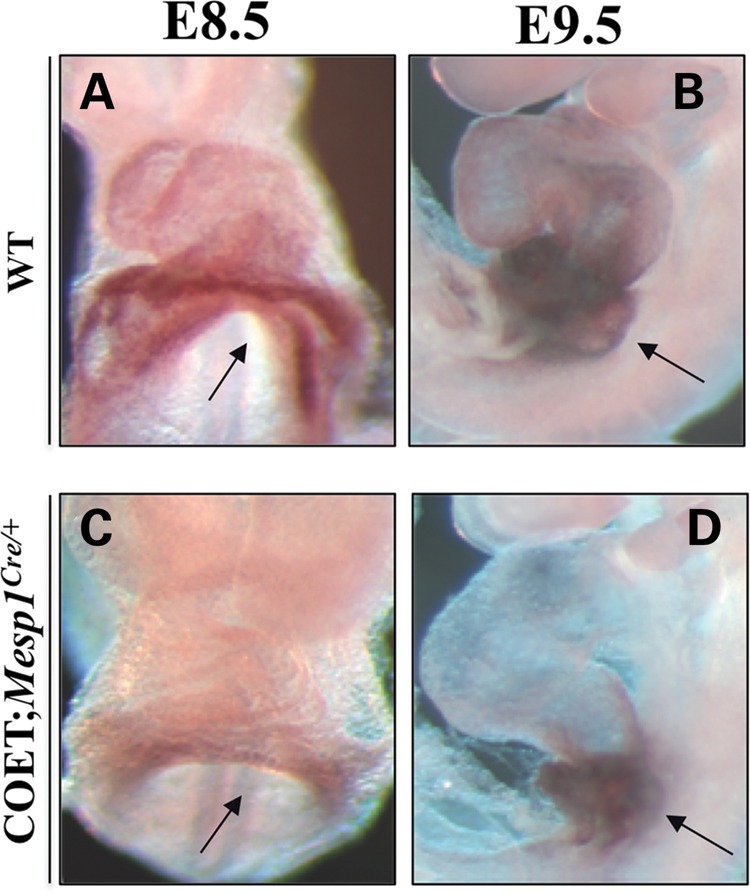
Tbx1 affects Gata4 expression in vivo. (A–D) Whole-mount ISH showing Gata4 down-regulation in the heart of COET; Mesp1Cre/+ mutant embryos (C and D) compared with wt (A and B) littermates at E8.5 and E9.5. Arrows indicate the inflow region of the heart.
Gata4 is required for Tbx1-induced regulation of Mef2c in C2C12 cells
The previous experiments support the existence of a Tbx1-|Gata4→Mef2c pathway, but this is not sufficient to explain all our data. To test whether Tbx1 regulates Mef2c transcription through a mechanism involving Gata4, we evaluated the response of Mef2c to Tbx1 in the absence of Gata4. C2C12 myoblasts express endogenous Gata4, so, using _Gata4_-specific siRNAs, we knocked down the mRNA and protein levels to ∼20% of the wt level (Fig. 7A and B). Gata4 knockdown was associated with down-regulation of Mef2c to ∼80% of the wt level (Fig. 7C). Transfection of Tbx1 (Fig. 7D) did not result in further significant reduction in Mef2c expression (Fig. 7C), suggesting that Gata4 is required for Tbx1-induced down-regulation of Mef2c.
Figure 7.

Gata4 is required for Mef2c repression by Tbx1 in C2C12 myoblasts. (A and B) siRNA-mediated knockdown of Gata4 results in a reduction in mRNA and protein levels to ∼20% of the wt level, as confirmed by qRT–PCR (A) and WB analysis (B). (C and D) qRT–PCR showed that Gata4 knockdown and Tbx1 over-expression result, independently, in Mef2c down-regulation (C and D and Fig. 4A and B). In the absence of Gata4, over-expression of Tbx1 does not result in further reduction in Mef2c expression (C). Values are means ± SE, _n_= 3, *P < 0.05.
Tbx1 occupies conserved regions of the Mef2c gene
We performed a bioinformatic analysis to look for potential TBEs evolutionary conserved between the human and the mouse, in the Mef2c locus (see Materials and Methods). One of the putative TBEs that we have identified resides in a skeletal muscle-specific control region (36) upstream of Mef2c (Supplementary Material, Fig. S4A).
We also found a putative TBE in a conserved SHF-specific enhancer (Supplementary Material, Fig. S4B), previously described by Dodou et al. (35).
Chromatin immunoprecipitation (ChIP) experiments on C2C12 cells revealed that endogenous Tbx1 occupies both these sites (Fig. 8), suggesting that it may have a direct role in Mef2c transcriptional regulation.
Figure 8.

Endogenous Tbx1 binds conserved regulatory regions in the Mef2c locus. Small panel top-right: WB analysis of C2C12 nuclear extracts using an anti-Tbx1 antibody demonstrating endogenous expression of the protein. Graph: chromatin immunoprecipitation analysis of the Mef2c skeletal muscle and SHF TBEs performed in C2C12 myoblasts using an antibody against Tbx1 together with rabbit IgG as the background control. qRT–PCR analysis of an immunoprecipitated material was performed and percent of input for each sample is reported in the graph. Values are means ± SD, _n_= 3.
Next, we carried out luciferase assays using a reporter construct carrying the SHF enhancer (SHF-Enh-Luc; Fig. 9A) to test its response to Tbx1 in C2C12 cells. The enhancer responded to transfected Isl1 and Gata4 but not to transfected Tbx1 alone (Fig. 9B). In addition, as shown in the experiment with the _des_MEF2 reporter, Tbx1 did not inhibit Isl1-induced activation, but did interfere with Gata4-induced activation (Fig. 9C and D). The mutation of the TBE site resulted in a significant reduction in the response to Gata4 and in a milder, but still significant response to Tbx1 co-transfection (Fig. 9D). Thus, in this assay, the TBE is not completely required for Tbx1 to carry out its negative effect upon Gata4 activation, although this effect appears to be milder.
Figure 9.

Response of the Mef2c SHF enhancer to Tbx1 expression in luciferase assays. (A) Scheme of the Mef2c SHF enhancer–luciferase construct. The sequence of the mutant TBE is indicated. (B) The enhancer responds well to graded amounts of transfected Isl1 and Gata4 but not to Tbx1. (C) Tbx1 does not significantly affect Isl1-induced activation of the enhancer. (D) Luciferase assay using a wt (black bars) or mutated (white bars) SHF enhancer. In both cases, Tbx1 can reduce Gata4-induced activation of the enhancer. However, the mutant SHF responds less well to Gata4, and Tbx1 inhibition is less obvious. Luciferase activity was normalized to β-galactosidase activity. Values are means ± SE, n = 3, *P < 0.05.
DISCUSSION
Dosage of Tbx1 correlates well (though often not linearly) to phenotypic severity in vivo (9). With this work, we initiated an effort to correlate phenotypic changes with genome-wide transcriptional analysis, in order to identify candidate effectors that may be closely correlated with different phenotypic features. The experimental approach used here has some limitations, e.g. the whole embryo RNA analysis might smooth out or even hide tissue-specific changes of expression. In addition, stage-specific differences cannot be detected by our single-stage analysis. Nevertheless, our study was sufficient to identify a relatively subtle expression modulation of the Mef2c gene, which encodes a transcription factor critical in cardiac differentiation. In vivo and in vitro gain- and loss-of-function studies confirmed the negative correlation between Tbx1 and Mef2c expression. This finding is consistent with the previously determined ability of Tbx1 to inhibit cardiomyocyte differentiation in vivo and in vitro (14). Our study also indicates that Tbx1 over-expression has inhibitory effects upon Mef2c expression during skeletal muscle differentiation.
We asked how Tbx1 down-regulates Mef2c expression. Our data suggest three, non-mutually exclusive, mechanisms (Fig. 10). One is direct interaction with the Mef2c gene (Fig. 10), as suggested by occupation of two TBE sites by Tbx1. The consequences of this interaction remain to be investigated, but they may be chromatin changes leading to transcriptional down-regulation. Our luciferase assay with a mutated TBE in the SHF resulted in very limited reduction in the capacity of Tbx1 to inhibit enhancer activity. However, because enhancer constructs are not properly chromatinized and are out of the normal context of the endogenous gene, it is difficult to draw conclusions from these data.
Figure 10.

Schematic model of Mef2c regulation by Tbx1. Our data suggest three, non-mutually exclusive, mechanisms: (i) direct transcriptional regulation of Mef2c by Tbx1; (ii) negative regulation of Gata4 expression and (iii) interference with Gata4-dependent activation of Mef2c (double-dashed line).
The second mechanism is mediated by a repressive effect of Tbx1 upon Gata4 gene expression (Fig. 10), as seen in vivo (13) (data presented here). This mechanism is supported by tissue culture data, showing that silencing Gata4 suppresses the ability of Tbx1 to down-regulate Mef2c in C2C12 cells. This effect would have negative consequences upon the expression of Mef2c because this gene is a target of Gata4. However, our _des_MEF2 reporter data indicate that Tbx1 is able to inhibit reporter activation in the presence of transfected Gata4, and in this scenario, the transcriptional regulation of the Gata4 gene is irrelevant. It is more likely that Tbx1 interferes negatively upon the ability of the Gata4 protein to regulate Mef2c (Fig. 10). The third mechanism is also compatible with the results obtained by Gata4 knockdown (Fig. 7). Tbx20 synergizes with Gata4 (and Isl1) to activate both the Mef2c and Nkx2.5 SHF enhancers (37); Tbx1 may compete with another T-box protein and inhibit this synergy. Interestingly, in our luciferase assay with the SHF enhancer, the mutation of the TBE site significantly reduced the ability of Gata4 to activate the enhancer. This might be because of an endogenous T-box protein that synergizes with Gata4 in C2C12 cells. However, this is not Tbx20, as the gene encoding it is not expressed in these cells (our unpublished data). In addition, Gata4 and Tbx5 co-immunoprecipitate and cooperatively transactivate a luciferase atrial natriuretic factor reporter (38). However, Tbx1 does not co-immunoprecipitate with Gata4 in C2C12 cells (data not shown). Of note, co-transfection experiments showed the ability of Nkx2-5 and GATA4 to transactivate the minimal Cx40 promoter, while Tbx5 repressed Nkx2-5/GATA4-mediated activation (39), demonstrating that T-box transcription factors could activate or repress transcription, depending on the specific context.
In summary, our results illustrate the power of multiallelic gene expression analysis as it identified a relatively subtle regulation of a gene encoding a developmentally critical transcription factor. The mechanisms by which Tbx1 regulates Mef2c expression appear to be complex and include direct interaction with the gene, regulation of Gata4 expression, which in turn regulates Mef2c, and possibly interference with the Gata4 protein ability to regulate Mef2c.
The identification of the negative regulation of Mef2c by Tbx1 provides an additional clue as to how Tbx1 carries out its negative modulation of cardiomyocyte differentiation and provides a new link in the genetic network operating in cardiac progenitor cells.
MATERIALS AND METHODS
Mouse lines, breeding and genotyping
All the mouse mutant alleles used in this study have been previously reported: Tbx1− (7), Tbx1Neo (11), Tbx1Neo2 (12), COET (10) and Mesp1Cre (40). The COET transgene (10) upon Cre-mediated recombination in average expresses a Tbx1 cDNA approximately twice as much as the level of one endogenous Tbx1 allele (10).
Various homozygous and compound heterozygous mutants were generated by heterozygous mutant mating. Embryos were collected at E8.5 and E9.5, considering the day of observation of a vaginal plug to be E0.5. Mice were genotyped by PCR as described in the original reports.
Cell lines, plasmids and transfections
Mouse C2C12 myoblasts (ATCC) were cultured in Dulbecco's modified Eagle's medium (DMEM, Invitrogen) supplemented with 10% fetal bovine serum (Hyclone) at 37°C with 5% CO2. To allow cells to differentiate, medium was changed to DMEM medium supplemented with 2% horse serum (Hyclone).
We have previously described the pCDNA-Tbx1-c-myc expression vector (11). The _des_MEF2-luc reporter construct (33) was kindly provided by Dr Eric N. Olson; the pCDNA3.1-Gata4-c-myc-His and pCDNA3.1-Ils1 were kindly provided by Dr Robert J. Schwartz.
The SHF-Enh-Luc reporter construct was generated by cloning the SHF minimal enhancer of the mouse Mef2c gene described by Dodou et al. (35) into the pGL3- Promoter Vector (Promega). The mutated SHF-Enh-Luc reporter construct was generated by substitution of three nucleotides in the conserved TBE of the original SHF-Enh-Luc reporter construct, using the QuikChange II Site- Directed Mutagenesis Kit (Stratagene) according to the manufacturer's instructions.
C2C12 cells were transiently transfected using the PolyFect Transfection Reagent (QIAGEN) according to the manufacturer's instructions; cells were collected 24 h after transfection for RNA or protein extraction.
For differentiation experiments, 24 h after transfection, medium was changed to differentiation medium and cells were collected at different days for RNA extraction.
Microarray-based gene expression analysis
Total RNA from E9.5 embryos with nine different genotypes (Tbx1+/+, Tbx1Neo2/+, Tbx1Neo/+, Tbx1+/−, Tbx1Neo2/Neo2, Tbx1Neo2/Neo, Tbx1Neo2/−, Tbx1Neo/Neo and Tbx1_−/_−) was isolated using TRIzol (Invitrogen) and cleaned using the RNeasy cleanup Kit (QIAGEN) according to the manufacturer's instructions. Procedures for cRNA preparation and GeneChip processing were performed at Boston University Microarray Resource Facility exactly as described in the Affymetrix GeneChip Expression Analysis Technical Manual (Affymetrix, Santa Clara, CA, USA, current version available at www.affymetrix.com). Briefly, total RNA integrity was verified using RNA 6000 Nano Assay RNA chips run in Agilent 2100 Bioanalyzer (Agilent Technologies). Total RNA was reverse transcribed using One Cycle cDNA Synthesis kit (Affymetrix) and the obtained double-stranded cDNA was purified with GeneChip Sample Cleanup Module (Affymetrix). cDNA was used as a template for in vitro transcription using GeneChip in vitro transcription (IVT) Labeling Kit (Affymetrix). The obtained biotin-labeled cRNA was purified using GeneChip Sample Cleanup Module (Affymetrix), fragmented and hybridized (10 μg) to the GeneChip Mouse 430 2.0 microarrays (Affymetrix) for 16 h in GeneChip Hybridization oven 640 at 45°C. For each genotype, we used two biological replicates, each hybridized to one array, with a total of 18 arrays. IVT and cRNA fragmentation quality controls were carried out by running an mRNA Nano assay in the Agilent 2100 Bioanalyzer. The hybridized samples were washed and stained using Affymetrix fluidics station 450 with streptavidin-R-phycoerythrin (SAPE) and the signal was amplified using a biotinylated goat anti-streptavidin antibody followed by another SAPE staining (Hybridization, Washing and Staining Kit, Affymetrix). Microarrays were immediately scanned using Affymetrix GeneArray Scanner 3000 7G Plus (Affymetrix). The data were analyzed with the Bioconductor package ‘Affy’ using Robust Multiarray Average method for normalizing and summarizing probe level intensity measurements.
Statistical analysis of microarray data
We developed a strategy for statistical comparison of chip data aimed at identifying genes that responded to variations of Tbx1 dosage. To discover which genes responded significantly, we computed the log ratio of all dosage points with respect to the control (wt) point for all genes. After this, we used a two-step filtering: in the first step, we made the assumption that if a gene is not responding to the dosage variation, then the area under the gene profile curve should be close to zero. We approximated this area by summing the square of the relative expression levels of all genes. Under the null hypothesis that a gene is not responding in the dosage series, this area should be close to zero, otherwise it should be higher. We approximated the area distribution with an exponential probability density function with the mean equal to the average of the area of all transcripts in the microarray. By using a _P_-value of 0.05, we selected a list of 2230 transcripts, including Tbx1 (Supplementary Material, Table S1).
In the second step, we performed a more stringent test based on a Bayesian analysis of signals (41). This fully Bayesian approach allowed us to automatically identify and rank 497 differentially significant genes, whose expression is sensitive to Tbx1 dosage (Supplementary Material, Table S2).
GO and cluster analyses
GO analysis (http://david.abcc.ncifcrf.gov/) was performed to identify specific biological pathways enriched in the list of 498 differentially expressed genes. The most significant terms included regulation of metabolic processes and regulation of gene expression (false discovery rate < 0.05).
Hierarchical clustering was performed on the list of 498 differentially expressed genes using the MATLAB software (http://www.mathworks.it/help/toolbox/stats/bq_679x-3.html#bq_6_ia). Four main clusters were identified and, for each cluster, we calculated the average profile and the associated standard deviation (SD).
TBE search
Upstream and intronic genomic sequences for human and mouse Mef2c were obtained from both the Ensembl and UCSC Genome Browser web sites and were aligned using the multisequence local alignment tool MULAN (http://mulan.dcode.org/). No specific Tbx1-binding consensus sequence has been identified so far; however, Tbx1 can activate, in vitro, the Fgf10 promoter, through a conserved Tbx5-binding site (11). Multi-TF (http://multitf.dcode.org) transcription factor-binding site analysis was performed to find evolutionary conserved Tbx5-binding elements, in the aligned sequences. With this approach, we uncovered several TBEs in the Mef2c locus.
Quantitative real-time PCR
Total RNA was extracted from whole E9.5 wt and mutant embryos using TRIzol (Invitrogen) and from C2C12 using the RNeasy Mini Kit (QIAGEN). One microgram of total RNA was reverse transcribed using SuperScript III (Invitrogen) according to the manufacturer's instructions, in a total volume of 20 μl; the resulting cDNA was diluted 1:10. qRT–PCR was performed using SYBR Green for the detection of fluorescence during amplification. Each amplification reaction contained 25 μl of Platinum SYBR Green qPCR SuperMix-UDG (Invitrogen), 0.2 μg each of forward and reverse primers and 1 μl of diluted cDNA. All primers were designed with annealing temperatures of 58–62°C. PCR conditions were: 50°C for 2 min, 95°C for 10 min, 40 cycles of 95°C for 15 s, 60°C for 1 min and followed by a dissociation stage of 95°C for 15 s and 60°C for 15 s. All the genes were amplified on a 7900 HT Fast Real-Time PCR System (Applied Biosystems). PCR amplifications were performed in triplicate and at least three separate analyses were carried out for each gene. Melting curve analysis was performed after each run to check for the presence of non-specific PCR products and primer dimers. The qRT–PCR results, recorded as threshold cycle numbers (_C_t) were normalized using GAPDH as an internal control and analyzed using the comparative _C_t method ( method) (42,43).
In situ hybridization
Digoxigenin-labeled RNA probes were prepared by standard methods (Roche). Mef2c and Gata4 probes were kindly provided by Dr Brian L. Black. Embryos were dissected in di-ethylpolycarbonate (Sigma Aldrich)-treated phosphate-buffered saline (PBS) and fixed overnight in 4% paraformaldehyde–PBS (Sigma Aldrich) at 4°C.
For ISH on cryosections, embryos were cryoprotected with increasing concentrations of sucrose (Sigma Aldrich), treated with a mixture of 1 part 30% sucrose and 1 part OCT for at least 2 h at 4°C, embedded in OCT and cut to generate 10–12 μm sections. After post-fixation in 4% paraformaldehyde–PBS, sections were incubated in triethanolamine buffer (0.2% acetic acid and 1% triethanolamine, Sigma Aldrich) containing acetic anhydride and washed twice in PBS for 5 min. The sections were then prehybridized for 1 h at 70°C in the hybridization mixture (50% formamide from Sigma Aldrich, 5× saline-sodium citrate (SSC), salmon sperm DNA 40 μg/ml and 25 mg/ml yeast tRNA from Invitrogen). The probes were denatured for 5 min at 80°C and added to the hybridization mix (400 ng/ml). The hybridization reaction was carried out over night at 70°C; prehybridization and hybridization were performed in a box saturated with a 5× SSC–50% formamide solution to avoid evaporation. After incubation, the sections were washed twice with MABT (50 mm maleic acid, pH 7.5, 250 mm NaCl and 0.1% Tween-20, Sigma Aldrich), treated with MABT containing 10% sheep serum for 1 h at room temperature and then incubated with alkaline phosphatase-coupled anti-digoxigenin antibody (Roche) diluted 1:2000 in MABT containing 10% sheep serum, overnight at 4°C. The day after, sections were washed with MABT and equilibrated for 5 min in Buffer 3 (Tris–HCl 100 mm, NaCl 100 mm and MgCl2 50 mm, pH 9.5); color development was performed at room temperature (time depending on the amount of transcripts to be detected) in Buffer 3 containing nitro blue tetrazolium and 5-bromo-4-chloro-3-indolyl phosphate (Roche). Staining was stopped by a wash in PBS containing 0.1% Tween-20; sections were rehydrated for 5 min in deionized water and then dehydrated through successive baths of EtOH (70, 95 and 100%) and xylol, and mounted in Eukitt resin (O. Kindler GmbH & Co.).
Whole-mount ISH was performed according to the previously published methods (44). At least three somite staged wt and mutant embryos were analyzed with each probe.
Western blotting
Nuclear proteins were extracted as described previously (18). The following primary antibodies were used: rabbit anti-Tbx1 (Abcam, 1:1000), goat anti-Mef2c (Santa Cruz Biotechnology, 1:1000), rabbit anti-Gata4 (Santa Cruz Biotechnology, 1:1000), monoclonal anti-c-myc (Sigma-Aldrich 1:1000) and monoclonal anti-β-Actin (Sigma-Aldrich 1:10 000). The following secondary antibodies were used: horseradish peroxidase-conjugated (HRP) anti-rabbit and anti-mouse (GE Healthcare, 1:10 000) and HRP-conjugated anti-goat (Santa Cruz Biotechnology, 1:5000). The HRP-derived signal was detected using the Amersham ECL and ECL Plus Western Blotting Detection Reagents (GE Healthcare).
Luciferase assay
For luciferase assays, mouse C2C12 myoblasts were plated in 24-wells and transfected with PolyFect Transfection Reagent (QIAGEN) according to the manufacturer's instructions. The _des_MEF2-luc reporter construct and, for single experiments, the pCDNA-Tbx1-c-myc, pCDNA3.1-Gata4-c-myc-His and pCDNA3.1-Ils1 plasmids were always co-transfected with a pCMV-β-Gal expression vector (Clontech); at 24 h after transfection, cell extracts were prepared and activities of β-galactosidase and Firefly luciferase were measured using the Luciferase Assay System (Promega) and the Beta-Glo Assay System (Promega), respectively, on a GLOMAX 96 microplate luminometer (Promega). Relative luciferase activity (Firefly luciferase for reporter and β-galactosidase for normalization of transfection efficiency) was measured following manufacturer's instructions (Promega). The data represent the means and SDs of at least three independent transfections.
RNA interference
Gata4 interference in C2C12 myoblasts was achieved by using a set of four different siRNAs specifically directed against the mouse Gata4 locus (ON-TARGET plus SMART Pool, Thermo Scientific). As negative control, we used a pool of siRNAs that virtually targeted no mouse genes (ON-TARGET plus Negative Control, Thermo Scientific). Cells were plated in six wells and transfected with 50 nm/well of siRNAs using Lipofectamine 2000 (Invitrogen) according to the manufacturer's instructions. The Gata4 mRNA level was measured by qRT–PCR and the Gata4 protein level by WB as described above.
ChIP assay
ChIP assay was performed as described previously (45). Sonication was performed for 10 cycles of 15 s on and 60 s off using a Soniprep 150 (Measuring and Scientific Equipment). Immunoprecipitation was performed overnight at 4°C with an antibody against Tbx1 (Abcam, 4/100 μg of chromatin); normal rabbit immunoglobulin G (IgG) was used as the background control.
Results were quantified by qRT–PCR using the primers listed in Supplementary Material, Table S3, and the enrichment of DNA was calculated in terms of percent of input, as described previously (46). PCR amplifications were performed in triplicate from three independent experiments.
Statistical analysis
All data were expressed as means ± standard error or SD from three independent experiments. Differences between groups were examined for statistical analysis using a two-tailed Student's _t_-test. Values of P < 0.05 were considered significant.
SUPPLEMENTARY MATERIAL
Supplementary Material is available at HMG online.
FUNDING
This work was supported by the European Union (FP7 CardioGeNet project), the Italian Telethon Foundation (grant GGP11029) and the Italian Ministry of Research and Education (PRIN 2009J7F5WA 002 to A.B.). Funding to pay the Open Access publication charges for this article was provided by the Italian Telethon Foundation.
Supplementary Material
Supplementary Data
ACKNOWLEDGEMENTS
We thank Dr Eric N. Olson and Dr Robert J. Schwartz for reagents. We thank Wei Wen for technical assistance with in situ hybridization experiments, the Core Facilities of the Institute of Genetics and Biophysics (Integrated Microscopy and Mouse Transgenic) for support and the Boston University Microarray Resource Facility.
Conflict of Interest statement. None declared.
REFERENCES
- 1.Yagi H., Furutani Y., Hamada H., Sasaki T., Asakawa S., Minoshima S., Ichida F., Joo K., Kimura M., Imamura S., et al. Role of TBX1 in human del22q11.2 syndrome. Lancet. 2003;362:1366–1373. doi: 10.1016/s0140-6736(03)14632-6. [DOI] [PubMed] [Google Scholar]
- 2.Stoller J.Z., Epstein J.A. Identification of a novel nuclear localization signal in Tbx1 that is deleted in DiGeorge syndrome patients harboring the 1223delC mutation. Hum. Mol. Genet. 2005;14:885–892. doi: 10.1093/hmg/ddi081. [DOI] [PubMed] [Google Scholar]
- 3.Paylor R., Glaser B., Mupo A., Ataliotis P., Spencer C., Sobotka A., Sparks C., Choi C.H., Oghalai J., Curran S., et al. Tbx1 haploinsufficiency is linked to behavioral disorders in mice and humans: implications for 22q11 deletion syndrome. Proc. Natl Acad. Sci. USA. 2006;103:7729–7734. doi: 10.1073/pnas.0600206103. [DOI] [PMC free article] [PubMed] [Google Scholar]
- 4.Torres-Juan L., Rosell J., Morla M., Vidal-Pou C., Garcia-Algas F., de la Fuente M.A., Juan M., Tubau A., Bachiller D., Bernues M., et al. Mutations in TBX1 genocopy the 22q11.2 deletion and duplication syndromes: a new susceptibility factor for mental retardation. Eur. J. Hum. Genet. 2007;15:658–663. doi: 10.1038/sj.ejhg.5201819. [DOI] [PubMed] [Google Scholar]
- 5.Zweier C., Sticht H., Aydin-Yaylagul I., Campbell C.E., Rauch A. Human TBX1 missense mutations cause gain of function resulting in the same phenotype as 22q11.2 deletions. Am. J. Hum. Genet. 2007;80:510–517. doi: 10.1086/511993. [DOI] [PMC free article] [PubMed] [Google Scholar]
- 6.Jerome L.A., Papaioannou V.E. DiGeorge syndrome phenotype in mice mutant for the T-box gene, Tbx1. Nat. Genet. 2001;27:286–291. doi: 10.1038/85845. [DOI] [PubMed] [Google Scholar]
- 7.Lindsay E.A., Vitelli F., Su H., Morishima M., Huynh T., Pramparo T., Jurecic V., Ogunrinu G., Sutherland H.F., Scambler P.J., et al. Tbx1 haploinsufficiency in the DiGeorge syndrome region causes aortic arch defects in mice. Nature. 2001;410:97–101. doi: 10.1038/35065105. [DOI] [PubMed] [Google Scholar]
- 8.Merscher S., Funke B., Epstein J.A., Heyer J., Puech A., Lu M.M., Xavier R.J., Demay M.B., Russell R.G., Factor S. TBX1 is responsible for cardiovascular defects in velo-cardio-facial/DiGeorge syndrome. Cell. 2001;104:619–629. doi: 10.1016/s0092-8674(01)00247-1. [DOI] [PubMed] [Google Scholar]
- 9.Zhang Z., Baldini A. In vivo response to high-resolution variation of Tbx1 mRNA dosage. Hum. Mol. Genet. 2008;17:150–157. doi: 10.1093/hmg/ddm291. [DOI] [PubMed] [Google Scholar]
- 10.Vitelli F., Huynh T., Baldini A. Gain of function of Tbx1 affects pharyngeal and heart development in the mouse. Genesis. 2009;47:188–195. doi: 10.1002/dvg.20476. [DOI] [PMC free article] [PubMed] [Google Scholar]
- 11.Xu H., Morishima M., Wylie J.N., Schwartz R.J., Bruneau B.G., Lindsay E.A., Baldini A. Tbx1 has a dual role in the morphogenesis of the cardiac outflow tract. Development. 2004;131:3217–3227. doi: 10.1242/dev.01174. [DOI] [PubMed] [Google Scholar]
- 12.Zhang Z., Huynh T., Baldini A. Mesodermal expression of Tbx1 is necessary and sufficient for pharyngeal arch and cardiac outflow tract development. Development. 2006;133:3587–3595. doi: 10.1242/dev.02539. [DOI] [PMC free article] [PubMed] [Google Scholar]
- 13.Liao J., Aggarwal V.S., Nowotschin S., Bondarev A., Lipner S., Morrow B.E. Identification of downstream genetic pathways of Tbx1 in the second heart field. Dev. Biol. 2008;316:524–537. doi: 10.1016/j.ydbio.2008.01.037. [DOI] [PMC free article] [PubMed] [Google Scholar]
- 14.Chen L., Fulcoli F.G., Tang S., Baldini A. Tbx1 regulates proliferation and differentiation of multipotent heart progenitors. Circ. Res. 2009;105:842–851. doi: 10.1161/CIRCRESAHA.109.200295. [DOI] [PMC free article] [PubMed] [Google Scholar]
- 15.Vitelli F., Taddei I., Morishima M., Meyers E.N., Lindsay E.A., Baldini A. A genetic link between Tbx1 and fibroblast growth factor signaling. Development. 2002;129:4605–4611. doi: 10.1242/dev.129.19.4605. [DOI] [PubMed] [Google Scholar]
- 16.Hu T., Yamagishi H., Maeda J., McAnally J., Yamagishi C., Srivastava D. Tbx1 regulates fibroblast growth factors in the anterior heart field through a reinforcing autoregulatory loop involving forkhead transcription factors. Development. 2004;131:5491–5502. doi: 10.1242/dev.01399. [DOI] [PubMed] [Google Scholar]
- 17.Chen L., Mupo A., Huynh T., Cioffi S., Woods M., Jin C., McKeehan W., Thompson-Snipes L., Baldini A., Illingworth E.A. Tbx1 regulates Vegfr3 and is required for lymphatic vessel development. J. Cell Biol. 2010;189:417–424. doi: 10.1083/jcb.200912037. [DOI] [PMC free article] [PubMed] [Google Scholar]
- 18.Fulcoli F.G., Huynh T., Scambler P.J., Baldini A. Tbx1 regulates the BMP-Smad1 pathway in a transcription independent manner. PLoS One. 2009;4:e6049. doi: 10.1371/journal.pone.0006049. [DOI] [PMC free article] [PubMed] [Google Scholar] [Retracted]
- 19.Massague J., Seoane J., Wotton D. Smad transcription factors. Genes Dev. 2005;19:2783–2810. doi: 10.1101/gad.1350705. [DOI] [PubMed] [Google Scholar]
- 20.Chen C.Y., Schwartz R.J. Recruitment of the tinman homolog Nkx-2.5 by serum response factor activates cardiac alpha-actin gene transcription. Mol. Cell. Biol. 1996;16:6372–6384. doi: 10.1128/mcb.16.11.6372. [DOI] [PMC free article] [PubMed] [Google Scholar]
- 21.Liu N., Olson E.N. Coactivator control of cardiovascular growth and remodeling. Curr. Opin. Cell Biol. 2006;18:715–722. doi: 10.1016/j.ceb.2006.10.003. [DOI] [PubMed] [Google Scholar]
- 22.Pollock R., Treisman R. Human SRF-related proteins: DNA-binding properties and potential regulatory targets. Genes Dev. 1991;5:2327–2341. doi: 10.1101/gad.5.12a.2327. [DOI] [PubMed] [Google Scholar]
- 23.Leifer D., Krainc D., Yu Y.T., McDermott J., Breitbart R.E., Heng J., Neve R.L., Kosofsky B., Nadal-Ginard B., Lipton S.A. MEF2C, a MADS/MEF2-family transcription factor expressed in a laminar distribution in cerebral cortex. Proc. Natl Acad. Sci. USA. 1993;90:1546–1550. doi: 10.1073/pnas.90.4.1546. [DOI] [PMC free article] [PubMed] [Google Scholar]
- 24.Edmondson D.G., Lyons G.E., Martin J.F., Olson E.N. Mef2 gene expression marks the cardiac and skeletal muscle lineages during mouse embryogenesis. Development. 1994;120:1251–1263. doi: 10.1242/dev.120.5.1251. [DOI] [PubMed] [Google Scholar]
- 25.Lyons G.E., Micales B.K., Schwarz J., Martin J.F., Olson E.N. Expression of mef2 genes in the mouse central nervous system suggests a role in neuronal maturation. J. Neurosci. 1995;15:5727–5738. doi: 10.1523/JNEUROSCI.15-08-05727.1995. [DOI] [PMC free article] [PubMed] [Google Scholar]
- 26.Lin Q., Lu J., Yanagisawa H., Webb R., Lyons G.E., Richardson J.A., Olson E.N. Requirement of the MADS-box transcription factor MEF2C for vascular development. Development. 1998;125:4565–4574. doi: 10.1242/dev.125.22.4565. [DOI] [PubMed] [Google Scholar]
- 27.Bi W., Drake C.J., Schwarz J.J. The transcription factor MEF2C-null mouse exhibits complex vascular malformations and reduced cardiac expression of angiopoietin 1 and VEGF. Dev. Biol. 1999;211:255–267. doi: 10.1006/dbio.1999.9307. [DOI] [PubMed] [Google Scholar]
- 28.Lin Q., Schwarz J., Bucana C., Olson E.N. Control of mouse cardiac morphogenesis and myogenesis by transcription factor MEF2C. Science. 1997;276:1404–1407. doi: 10.1126/science.276.5317.1404. [DOI] [PMC free article] [PubMed] [Google Scholar]
- 29.Monks D.C., Morrow B.E. Identification of putative retinoic acid target genes downstream of mesenchymal Tbx1 during inner ear development. Dev. Dyn. 2012;241:563–573. doi: 10.1002/dvdy.23731. [DOI] [PMC free article] [PubMed] [Google Scholar]
- 30.Huang da W., Sherman B.T., Lempicki R.A. Systematic and integrative analysis of large gene lists using DAVID bioinformatics resources. Nat. Protoc. 2009;4:44–57. doi: 10.1038/nprot.2008.211. [DOI] [PubMed] [Google Scholar]
- 31.Huang da W., Sherman B.T., Lempicki R.A. Bioinformatics enrichment tools: paths toward the comprehensive functional analysis of large gene lists. Nucleic Acids Res. 2009;37:1–13. doi: 10.1093/nar/gkn923. [DOI] [PMC free article] [PubMed] [Google Scholar]
- 32.Andres V., Walsh K. Myogenin expression, cell cycle withdrawal, and phenotypic differentiation are temporally separable events that precede cell fusion upon myogenesis. J. Cell Biol. 1996;132:657–666. doi: 10.1083/jcb.132.4.657. [DOI] [PMC free article] [PubMed] [Google Scholar]
- 33.Naya F.J., Wu C., Richardson J.A., Overbeek P., Olson E.N. Transcriptional activity of MEF2 during mouse embryogenesis monitored with a MEF2-dependent transgene. Development. 1999;126:2045–2052. doi: 10.1242/dev.126.10.2045. [DOI] [PubMed] [Google Scholar]
- 34.Wu H., Naya F.J., McKinsey T.A., Mercer B., Shelton J.M., Chin E.R., Simard A.R., Michel R.N., Bassel-Duby R., Olson E.N., Williams R.S. MEF2 responds to multiple calcium-regulated signals in the control of skeletal muscle fiber type. EMBO J. 2000;19:1963–1973. doi: 10.1093/emboj/19.9.1963. [DOI] [PMC free article] [PubMed] [Google Scholar]
- 35.Dodou E., Verzi M.P., Anderson J.P., Xu S.M., Black B.L. Mef2c is a direct transcriptional target of ISL1 and GATA factors in the anterior heart field during mouse embryonic development. Development. 2004;131:3931–3942. doi: 10.1242/dev.01256. [DOI] [PubMed] [Google Scholar]
- 36.Wang D.Z., Valdez M.R., McAnally J., Richardson J., Olson E.N. The Mef2c gene is a direct transcriptional target of myogenic bHLH and MEF2 proteins during skeletal muscle development. Development. 2001;128:4623–4633. doi: 10.1242/dev.128.22.4623. [DOI] [PubMed] [Google Scholar]
- 37.Takeuchi J.K., Mileikovskaia M., Koshiba-Takeuchi K., Heidt A.B., Mori A.D., Arruda E.P., Gertsenstein M., Georges R., Davidson L., Mo R., et al. Tbx20 dose-dependently regulates transcription factor networks required for mouse heart and motoneuron development. Development. 2005;132:2463–2474. doi: 10.1242/dev.01827. [DOI] [PubMed] [Google Scholar]
- 38.Garg V., Kathiriya I.S., Barnes R., Schluterman M.K., King I.N., Butler C.A., Rothrock C.R., Eapen R.S., Hirayama-Yamada K., Joo K., et al. GATA4 mutations cause human congenital heart defects and reveal an interaction with TBX5. Nature. 2003;424:443–447. doi: 10.1038/nature01827. [DOI] [PubMed] [Google Scholar]
- 39.Linhares V.L., Almeida N.A., Menezes D.C., Elliott D.A., Lai D., Beyer E.C., Campos de Carvalho A.C., Costa M.W. Transcriptional regulation of the murine Connexin40 promoter by cardiac factors Nkx2-5, GATA4 and Tbx5. Cardiovasc. Res. 2004;64:402–411. doi: 10.1016/j.cardiores.2004.09.021. [DOI] [PMC free article] [PubMed] [Google Scholar]
- 40.Saga Y., Miyagawa-Tomita S., Takagi A., Kitajima S., Miyazaki J., Inoue T. MesP1 is expressed in the heart precursor cells and required for the formation of a single heart tube. Development. 1999;126:3437–3447. doi: 10.1242/dev.126.15.3437. [DOI] [PubMed] [Google Scholar]
- 41.Angelini C., Cutillo L., De Canditiis D., Mutarelli M., Pensky M. BATS: a Bayesian user-friendly software for analyzing time series microarray experiments. BMC Bioinformatics. 2008;9:415. doi: 10.1186/1471-2105-9-415. doi:10.1186/1471-2105-9-415. [DOI] [PMC free article] [PubMed] [Google Scholar]
- 42.Livak K.J., Schmittgen T.D. Analysis of relative gene expression data using real-time quantitative PCR and the 2(−Delta Delta C(T)) method. Methods. 2001;25:402–408. doi: 10.1006/meth.2001.1262. [DOI] [PubMed] [Google Scholar]
- 43.Schmittgen T.D., Livak K.J. Analyzing real-time PCR data by the comparative C(T) method. Nat. Protoc. 2008;3:1101–1108. doi: 10.1038/nprot.2008.73. [DOI] [PubMed] [Google Scholar]
- 44.Wilkinson D.G. Whole-mount in situ hybridization of vertebrate embryos. In Situ Hybridization: A Practical Approach. Oxford, UK: IRL Press; 1992. pp. 75–83. [Google Scholar]
- 45.Wu Y., Zhang X., Salmon M., Lin X., Zehner Z.E. TGFbeta1 regulation of vimentin gene expression during differentiation of the C2C12 skeletal myogenic cell line requires Smads, AP-1 and Sp1 family members. Biochim. Biophys. Acta. 2007;1773:427–439. doi: 10.1016/j.bbamcr.2006.11.017. [DOI] [PMC free article] [PubMed] [Google Scholar]
- 46.Chakrabarti S.K., James J.C., Mirmira R.G. Quantitative assessment of gene targeting in vitro and in vivo by the pancreatic transcription factor, Pdx1. Importance of chromatin structure in directing promoter binding. J. Biol. Chem. 2002;277:13286–13293. doi: 10.1074/jbc.M111857200. [DOI] [PubMed] [Google Scholar]
Associated Data
This section collects any data citations, data availability statements, or supplementary materials included in this article.
Supplementary Materials
Supplementary Data