MicroRNAs in the Pineal Gland: miR-483 REGULATES MELATONIN SYNTHESIS BY TARGETING ARYLALKYLAMINE N-ACETYLTRANSFERASE (original) (raw)
Background: MicroRNAs have not been studied in the pineal gland, the source of circulating melatonin.
Results: The pineal miRNA population is profiled; developmental and tissue-specific patterns are described. The data suggest miR-483 perturbs melatonin production by promoting destruction of the Aanat transcript.
Conclusion: miR-483 plays a physiological role in controlling melatonin synthesis.
Significance: Pathophysiological changes in pineal miR-483 could alter melatonin synthesis.
Keywords: Circadian Rhythms, Development, Endocrinology, MicroRNA, Neuroendocrinology, Pineal Gland, Aanat, IGF2, Melatonin, miR-483
Abstract
MicroRNAs (miRNAs) play a broad range of roles in biological regulation. In this study, rat pineal miRNAs were profiled for the first time, and their importance was evaluated by focusing on the main function of the pineal gland, melatonin synthesis. Massively parallel sequencing and related methods revealed the miRNA population is dominated by a small group of miRNAs as follows: ∼75% is accounted for by 15 miRNAs; miR-182 represents 28%. In addition to miR-182, miR-183 and miR-96 are also highly enriched in the pineal gland, a distinctive pattern also found in the retina. This effort also identified previously unrecognized miRNAs and other small noncoding RNAs. Pineal miRNAs do not exhibit a marked night/day difference in abundance with few exceptions (e.g. 2-fold night/day differences in the abundance of miR-96 and miR-182); this contrasts sharply with the dynamic 24-h pattern that characterizes the pineal transcriptome. During development, the abundance of most pineal gland-enriched miRNAs increases; however, there is a marked decrease in at least one, miR-483. miR-483 is a likely regulator of melatonin synthesis, based on the following. It inhibits melatonin synthesis by pinealocytes in culture; it acts via predicted binding sites in the 3′-UTR of arylalkylamine _N_-acetyltransferase (Aanat) mRNA, the penultimate enzyme in melatonin synthesis, and it exhibits a developmental profile opposite to that of Aanat transcripts. Additionally, a miR-483 targeted antagonist increased melatonin synthesis in neonatal pinealocytes. These observations support the hypothesis that miR-483 suppresses Aanat mRNA levels during development and that the developmental decrease in miR-483 abundance promotes melatonin synthesis.
Introduction
This report is of special interest in the broad area of chronobiology because it represents the first analysis of miRNAs2 in the pineal gland, a vital component of vertebrate biological timing as the source of circulating melatonin, the hormone of the night.
miRNAs are small ribonucleotide molecules (19–23 nucleotides) that have broad roles in biology, including neuronal segmentation and tissue development (1), and are necessary for the appropriate and correct regulation of a diverse range of gene expression. miRNAs act through post-transcriptional (2, 3) interactions with their mRNA targets to control mRNA stability and protein translation (3, 4). It is thought that the more complementary the miRNA is to the transcript, the more likely the transcript will be degraded. In metazoans, the target sites of miRNAs are most often found in the 3′-untranslated region (3′-UTR) of protein-coding genes (5, 6); in addition, evidence for the existence of sites within protein coding regions of mRNAs also exists (7).
Synthesis of miRNAs is generally similar to that of mRNAs, in that primary miRNAs are most commonly derived from RNA polymerase II-generated transcripts (8, 9) and contain poly(A) stretches that are necessary for correct processing and regulation (8, 10). Primary miRNAs are processed in the nucleus by DROSHA/DGCR8 (DiGeorge syndrome critical region 8) to release precursor miRNAs. Precursor miRNAs are exported to the cytoplasm by exportin-5 before being further processed by the RNase III nuclease DICER (reviewed in Ref. 11). An alternative source of miRNAs is the processing of introns into mature miRNAs, a number of which are processed by DICER-independent mechanisms (12). The importance of miRNAs is indicated by the observation that deletion of DICER results in embryonic lethality (13) and that knockdown of DICER in the retina results in an inability to sense light and causes malformation of neuronal progenitor cells (14).
The question of the role of miRNAs in the rodent pineal gland is of potential importance in the context of development and regulation. Developmental and regulatory studies have identified large changes in both the pineal transcriptome and proteome (15, 16), including 2- to >100-fold daily changes in hundreds of transcripts (17). These changes impact many cellular functions, most relevant being the synthesis of melatonin (tryptophan → hydroxytryptophan → serotonin → _N_-acetylserotonin → melatonin) and the regulation of this pathway (18).
The daily rhythm in melatonin synthesis is controlled by a neural mechanism, which acts through a transmitter/second messenger system to regulate the penultimate enzyme in this pathway, arylalkylamine _N_-acetyltransferase (Aanat). Aanat is of special interest and importance because it acts as the molecular neuroendocrine transducer at the interface of synthesis and regulation of physiological melatonin levels (19). Transcripts encoding Aanat are not detected in the pineal gland until the end of gestation; their abundance increases thereafter (20, 21). In the adult, the abundance of Aanat transcripts changes more than 100-fold on a 24-h basis; the increase in Aanat protein and activity at night is responsible for the nocturnal increase in melatonin production and in levels of circulating melatonin (18).
The investigations described in this report were designed to achieve two goals. The first goal was to profile the miRNA population in the adult pineal gland and to determine whether it exhibits large daily or developmental changes; this was of interest because of the possibility that 24-h and/or developmental changes in miRNAs might generate changes in mRNAs and their encoded proteins. This profiling would also reveal whether the pineal miRNA population was similar to that of retina, both of which are thought to have evolved from a common ancestral photodetector (22); such similarity exists for genes dedicated to signaling and transcriptional regulation in these tissues but not elsewhere. Similar miRNA profiles might represent conserved regulatory roles (17). The second goal was to determine whether the melatonin pathway is an miRNA target. The results of this effort are presented here.
EXPERIMENTAL PROCEDURES
Chemicals and Reagents
Chemicals and reagents were purchased from Sigma, unless otherwise stated.
Animals and Tissues
Pineal glands and other tissues were obtained from Sprague-Dawley rats (female, 180–250 g; Taconic Farms Inc., Germantown, NY). All animals were entrained to a 14:10 light/dark cycle for at least 1 week. For miRNA sequencing (miRNA-Seq), pools of six pineal glands were used; the day pool was obtained at Zeitgeber time (ZT) 7 and the night pool at ZT 19. The circadian nature of the RNA purified from these tissues was assessed by measuring the level of Aanat transcripts using quantitative real time-PCR (qRT-PCR) as described below (supplemental Fig. S1). The ages of animals used for developmental studies are given in the legends of Figs. 5 and 6. Euthanasia during the dark period collections were performed using a dim red light. Animal use and care protocols were approved by local ethical review and were in accordance with National Institutes of Health guidelines.
FIGURE 5.
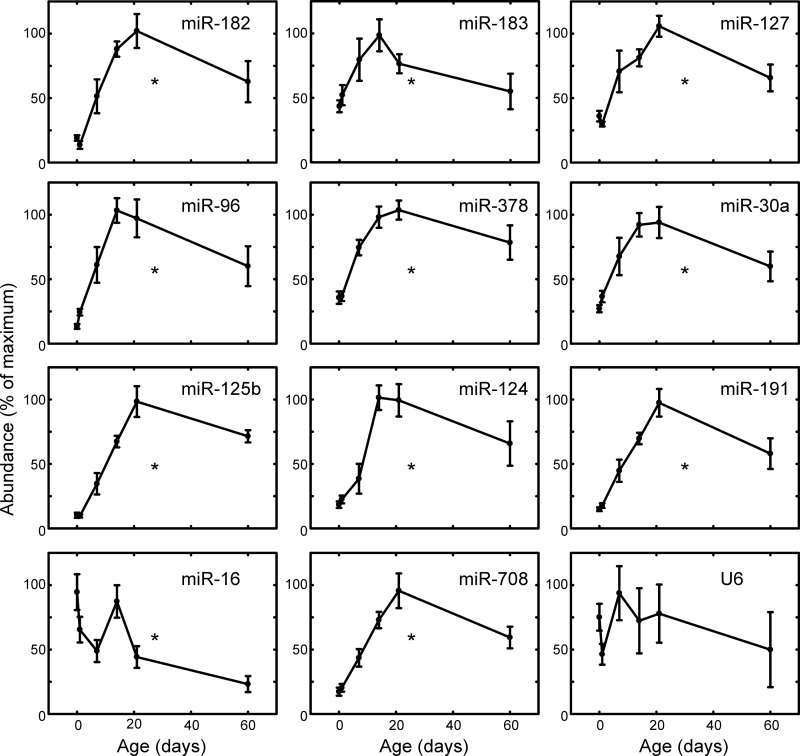
Developmental changes of selected miRNAs in the rat pineal gland. The most abundant miRNAs expressed in the adult pineal gland were analyzed using the QuantiMiR real time PCR system (see “Experimental Procedures”). qRT-PCR was performed on developmentally staged samples derived from rat pineal glands obtained the same day as birth (P0) and subsequent stages as follows: P2, P7, P14, P21, and P60. The expression of each miRNA is reported as the mean ± S.E. of the maximum signal in each assay, n = 3. Asterisk indicates significantly different (p < 0.01) patterns based on a one-way analysis of variance. For further details see “Experimental Procedures.”
FIGURE 6.
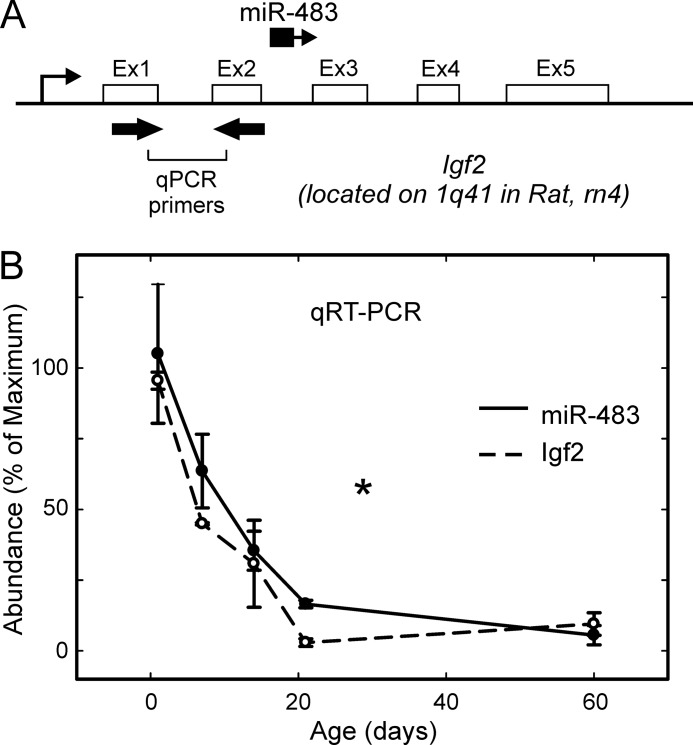
miR-483 is co-expressed with Igf2 and follows a developmental decrease in the rat pineal gland. A, miR-483 is an intronic miRNA in Igf2; miR-483 is located within the second intron of Igf2 on the same strand; Igf2 exons are numbered Ex1, Ex2, etc. Primers used for qRT-PCR of Igf2 in B are indicated with thick black arrows; qRT-PCR of miR-483 was done using the QuantiMiR system. B, parallel developmental changes in miR-483 and Igf2; qRT-PCR was performed on developmentally staged samples derived from rat pineal glands obtained the same day as birth (P0) and subsequent stages as follows: P7, P14, P21, and P60. miR-483 levels are shown with a solid line and detected using the QuantiMiR system. Igf2 levels (dashed line) were determined using intron-spanning primers (indicated in A) on cDNA prepared by random hexamer priming, as described under “Experimental Procedures.” miR-483 was detected using a primer specific to the mature miR-483 (supplemental Table 1). Values are plotted as the mean percentage of maximum signal from three independent measurements. Asterisk indicates significantly different (p < 0.01) gene expression levels based on a one-way analysis of variance. For further details see “Experimental Procedures.”
miRNA Sequencing
RNA Extraction and Sequencing
Total RNA was purified in a manner to recover the small RNA component using miRVana columns (Invitrogen), according to the manufacturer's instructions. The RNA was subsequently treated with TURBO DNA-free DNase (Invitrogen) for 15 min at room temperature. RNA quality was assessed using a Bioanalyzer (Agilent Technologies, Wilmington, DE); RNA integrity number values were determined to be ≥9. Library preparation was performed according to the Small RNA Sequencing Version 1.5 Alternative Protocol (Illumina, San Diego). In this procedure, pre-adenylated RNA adaptors are ligated to the 3′ end of the small RNAs, followed by ligation of a second RNA adaptor to the 5′ end. Reverse transcription was performed using a primer against the 3′ adaptor. The cDNA product was subsequently amplified by 15 PCR cycles. An ∼90–98-bp band, corresponding to an original small RNA size of 18–26 nucleotides, was gel-purified and applied to the cluster generation station. The slide was run on an Illumina GAII system for 35 cycles using the small RNA sequencing kit (Illumina). Library preparation and sequencing were done by the National Institutes of Health Intramural Sequencing Center.
Alignment of Small RNAs to Known miRNAs
The FASTQ sequence files were parsed (using the supplied perl script in the miRanalyzer package (23)) to reduce the read length to 26 bases, removing most of the adaptor introduced during library preparation. Unique reads were counted, and reads that did not meet a median phred quality score of 20 and occurred less than 10 times were discarded (23). The parsed file was searched against miRBase and transcript databases, including RefSeq and Rfam, and against the rat genome (rn4) using miRanalyzer (23). The miRNA read counts were normalized to the total number of reads to account for differences in cloning efficiency, thus allowing differential miRNA expression to be calculated. miRNAs identified by miRanalyzer were confirmed by use of the miRDeep2 algorithm using default settings as described previously (24). In silico folding of candidate miRNA hairpin sequences was performed using the UNAfold implementation of the Mfold algorithm (25).
Alignment of Small RNAs to the Rat Genome
The FASTQ files were aligned to the rat genome (rn4) with Novoalign using the adaptor stripping function to remove the standard Illumina 3′ adaptor sequence, with 1-base iterations; reads smaller than 17 bases were ignored. The alignment files (in SAM format) were sorted using SAMtools (27). Coverage plots of the aligned reads were calculated using the genome CoverageBed program, in BEDTools (28), for display in the UCSC genome browser. The miRNA-Seq data are deposited at the NCBI short read archive (SRA) under the accession number: SRA049977.
Bio-informatics, miRNA Target Prediction
miRNA targets were predicted using TargetScan (6), a database of miRNA:targets that considers evolutionarily conserved regions in the 3′-UTRs to refine the predictions. For 3′-UTRs not present in TargetScan, RNA22 (30) was used to search individual miRNAs against selected targets. Manual miRNA:target predictions were performed by searching for the miRNA seed (obtained from TargetScan (6)) within the 3′-UTRs obtained from the UCSC table browser (31), allowing for G:U wobbles (32).
Locked Nucleic Acid (LNATM)-Northern Blotting
A 1-μg sample of total RNA, extracted as described above, was subjected to PAGE on a 15% TBE-urea gel (Invitrogen) and transferred to Nytran Hybond membrane (GE Healthcare). For high abundance miRNAs, standard UV cross-linking was used. Low abundance miRNAs were cross-linked with 1-ethyl-3-(3-dimethylaminopropyl) carbodiimide (33). The membrane was blocked and incubated with the LNATM-Biotin probe and processed using the nucleic acid detection kit (Pierce) before being developed using Strep-HRP and enhanced chemiluminescence (ECL). LNATM-miRNA probes were designed by creating a 5′-biotin labeled DNA oligonucleotide, replacing every third base with a LNATM base as described in Ref. 34 (see supplemental Table S1 for sequences). LNA oligonucleotides were synthesized by Integrated DNA Technologies (Coralville, IA).
qRT-PCR
qRT-PCR was performed using cDNA produced by reverse-transcribing 1 μg of DNase I-treated RNA with random primers (Roche Applied Science) and Superscript III (Invitrogen) (50 °C, 1 h). qRT-PCR was done in a 20-μl reaction using a 1:10 dilution of cDNA, intron-spanning primers, and SYBR Green Master Mix (SuperArray Biosciences, Rockville, MD) on a Lightcycler 480 System (Roche Applied Science). qRT-PCR primers used for Aanat mRNA are described in supplemental Table S1.
TaqMan qRT-PCR
TaqMan assays (Invitrogen) were performed according to the manufacturer's instructions. Total RNA, including the miRNA component, was extracted using miRVana columns (Invitrogen). 10 ng of total RNA was reverse-transcribed using the TaqMan MicroRNA reverse transcription kit (Invitrogen). qRT-PCR was performed on a 1:15 dilution of the cDNA using TaqMan Universal PCR Mastermix, no AmpErase UNG (Invitrogen). TaqMan miRNA probes directed to miR-183, miR-96, and miR-182 (Invitrogen) were used according to the manufacturer's instructions. Relative quantitation was performed using Lightcycler 480 software (Roche Applied Science).
QuantiMiR qRT-PCR
QuantiMiR qRT-PCR (Systems Biosciences, Mountain View, CA) assays were performed on total RNA (1 μg) extracted as described above; poly(A) tailing was performed using the manufacturer's instructions. qRT-PCR was performed with 1:10 dilutions of reverse-transcribed material, and Absolute Blue Master Mix was used for qRT-PCR (Thermo-Fisher, Pittsburgh, PA). The identity of the miRNA was verified by resolving the PCR on a 3% agarose gel and then extracting, cloning, and sequencing the ∼60-bp band. The sequence-verified clone was used as a standard for absolute quantitation, using the Lightcycler 480 software (Roche Applied Science). Primers are listed in supplemental Table S1.
Cell Biology Studies
Isolation and Culture of Pineal Cells
Pinealocytes were prepared as described previously (35) from Sprague-Dawley rats sacrificed from ZT 4 to 7. Pinealocytes from 2-day-old animals were prepared as described above. Approximately 80,000 cells were added to each well of a Corning poly-d-lysine-coated 96-well plate (VWR, Radnor, PA). Transfected pinealocytes were cultured in a table-top incubator with 95% O2, 5% CO2 for the indicated time at 37 °C in complete Dulbecco's modified Eagle's medium (10% fetal calf serum (FCS), 50 μg/ml penicillin/streptomycin with 2.5 mg/liter amphotericin B containing 0.1% ascorbic acid, and 25 mm HEPES, pH 7.3). Pinealocytes were treated with norepinephrine (NE, 10 nm) to elevate melatonin synthesis; treatment duration periods are given in the figure legends.
Culture of HEK293 Cells
HEK293 cells (ATCC, Manassas, VA) were maintained in complete media, as defined above, in a humidified 95% air, 5% CO2 incubator. Cells were seeded at a density of ∼15,000 per well, of a 96-well plate, 18 h before transfection.
Transfection
HEK293 cells were transfected using Lipofectamine 2000 (Invitrogen) according to the manufacturer's protocol. Pinealocytes were transfected by electroporation using an Amaxa NucleofectorTM (Amaxa, Gaithersburg, MD); ∼1.5 × 10⁶ pinealocytes were resuspended in buffer L and electroporated using the program T-0005. miRNA mimics (purchased from Thermo-Fisher, Pittsburgh, PA) were used at 10 nm. The miRNA mimics used were as follows: C-320445-06-0005, MIMAT0000860, C-320575-01-0005, and C-320339-0-0005 for miR-483, miR-183, miR-182, and miR-96, respectively; CN-001000-01 was used as the control mimic. The miR-483 inhibitor (MIMAT0003121, Thermo-Fisher) was used at 10 nm and transfected as described above. The negative control inhibitor used was “control 1,” IN-001005-01 (Thermo-Fisher).
Aanat 3′-UTR Experiments
The 3′-UTR of the Aanat transcript was cloned into a modified version of the psiCHECKTM-2 vector (Promega, Milwaukee, WI) that had AgeI and SalI restriction sites introduced into the multiple cloning site. Total RNA derived from the rat pineal gland was converted to cDNA and used for all 3′-UTR PCRs. The primers used to clone the Aanat 3′-UTR and introduce mutations at the predicted miR-483 binding site in the Aanat 3′-UTR are given in supplemental Table S1.
The abundance of the Aanat 3′UTR was estimated by measuring Renilla luciferase activity normalized to the firefly luciferase activity driven by the HSV-TK promoter (psiCHECKTM-2). Luciferase activities were measured using a TriStar LB941 plate reader (Berthold Technologies, Oak Ridge, TN). Briefly, cells were lysed in 75 μl of passive lysis buffer (provided by the manufacturer) and 25 μl of lysate was measured after addition of 100 μl of substrate solution. The integration time for recording luciferase activity was 10 s.
Biochemical Measurements
N-Acetylserotonin and Melatonin
Media samples (50 μl) were prepared for analysis by the addition of 2.5 volumes of methanol. After 2–18 h (−20 °C), the media were centrifuged (4,500 × g, 1 h, 4 °C). The supernatant was transferred to an amber vial (Sun SRI, Rockwood, TN), and the methanol concentration was adjusted to 50%. A 30-μl aliquot of the resulting sample was applied to a 3.5-μm Zorbax C18 column (Agilent Technologies) and run on an HPLC under isocratic conditions (50% methanol, 0.1% formic acid). The eluate was continually analyzed on line in an Applied Biosystems QTrap in positive multiple reaction monitoring mode using the following ion pair parameters: _N_-acetylserotonin (219.2/160.2) and melatonin (233.2/174.2). A standard curve was created by adding known amounts of indoles to complete culture media; these were processed with the samples.
Aanat Activity
Aanat activity in pinealocyte lysates was measured by a radioenzymatic method (36). Briefly ∼50,000 washed pinealocytes were resuspended in 25 μl of 100 mm sodium phosphate buffer, pH 6.8, supplemented with 40 units/ml RNasin (Promega, Milwaukee, WI), 1× CompleteTM protease inhibitors (Roche Applied Science), 0.2 mm NaVO4, 10 mm β-glycerol phosphate, 10 mm NaF, and 100 nm cyanobacterial hepatotoxin microcystin-LR (Calbiochem). The lysate was sonicated briefly before addition of 75 μl of reaction buffer containing 100 mm sodium phosphate buffer, pH 6.8, 10 mm tryptamine HCl, and 0.5 mm tritiated acetyl-CoA with a specific activity of 4 mmol/mol. Tritiated acetyl-CoA (200 mCi/mmol, PerkinElmer Life Sciences) was diluted with acetyl-CoA (Moravek Biochemicals, Brea, CA) to 2 mm. The 100-μl reaction volume was incubated (37 °C, 20 min), and the reaction was stopped by addition of chloroform (1 ml). After a brief centrifugation, the aqueous phase was removed, and the chloroform was washed twice with 200 μl of 0.1 n NaOH. A 0.5-ml aliquot of the chloroform extract was transferred to a scintillation vial and evaporated (30 °C); following addition of 7 ml of Bio-SafeTM scintillant (Research Products International, Mount Prospect, IL), and radioactivity was determined (LS6500 Scintillation Counter, Beckman, Fullerton, CA).
Statistical Analysis
Data are presented as the mean ± S.E. for the indicated number of determinations. Statistical analyses were performed using Student's t test for pairs of data and one-way analysis of variance (ANOVA) for time series data containing one measured variable where indicated (GraphPad Prism, La Jolla, CA). Experimental series containing more than one group were assessed using a two-way ANOVA, with a Bonferroni post hoc test on each group (GraphPad Prism).
RESULTS
Day and Night miRNA Profiles Are Nearly Identical
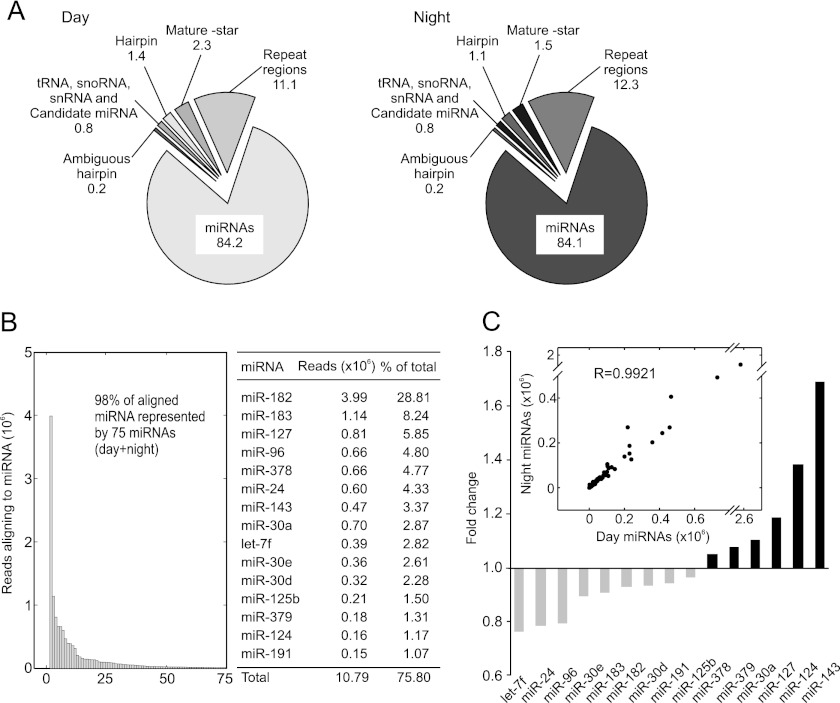
A total of ∼14.3 million aligned reads (∼8.3 million reads from day and ∼6 million reads from night) revealed the presence of >370 miRNAs in the rat pineal gland; this provided sufficiently deep coverage to allow accurate quantification of miRNAs, including the unambiguous identification of ∼300 miRNAs (see supplemental Table S2). The profiles of the miRNA populations in the ZT 7 (midday) and ZT 19 (midnight) samples are similar (Fig. 1A). Over 84% of the reads align to known rat miRNAs (miRBase version 18); an additional ∼12% align to regions of the genome composed of repetitive sequences, making it impossible to map their exact location. Between 3 and 4% of the reads align to the star form or other region of the known miRNA hairpin. Approximately 0.8% of the aligned reads are identified as candidate miRNAs that correspond to known mouse and human miRNAs, small structured RNAs, including snRNAs, small nucleolar RNAs, tRNAs, or previously unreported “novel” miRNAs.
FIGURE 1.
Distribution of aligned reads cloned from the rat pineal gland. A, distribution (%) of short reads after sequence alignment. Day and Night identify small RNAs cloned from pineal glands removed at ZT 7 and ZT 19, respectively (light/dark 14:10). Values indicate percentage of total reads after removal of low quality reads, matches to adaptors, and unique reads that numbered less than 10. miRNA indicates alignment to known rat miRNAs in miRBase version 18. Repeat regions refer to reads that aligned more than five times to the genome. Mature-star and Hairpin refer to reads that aligned to known star forms and the miRNA hairpin, respectively. Candidate miRNA indicates potential miRNAs that are not annotated as rat miRNAs in miRBase version 18 and also includes human or mouse miRNA homologs. Ambiguous hairpin indicates reads that cannot be assigned to exactly one miRNA hairpin. Alignments used to prepare this figure were created using the miRanalyzer software (23). B, distribution of 98% of all reads that align to miRNAs are as follows: 75 of a total of 376 miRNAs are included. The inset table presents the number of reads and corresponding percentage (of total reads) for the top 15 miRNAs. C, time of day dynamics of the 15 most abundant rodent pineal miRNAs. Gray bars indicate miRNAs that increase in the day (ZT 7), and black bars indicate miRNAs that increase at night (ZT 19). The scatter plot (inset) shows all 364 identified miRNAs after alignment of reads to miRBase version 18, and the results are reported as the normalized number of reads, day (ZT 7) on the x axis and night (ZT 19) on the y axis.
The most abundant 75 miRNAs account for ∼98% of the total miRNA population (combined ZT 7 and ZT 19 counts, Fig. 1B); furthermore, 15 miRNAs account for 75% of the reads (table inset in Fig. 1B). Comparison of day and night levels of expression of miRNAs did not reveal >2-fold night versus day differences in the abundance of any miRNA (Fig. 1C, inset); the night/day ratios of the 15 most highly expressed miRNAs are given in Fig. 1C. Comparison of the results of analysis of the miRNA-Seq data using miRanalyzer and the miRDeep2 algorithm (24) generated similar results (supplemental Fig. S2).
The miR-183-96-182 Cluster Dominates the Pineal miRNA Population
The most abundant miRNA is miR-182, which represents ∼28% of the total miRNA population (Fig. 1B). miR-182 is predicted to be part of a polycistronic miRNA cluster containing miR-183-96-182 (37), which are three of the four most abundant miRNAs in the pineal gland (Fig. 1B). Together, they represent over 42% of the pineal miRNA population.
Candidate miRNAs
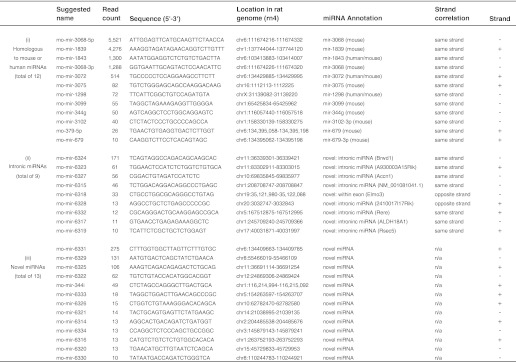
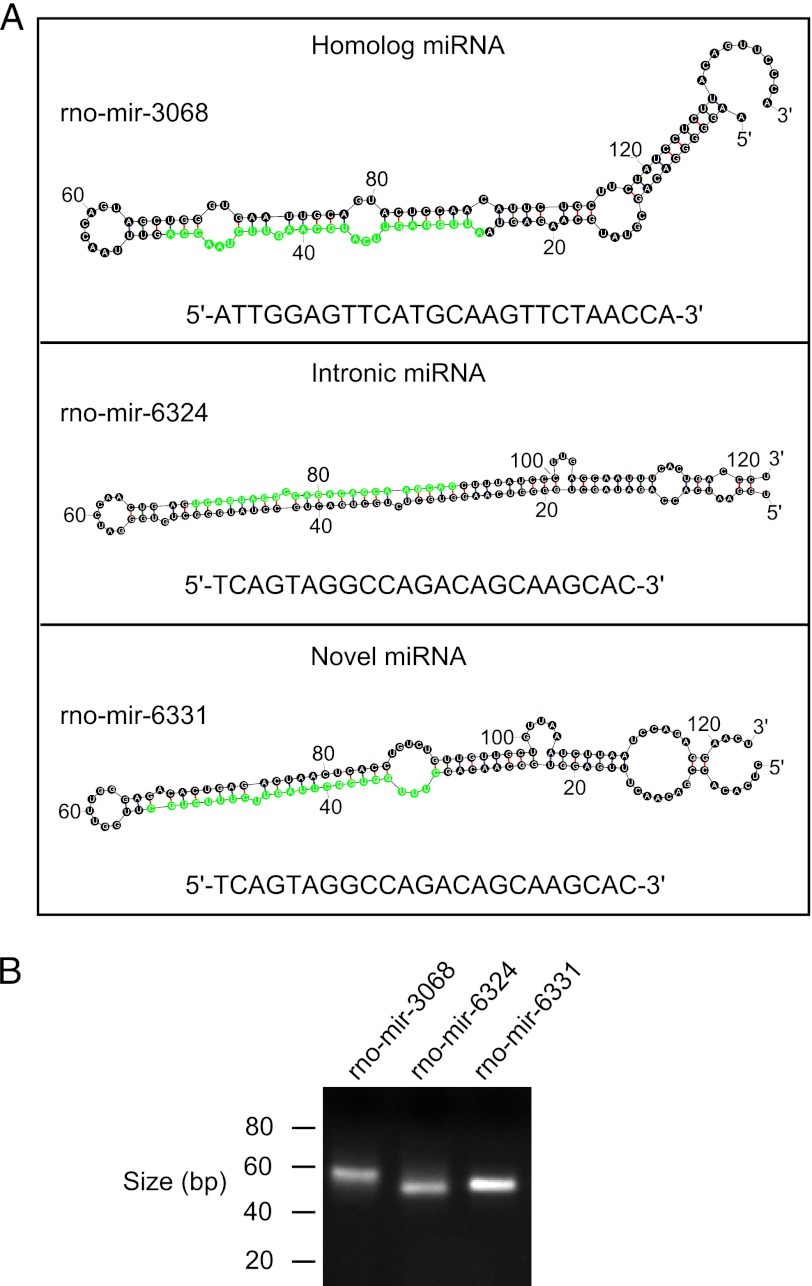
Candidate miRNAs were identified by miRanalyzer using the following criteria: absence in miRBase, location of the small RNA in a predicted hairpin-like configuration, and agreement with miRNA prediction models (23). A total of 34 candidate miRNAs were identified (Table 1), of which 12 were found to be homologous to mouse or human miRNAs, containing no more than one mismatch. Nine sequences align to introns of known genes, in the same orientation as the host gene; these are referred to as “intronic miRNAs” (Table 1). We also found 13 sequences that lie within a hairpin structure and do not align with annotated miRNAs and thus are referred to as novel miRNAs (Table 1). To validate the selection methodology, the most abundant candidate miRNA from each of these groups, (miR-3068, miR-6324 and miR-6331) were subjected to further analysis. Their predicted secondary structure is given in Fig. 2; their existence was confirmed by RT-PCR using the poly(A)-tailing method, “QuantiMiR” (see “Experimental Procedures”) followed by electrophoretic analysis (Fig. 2B) and Sanger sequencing (data not shown).
TABLE 1.
Candidate miRNAs identified by the miRNA analysis program: miRanalyzer (23)
The table consists of three groups of candidate miRNAs listed as follows: (i) homologous to other species; (ii) intronic miRNA; and (iii) novel miRNA. Suggested name refers to the proposed name for the novel miRNA identified in this study (detected by miRanalyzer). Read count indicates the total number of reads from day and night miRNA libraries obtained by miRNA-Seq. Sequence is the most abundant sequence identified. Location refers to the genomic position of the predicted precursor miRNA on the rat genome. miRNA class reports by group as follows: (i) the miRNA homolog from mouse or human, in the case of miRNAs that have a homolog; (ii) the gene name or NCBI reference number/RIKEN accession number, where no gene name exists, that contains the intronic miRNA; (iii) this indicates that the miRNA aligned to an unannotated region of the Rattus norvegicus genome. Strand correlation indicates how the candidate miRNA aligns to the homolog or, in the case of intronic miRNA, the annotated gene. Strand indicates the direction in which the miRNA resides on the genome.
FIGURE 2.
Candidate miRNA. A, identification. Candidate miRNAs were identified using the miRanalyzer (23) algorithm as described under “Experimental Procedures,” and an example from each category is shown: (i) the rat homolog of the mouse or human miRNA; (ii) intronic miRNA; and (iii) novel miRNA. The predicted hairpin structure was calculated using the Mfold algorithm (25). The mature sequence is highlighted in green and shown under each hairpin. Full details of identified miRNAs are reported in Table 1. B, PCR evidence. Agarose gel electrophoretic isolation of PCR products obtained from reactions performed on cDNA synthesized from adult pineal RNA, using the QuantiMiR system and 30 cycles of PCR, as described under “Experimental Procedures.”
Daily Rhythm in Abundance of the miR-183-96-182 Cluster
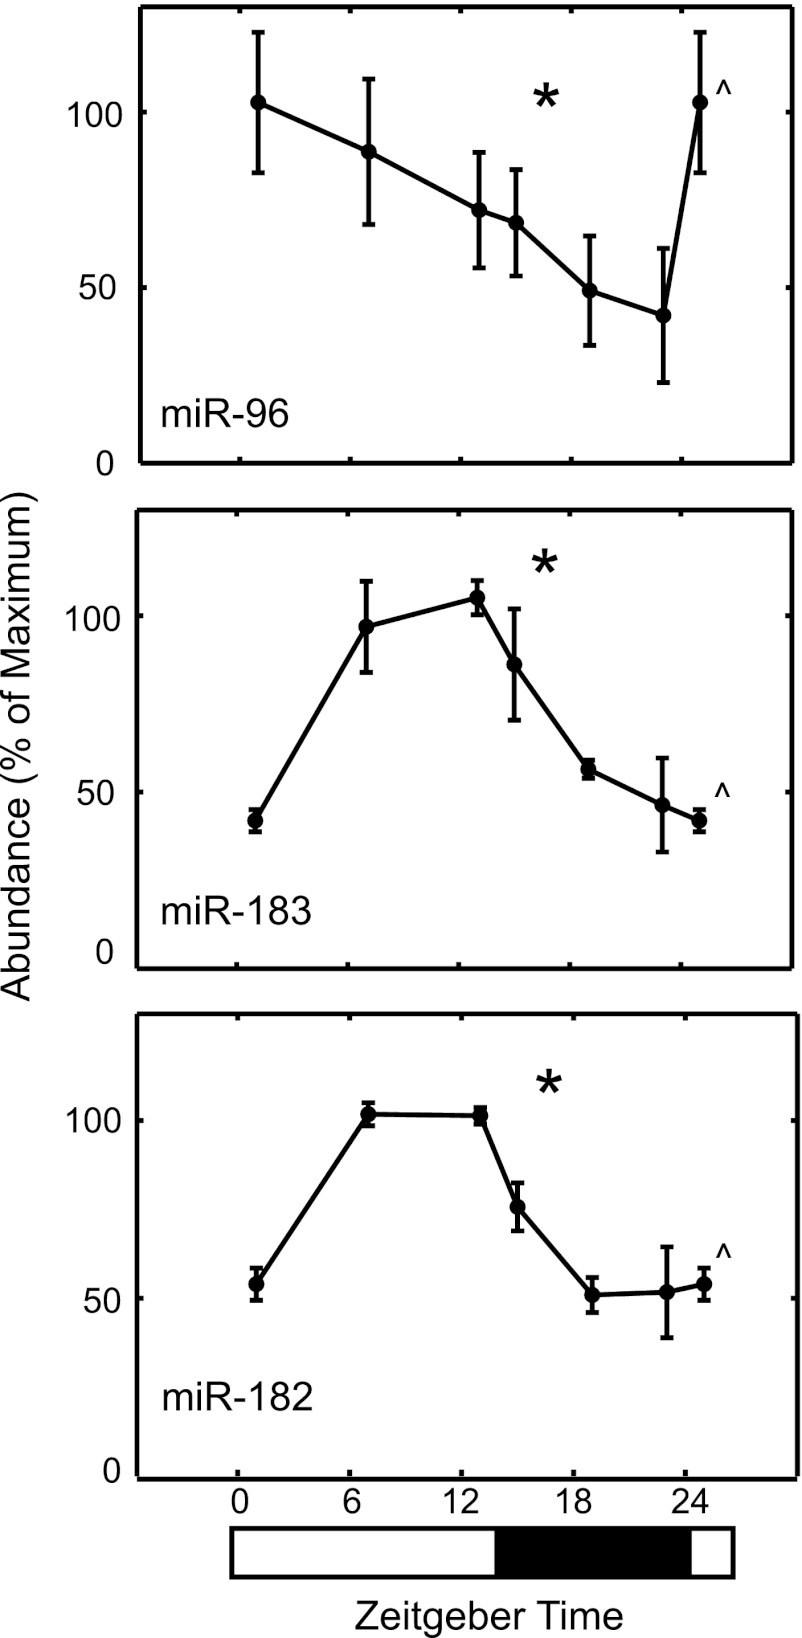
The miR-183-96-182 cluster was selected for further analysis to more fully characterize the dynamics of the 24-h pattern and possibly detect higher peak expression at times other than ZT 7 by using RNA from glands collected at six time points (ZT 1, 7, 13, 15, 19, and 23). qRT-PCR using TaqMan probes directed toward miR-183, miR-96, and miR-182 revealed an increase of ∼2-fold during the subjective day (Fig. 3). These data are in agreement with the daily increase revealed by miRNA-Seq and strengthen the confidence in the overarching indication from miRNA-Seq analysis that rat pineal miRNAs do not exhibit large daily differences, greater than 2-fold, in contrast to rat pineal mRNAs (17).
FIGURE 3.
Daily changes in miRNAs in the rat pineal gland. miR-183, miR-96, and miR-182 were analyzed using a TaqMan probe-based qRT-PCR assay that showed a daily increase between ZT 7 and ZT 13. Caret indicates a double plot of ZT 1 to aid visualization of data. Data are presented as the mean ± S.E., n = 3. Asterisk indicates significantly different (p < 0.05) rhythmic patterns of gene expression based on a one-way analysis of variance. For further details see “Experimental Procedures.”
Enrichment of the miR-183, miR-96, miR-182, and miR-125 in the Pineal Gland Relative to Other Tissues
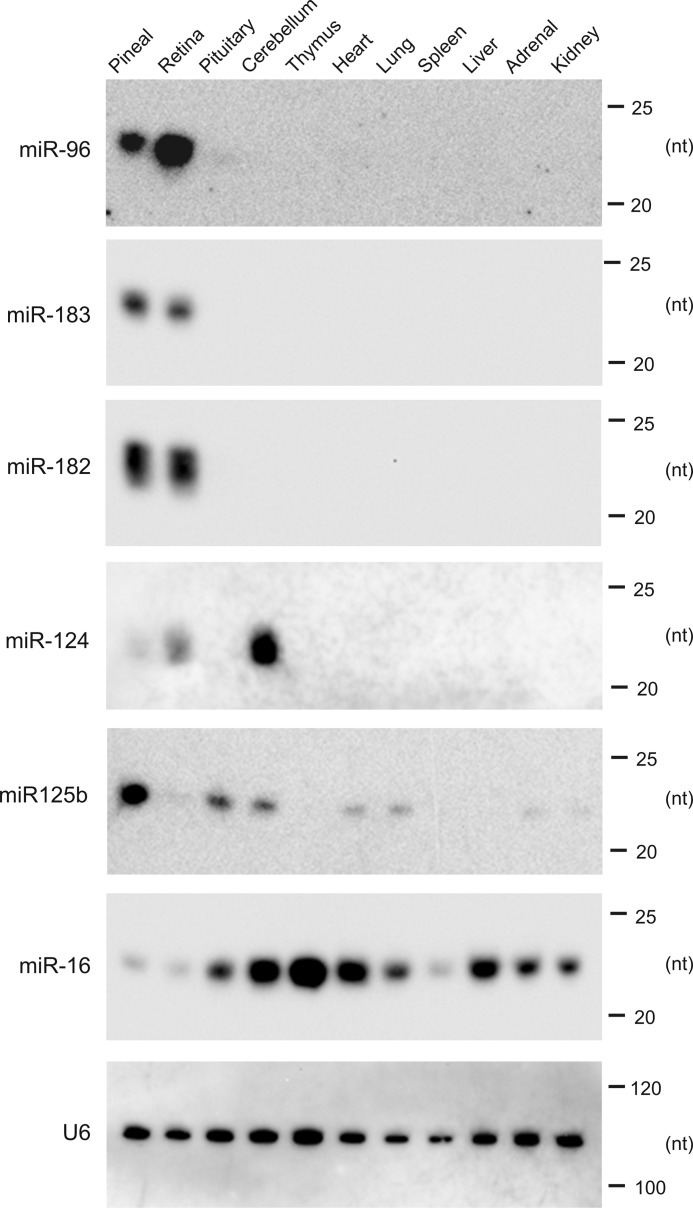
The relative expression of a selected set of miRNAs in 11 tissues, representing both neural structures and peripheral organs, was examined by Northern blotting. The miRNAs selected included members of the miR-183-96-182 cluster and other miRNAs abundant in the pineal gland (miR-124 and miR-125b); others were selected based on other considerations, as detailed below.
This analysis revealed a common pattern of expression of the miR-183-96-182 cluster in the pineal gland and retina. Although retinal expression of this cluster has been reported (37), the tissue-selective nature of this pattern has not been fully realized.
miR-124, which represents 1.2% of the miRNA-Seq reads (Fig. 1B), was selected for analysis because it is strongly expressed in neuronal tissue and the retina (37). Our results reveal a lower level of miR-124 in the pineal gland, as compared with retina and the cerebellum.
miR-125b (the mammalian homolog of lin-4) is known to be expressed in neural tissue (38). Here, we found it is more highly expressed in the pineal gland than in all other tissues examined (Fig. 4).
FIGURE 4.
Northern blot analysis of miRNA in selected tissues. Northern blot analysis of 11 rat tissues reveals highly pineal gland and retina-enriched miRNA expression. Animals were maintained in a light-controlled environment (light/dark 14:10). RNA was extracted and separated on 15% TBE-urea polyacrylamide gels. Each panel presents a membrane that has been probed with an LNATM probe, designed against the indicated miRNA (see under “Experimental Procedures” for probe design and supplemental Table S1 for sequences). The tissues examined are indicated at the top of the gel. Enrichment of miR-183, miR-96, and miR-182 in the pineal gland and retina is apparent. A probe for the ubiquitous miR-16 provides an indication of the presence of small RNAs in each sample. A representative control probe against U6 RNA is shown in the lower panel, and size markers are indicated on the right-hand side (in nucleotides). For further details see “Experimental Procedures.”
miR-16 is a ubiquitously expressed miRNA (39) and was studied to provide a comparison of miRNA expression levels. miR-16 is clearly detectable in pineal and all other tissues examined, although to markedly variable levels.
U6 is a ubiquitously expressed small nuclear RNA, and it was examined to confirm similar loading of total RNA in all samples (Fig. 4, bottom panel).
Developmental Changes in Pineal miRNAs
Developmental studies of the most abundant pineal miRNAs (Fig. 1) were performed using the QuantiMiR miRNA qRT-PCR system (Fig. 5). Among these, several exhibited a remarkable increase in expression of up to ∼50-fold (miR-182, miR-96, miR-124, and miR-125b; Fig. 5), characterized by a rapid increase to near adult levels by 7 to 14 days of age (Fig. 5). This study was expanded to include miR-708 (supplemental Table S1), because it is predicted to target the 3′-UTR of Aanat. It also exhibited a sharp increase during development similar to that described above (Fig. 5). miR-16, selected for reasons discussed above, displayed a small but significant decrease in expression during development. The small RNA U6 showed no significant developmental changes (Fig. 5).
miR-483 was studied because, like miR-708, it is predicted to target the Aanat 3′-UTR and therefore might play a physiological suppressive role in controlling the abundance of Aanat transcripts. miRNA-Seq indicated that miR-483 abundance was nearly undetectable in the adult; however, the developmental study indicates that it is ∼50-fold more abundant in the neonatal pineal gland (Fig. 6).
miR-483 is an intronic miRNA, located on the same strand with Igf2 (Fig. 6A). We found both miR-483 and Igf2 transcript abundance display a rapid parallel decrease during development (Fig. 6B).
miR-483 Inhibits Melatonin Production
Selected miRNAs were tested for their ability to inhibit melatonin synthesis by cultured pinealocytes; miR-183, miR-96, and miR-182 were chosen because of their high level of expression. In addition, miR-483 was selected based on target prediction analysis of the Aanat 3′-UTR and on developmental changes (Fig. 6B), which are opposite to those of Aanat levels (20, 21).
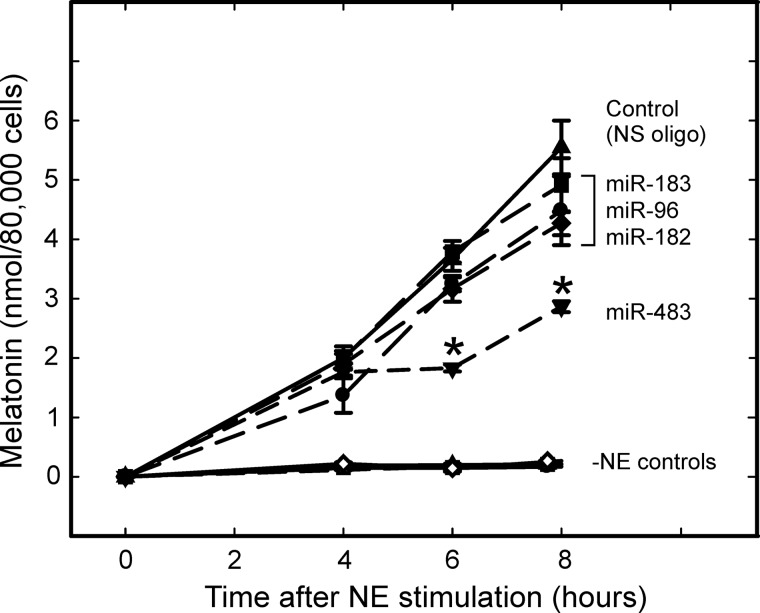
In these experiments, melatonin synthesis by cultured pinealocytes was elevated by treatment with NE, the physiological activator of the pineal gland that is known to induce expression of hundreds of genes, including Aanat (17). The introduction of miR-483 had significant inhibitory effects on NE-stimulated melatonin production, when compared with the control (Fig. 7). In contrast, miR-183, miR-182, and miR-96 treatments did not significantly inhibit melatonin production (Fig. 7).
FIGURE 7.
Screening pineal gland-enriched miRNAs for disruption of melatonin synthesis. Pinealocytes were transfected with the indicated miRNA for 24–48 h, followed by the addition of 10 nm NE to the culture medium for the indicated time. Control treatments where no NE was added is indicated by −NE control for each of the miRNA-transfected experiments. Each mimic corresponding to miR-183, miR-96, and miR-182 was transfected individually. Transfection of the cluster in combination had no effect on melatonin synthesis (data not shown). _N_-Acetylserotonin and melatonin were measured by mass spectrometry. Asterisk indicates significantly different (p < 0.05) patterns from a nonspecific (NS oligo) control value at the time point indicated (two-way ANOVA analysis with Bonferroni post hoc analysis). For further details see under “Experimental Procedures.”
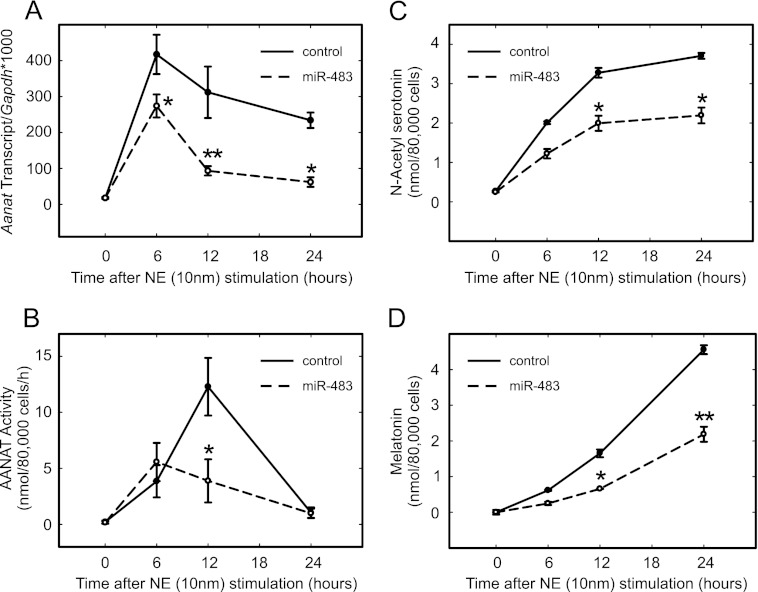
Investigation of the melatonin-suppressive effect of miR-483 in pinealocytes was extended using a longer NE treatment period. These experiments revealed that miR-483 reduced the abundance of Aanat mRNA by ∼50% (Fig. 8A). The mRNA level was markedly lower at 6 h, compared with the control, and remained at these reduced levels for 24 h (Fig. 8A). It was found that miR-483 suppressed Aanat activity (Fig. 8B), with an ∼50% reduction at the 12-h time point, compared with the control transfection (Fig. 8B). Also, the levels of the product of this enzyme, _N_-acetylserotonin, and of the final product in this pathway, melatonin, were reduced in the media of miR-483-transfected cells (Fig. 8, C and D).
FIGURE 8.
miR-483 regulates Aanat. A, qRT-PCR of Aanat. mRNA was extracted from pinealocytes transfected with 10 nm miR-483 and stimulated with 10 nm NE for up to 24 h. Control indicates a control oligonucleotide that is not complementary to any sequence in the rat genome and was therefore used as a negative control. Cell lysates were prepared in the presence of RNase inhibitors, phosphatase inhibitors, and DTT to preserve the integrity of RNA and the enzymatic state of Aanat. Transcript number is normalized to Gapdh. The data are plotted as the mean of three independent experiments, and error bars indicate the S.E. (*, p < 0.05, and **, p < 0.01), comparing miR-483 with the control at the indicated time point (two-way ANOVA with Bonferroni post hoc analysis). B, miR-483 reduces Aanat enzyme activity in transfected pineal cells. Cell lysates were prepared and assayed for enzymatic activity as described under “Experimental Procedures.” Aanat activity is shown as nanomoles of acetylated tryptamine per 80,000 pinealocytes/h (n = 3); error bars are S.E. 80,000 cells correspond to ∼20% of an adult pineal gland. Asterisk indicates a significant (p = 0.04) difference (two-tailed t test). There were no statistically significant differences at other time points. C and D, miR-483 reduces the production of the Aanat metabolite, _N_-acetylserotonin and melatonin. Samples of media collected from cells treated as in A and B were analyzed for _N_-acetylserotonin and melatonin by mass spectrometry. Values are reported as nmol/80,000 cells, and error bars report S.E., n = 3. Asterisk indicates significantly different (p < 0.05) values, performing a two-way ANOVA with Bonferroni post hoc analysis. For further details see “Experimental Procedures.”
miR-483 Represses Aanat in Neonatal Pinealocytes, Inhibition of miR-483 Increases Aanat and Indole Synthesis
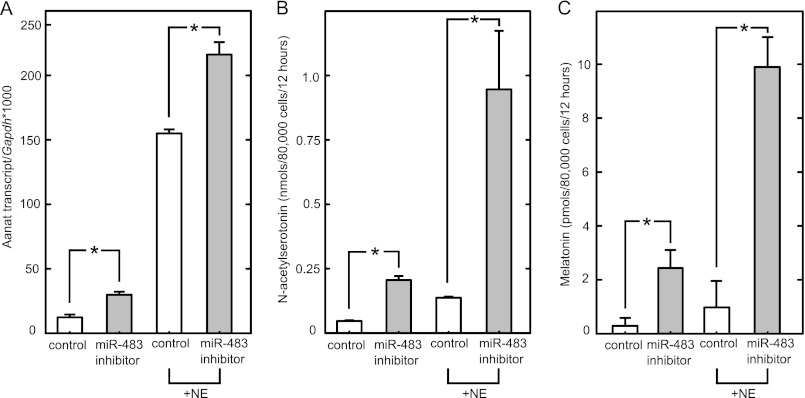
The role of endogenous miR-483 was investigated using a specific inhibitor of miR-483. Pineal cells were obtained from P2 animals that have a naturally high level of miR-483 (Fig. 6B). To eliminate the effects of endogenous miR-483, a miRIDIAN microRNA hairpin inhibitor (Thermo Scientific) was used. These inhibitors are chemically modified so as to promote their stability (40); they suppress levels of targeted miRNAs or otherwise negate their effectiveness (40). Treatment with this inhibitor increased Aanat levels in the absence and presence of NE (Fig. 9A). In contrast, a negative control inhibitor directed against a sequence that is absent from the rat genome had no influence. Accordingly, these results support the conclusion that endogenous miR-483 controls the abundance of endogenous Aanat mRNA. The levels of _N_-acetylserotonin and melatonin were also measured and showed an increase with miR-483 inhibition (Fig. 9, B and C). The relative increase was observed in the presence and absence of NE.
FIGURE 9.
miR-483 regulates Aanat and melatonin synthesis in neonatal pinealocytes. Pinealocytes prepared from 2-day-old rat pineal glands were transfected with a control miRNA inhibitor or an inhibitor directed toward miR-483 (each at 10 nm). The inhibitor used was a miRIDIAN microRNA hairpin inhibitor (Thermo Scientific); inhibitors of this nature are chemically modified so as to promote their stability (40); they suppress levels of targeted miRNAs or otherwise negate their effectiveness. Following a 36-h culture, the media were replaced with or without the addition of 1 nm NE. Cells were cultured for an additional 12 h. A, qRT-PCR of Aanat transcripts. Cells were lysed; mRNA was extracted; cDNA was prepared, and Aanat transcripts were determined (normalized to GAPDH). Data are the mean of three independent experiments, and error bars indicate S.E.; a two-tailed Student's t test was performed on each pair, *, p < 0.05. B and C, miR-483 inhibition increases production of _N_-acetylserotonin and melatonin. Melatonin and _N_-acetylserotonin in culture media were measured as described under “Experimental Procedures.” Note _N_-acetylserotonin units are given as nmol/80,000 cells/12-h period, and melatonin levels are given as pmol/80,000 cells/12-h period. Data are the mean of three independent experiments, and error bars indicate S.E.; a two-tailed Student's t test was performed on each pair, *, p < 0.05. For further details see “Experimental Procedures.”
miR-483 Acts via the Aanat 3′-UTR to Suppress Accumulation of Protein Product
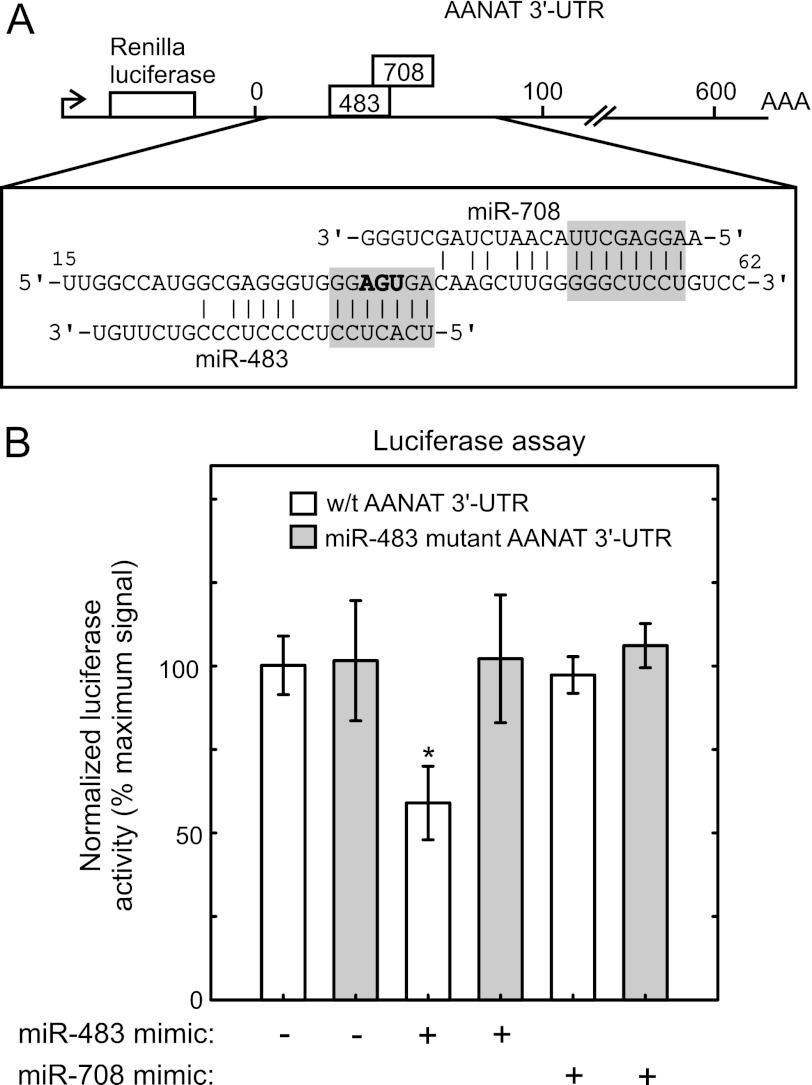
To determine whether miR-483 interacts with the Aanat 3′-UTR, a Dual-Luciferase reporter system was used with a reporter construct in which the Aanat 3′-UTR was cloned behind the Renilla luciferase coding sequence. This reporter was co-transfected into HEK293 cells with miRNA mimics corresponding to miR-483 and miR-708 (see schematic in Fig. 10A). Transfection with miR-483 reduced the normalized Renilla luciferase level by ∼40% (Fig. 10B); in contrast, luciferase was not altered by miR-708 or a control sequence that does not correspond to any known sequences. To determine the specificity of the interaction, the predicted miR-483 seed region of the Aanat 3′-UTR was mutated (Fig. 10A); this blocked the effects of miR-483 (Fig. 10B).
FIGURE 10.
miR-483 interacts with the Aanat 3′-UTR in vitro. A, miR-483 target site in the Aanat 3′_-_UTR. The miRNA target-containing region found in the rat Aanat 3′-UTR is shown in the context of the luciferase reporter used to assess the interaction with miRNAs. The predicted miRNA-binding sites are within the first 100 bases of the ∼600 base Aanat 3′-UTR. The seed regions for miR-483 and miR-708 are highlighted in gray, and the mutant created to test the binding specificity of miR-483 binding is indicated with bold characters (deletion) in the miR-483 seed region. B, miR-483 interacts with the 3′_-_UTR of Aanat. Renilla luciferase activity is reduced ∼40% upon transfection of miR-483, compared with control transfections. miR-708 transfection showed no effect on luciferase levels. Transfection efficiency is normalized by dividing Renilla luciferase activity values by the activity of Firefly luciferase that is driven by a separate promoter (HSV-TK). White bars indicate the wild type construct, and gray bars indicate the miR-483-binding site mutation. Asterisk indicates significantly different (p < 0.05), performing a two-tailed t test between control transfections, and the wild type Aanat 3′-UTR. Error bars are ±S.E., n = 3. For further details see “Experimental Procedures.”
DISCUSSION
Pineal miRNA Population
Pineal Gland-enriched miRNAs Display a Nonuniform Distribution
The pineal miRNA profile is strongly skewed; 15 miRNAs of the 374 miRNAs detected account for ∼75% of the total pineal miRNA population (Fig. 1C). This is a small fraction, ∼4%, of all known rat miRNAs, which is estimated to be >400 (miRBase Version 18).
In addition to documenting the presence of over 370 known miRNAs in the pineal gland, our study has also identified candidate miRNAs not previously reported to be present in the rat. Several of these candidate miRNAs correspond to known mouse or human miRNAs and can be considered homologs. A significant number of reads align to intronic regions of annotated genes and also to intergenic regions of the genome. Therefore, this study provides direct evidence, by sequencing, that these miRNAs exist and extends the list of rat miRNAs (Table 1).
miRNA Tissue Specificity
Our finding that a dominant group of miRNAs expressed in the pineal gland was extended by a direct comparison of RNA isolated from 11 different tissues, representing both neuronal and peripheral structures. Of the six miRNAs examined, miR-125b is the most pineal gland-enriched miRNA, despite ranking 12th in absolute abundance (Fig. 1B). Comparatively, miR-183, miR-96, and miR-182 are highly enriched in pineal and retina tissue. This finding is supported by a comparison of miRNA-Seq results presented here with those published for the mouse retina (41); this reveals that both miRNA populations are dominated by the miR-183-96-182 cluster (supplemental Fig. S3 and Table S3). The miRNAs that are expressed in the pineal gland to a greater degree than in the retina (when comparing the percentage of each miRNA population) are miR-143, miR-379, miR-127, miR-24, miR-30a, -e, and -d, and let-7f (supplemental Table S3 and Fig. S3). Their potential targets are listed in supplemental Table S4, but the functions of these miRNAs in the pineal gland remain unknown. However miR-143, miR-127, miR-30a, and miR-379 are among the highest expressed miRNAs in the pineal gland and also show an increase at ZT 19 (Fig. 1C); this is consistent with the interpretation that they play a role in modulating daily changes in pineal physiology.
miR-183-96-182 Cluster
Co-expression of the miR-183-96-182 cluster in the pineal and retinal miRNAome is of special interest because this suggests that they may play similar conserved roles in both tissues, which are thought to have evolved from a common ancestral photodetector cell (19, 22). Supporting this, miR-183 has been identified in photosensitive regions of Amphioxus (42), a lower chordate. Interestingly, it has been shown that mouse retina miR-183 and miR-96 are elevated following light exposure (41) as is the case in the pineal gland. It is of interest to note that strategies designed to reduce the functionality of these miRNAs in the retina have been reported to enhance light-induced damage (43), suggesting that they play a role in normal retinal physiology.
The miR-183-96-182 cluster occurs within a 3.6-kb sequence; miR-182 is located ∼3.4 kb downstream of miR-183 and miR-96 that are ∼200 bases apart. Although the increase of all three miRNAs during the daytime is similar (Figs. 1C and 3), the absolute expression values obtained from miRNA-Seq data show miR-182 is 3–5-fold higher than miR-96 and miR-183 (Fig. 1C). If this cluster is expressed as a single transcript, it is reasonable to expect that each miRNA would be present at similar levels. However, this was not observed and may reflect differences in production, degradation, or use of different promoters. A similar relative abundance pattern (miR-182 > miR-183 > miR-96) is seen in the mouse retina (supplemental Fig. S3 and supplemental Table S3, data included from Ref. 41). The relationship between the high expression of these miRNAs and possible targets in the pineal gland and retina is discussed below under “miRNA Effects on the Pineal Gland.”
Daily Changes in Pineal miRNA Levels
Examination of the most abundant group of miRNAs in the pineal gland (miR-183-96-182), revealed a maximum signal at mid-day (ZT 7) (Fig. 3). Interestingly a recent report showed an apparent daily increase, at ZT 13, in the miR-183-96-182 cluster in mouse retina (37); both have similar amplitudes of 1.5–2-fold. Accordingly, it appears that these daily changes are a conserved feature of the miR-183-96-182 cluster in these tissues.
The marked difference between the relatively small daily dynamics of all detectable miRNAs (Fig. 1) and the large daily dynamics of protein-coding mRNAs in the rat pineal gland (17) is striking. Whereas over 600 protein-coding transcripts exhibit a 2- to >100-fold time of day difference in abundance (17), it appears that the largest time of day difference in the abundance of a miRNA is not much greater than 2-fold. The significance of this disparity is difficult to determine. One possibility is that miRNAs in the pineal gland do not initiate the observed dynamic changes in the abundance of mRNAs and proteins but rather that they govern expression. A second possibility is that the abundance of unbound (i.e. “free”) miRNAs changes dramatically by virtue of changes in binding partners (e.g. proteins or long noncoding RNAs) and that this shift is masked because extraction methods recover both free and bound miRNAs. Further research might reveal that one or both of these modes of action are active in the pineal gland.
Developmental Changes in miRNA Abundance Levels
As is true of all tissues, there are significant developmental changes in transcript levels in the pineal gland (45–47). The primary mechanism driving the increase is most likely due to the orchestrated expression of transcription factors (45–47). Our finding of marked developmental changes in the most abundant pineal miRNAs suggests an additional mechanism to control transcript and protein abundance, which may shape the development of the pineal gland.
An interesting developmental change observed in this report is the striking decrease in miR-483, which parallels a similar decrease in the Igf2 transcript. The occurrence of miR-483 within an Igf2 intron and the similar developmental patterns of expression point to the probability that these transcripts are co-regulated (Fig. 6). This observation raises the possibility that such co-regulation might be common and that conditions that increase Igf2 will also increase miR-483 expression. As a result, some effects attributed to Igf2 might in fact reflect the direct effects of miR-483. For example, it is reasonable to suspect that the removal of Igf2 imprinting through promoter demethylation (48) and mutations that lead to aberrant Igf2 expression will also alter miR-483 expression, which in turn may contribute to the effects attributed to Igf2.
miRNA Effects on the Pineal Gland
Potential Actions of Pineal Gland-enriched miRNA
Predicted targets of the most abundant miRNAs expressed in the pineal gland include 3,519 unique potential target genes based on results obtained using TargetScan (6). Within this group of potential targets, there are 64 expressed in the pineal gland at high levels or on a time-of-day basis (supplemental Table S4) (17). Genes that are relevant to pineal biology and have predicted binding sites for multiple pineal gland-enriched miRNAs include Snf1lk, Per2, and Mat2a. Snf1lk may regulate the timing of the peak of Aanat expression (49) and has predicted binding sites for miR-182 and miR-96. Per2 has recently been reported to have an endogenous circadian rhythm in pineal cells (50) and may be targeted by miR-24 and miR-30. Mat2a has predicted binding sites for miR-30 and miR-124. This enzyme is highly expressed in the pineal gland (51) and catalyzes the formation of _S_-adenosylmethionine, required for the Asmt-catalyzed _O-_methylation of _N_-acetylserotonin to form melatonin (51). Igf1r has the largest number of predicted targets sites for pineal miRNAs as follows: miR-182, miR-96, miR-378, miR-143, miR-30, let-7, and miR-379 (supplemental Table S4). The role of Igf1r in the pineal gland has not been fully established; however, it has been suggested that cross-talk may exist between insulin and noradrenergic signaling (52). Also, Igf1 may influence differentiation of pineal cells (53). miRNAs may influence these process through effects on Igf1.
Melatonin Synthesis
The synthesis of melatonin is tightly controlled and has evolved to provide a stable nocturnal increase that can adjust to the day length gradually throughout the season, providing a robust timing signal, yet is highly sensitive to light at night (reviewed in Ref. 18). The study of the most dynamic enzyme in the synthesis of melatonin, Aanat, has revealed a number of molecular mechanisms that control the level of mRNA, protein, and enzyme activity (18). The work presented in this study adds to this body of knowledge by finding that miR-483 can impact Aanat mRNA stability, Aanat activity levels, and ultimately levels of melatonin. Aanat enzyme activity is closely associated with changes in the Aanat protein (18); hence, it is likely that the miR-483-induced decrease in Aanat activity identified in this study reflects a decrease in Aanat protein.
Aanat is expressed in retinal cells (54) but to a lower degree than in the pineal gland (17). Interestingly we found that miR-483 is ∼4 times more abundant in retinal tissue compared with the pineal gland.3 The higher level of miR-483 expression in the retina may in part explain the comparatively low abundance of Aanat in that tissue.
Our findings are most relevant in an early development context, whereby the high levels of miR-483 are likely to contribute to the low levels of Aanat transcript. Accordingly, it is possible that the primary role of miR-483 in the pineal gland early in development is to suppress _N_-acetylserotonin production, which, in addition to being the melatonin precursor, has a signaling role (29). The reduction of melatonin production by miR-483 suggests to us that miR-483 acts to govern melatonin synthesis until innervation of the pineal gland matures and functions to regulate melatonin synthesis.
It has been reported that melatonin can reduce the risk of various cancers, including breast and prostate cancer (26). In view of reports that miR-483 may be a marker of malignant carcinoma (44) and that it can induce cellular proliferation in hepatocellular carcinoma cells, it follows that an increase in pineal miR-483 could hypothetically lead to an increased risk of cancer as a result of suppression of the claimed protective effects of melatonin.
In summary, data presented here show striking tissue specificity and strong developmental changes in a group of miRNAs in the pineal gland, providing a foundation for future work on the role of miRNAs in the pineal gland. The finding of high levels of the miR-182-96-182 cluster, as is known for the retina, raises the question of whether common targets for this cluster exist in these evolutionarily related tissues. Of special interest is the discovery of high levels of miR-483 in the neonatal pineal gland and the experimental evidence that miR-483 decreases production of _N_-acetylserotonin and melatonin and lowers Aanat transcript abundance. Together, these findings are consistent with the conclusion that miR-483 acts early in life to suppress melatonin production by promoting degradation of Aanat transcript; elevation of miR-483 under pathological or physiological circumstances might also suppress melatonin production.
Supplementary Material
Supplemental Data
Acknowledgments
We thank Malgorzata Wiench for discussions and critical reading of the manuscript, Daniel Northrup for bioinformatic help, and Daniel Abebe for animal care. Next generation sequencing and was performed at the National Institutes of Health Intramural Sequencing Center (NISC).
*
This work was supported, in whole or in part, by National Institutes of Health Intramural Research Program, NICHD.
3
S. J. H. Clokie and D. C. Klein, unpublished observations.
2
The abbreviations used are:
miRNA
microRNA
qRT
quantitative real time-PCR
ANOVA
analysis of variance
NE
norepinephrine
miRNA-Seq
miRNA sequencing
ZT
Zeitgeber time.
REFERENCES
- 1.Li Q., Bian S., Hong J., Kawase-Koga Y., Zhu E., Zheng Y., Yang L., Sun T. (2011) Timing specific requirement of microRNA function is essential for embryonic and postnatal hippocampal development. PLoS One 6, e26000. [DOI] [PMC free article] [PubMed] [Google Scholar]
- 2.Lagos-Quintana M., Rauhut R., Lendeckel W., Tuschl T. (2001) Identification of novel genes coding for small expressed RNAs. Science 294, 853–858 [DOI] [PubMed] [Google Scholar]
- 3.Elbashir S. M., Lendeckel W., Tuschl T. (2001) RNA interference is mediated by 21- and 22-nucleotide RNAs. Genes Dev. 15, 188–200 [DOI] [PMC free article] [PubMed] [Google Scholar]
- 4.Bagga S., Bracht J., Hunter S., Massirer K., Holtz J., Eachus R., Pasquinelli A. E. (2005) Regulation by let-7 and lin-4 miRNAs results in target mRNA degradation. Cell 122, 553–563 [DOI] [PubMed] [Google Scholar]
- 5.Bartel D. P. (2009) MicroRNAs. Target recognition and regulatory functions. Cell 136, 215–233 [DOI] [PMC free article] [PubMed] [Google Scholar]
- 6.Friedman R. C., Farh K. K., Burge C. B., Bartel D. P. (2009) Most mammalian mRNAs are conserved targets of microRNAs. Genome Res. 19, 92–105 [DOI] [PMC free article] [PubMed] [Google Scholar]
- 7.Schnall-Levin M., Rissland O. S., Johnston W. K., Perrimon N., Bartel D. P., Berger B. (2011) Unusually effective microRNA targeting within repeat-rich coding regions of mammalian mRNAs. Genome Res. 21, 1395–1403 [DOI] [PMC free article] [PubMed] [Google Scholar]
- 8.Cai X., Hagedorn C. H., Cullen B. R. (2004) Human microRNAs are processed from capped, polyadenylated transcripts that can also function as mRNAs. RNA 10, 1957–1966 [DOI] [PMC free article] [PubMed] [Google Scholar]
- 9.Lee Y., Kim M., Han J., Yeom K. H., Lee S., Baek S. H., Kim V. N. (2004) MicroRNA genes are transcribed by RNA polymerase II. EMBO J. 23, 4051–4060 [DOI] [PMC free article] [PubMed] [Google Scholar]
- 10.Burroughs A. M., Ando Y., de Hoon M. J., Tomaru Y., Nishibu T., Ukekawa R., Funakoshi T., Kurokawa T., Suzuki H., Hayashizaki Y., Daub C. O. (2010) A comprehensive survey of 3′ animal miRNA modification events and a possible role for 3′ adenylation in modulating miRNA targeting effectiveness. Genome Res. 20, 1398–1410 [DOI] [PMC free article] [PubMed] [Google Scholar]
- 11.Lee R., Feinbaum R., Ambros V. (2004) A short history of a short RNA. Cell 116, S89–S92 [DOI] [PubMed] [Google Scholar]
- 12.Ruby J. G., Jan C. H., Bartel D. P. (2007) Intronic microRNA precursors that bypass Drosha processing. Nature 448, 83–86 [DOI] [PMC free article] [PubMed] [Google Scholar]
- 13.Bernstein E., Kim S. Y., Carmell M. A., Murchison E. P., Alcorn H., Li M. Z., Mills A. A., Elledge S. J., Anderson K. V., Hannon G. J. (2003) Dicer is essential for mouse development. Nat. Genet. 35, 215–217 [DOI] [PubMed] [Google Scholar]
- 14.Damiani D., Alexander J. J., O'Rourke J. R., McManus M., Jadhav A. P., Cepko C. L., Hauswirth W. W., Harfe B. D., Strettoi E. (2008) Dicer inactivation leads to progressive functional and structural degeneration of the mouse retina. J. Neurosci. 28, 4878–4887 [DOI] [PMC free article] [PubMed] [Google Scholar]
- 15.Sugden D., Klein D. C. (1983) Regulation of rat pineal hydroxyindole-_O_-methyltransferase in neonatal and adult rats. J. Neurochem. 40, 1647–1653 [DOI] [PubMed] [Google Scholar]
- 16.Moller M., Sparre T., Bache N., Roepstorff P., Vorum H. (2007) Proteomics of the photoneuroendocrine circadian system of the brain. Proteomics 7, 2009–201817514675 [Google Scholar]
- 17.Bailey M. J., Coon S. L., Carter D. A., Humphries A., Kim J. S., Shi Q., Gaildrat P., Morin F., Ganguly S., Hogenesch J. B., Weller J. L., Rath M. F., Møller M., Baler R., Sugden D., Rangel Z. G., Munson P. J., Klein D. C. (2009) Night/day changes in pineal expression of >600 genes. Central role of adrenergic/cAMP signaling. J. Biol. Chem. 284, 7606–7622 [DOI] [PMC free article] [PubMed] [Google Scholar]
- 18.Klein D. C. (2007) Arylalkylamine _N_-acetyltransferase. “The Timezyme.” J. Biol. Chem. 282, 4233–4237 [DOI] [PubMed] [Google Scholar]
- 19.Klein D. C. (2006) Evolution of the vertebrate pineal gland. The AANAT hypothesis. Chronobiol. Int. 23, 5–20 [DOI] [PubMed] [Google Scholar]
- 20.Ellison N., Weller J. L., Klein D. C. (1972) Development of a circadian rhythm in the activity of pineal serotonin _N_-acetyltransferase. J. Neurochem. 19, 1335–1341 [DOI] [PubMed] [Google Scholar]
- 21.Pfeffer M., Stehle J. H. (1998) Ontogeny of a diurnal rhythm in aryl-alkylamine-_N_-acetyltransferase mRNA in rat pineal gland. Neurosci. Lett. 248, 163–166 [DOI] [PubMed] [Google Scholar]
- 22.Klein D. C. (2004) The 2004 Aschoff/Pittendrigh lecture. Theory of the origin of the pineal gland. A tale of conflict and resolution. J. Biol. Rhythms 19, 264–279 [DOI] [PubMed] [Google Scholar]
- 23.Hackenberg M., Sturm M., Langenberger D., Falcón-Pérez J. M., Aransay A. M. (2009) miRanalyzer. A microRNA detection and analysis tool for next-generation sequencing experiments. Nucleic Acids Res. 37, W68–W76 [DOI] [PMC free article] [PubMed] [Google Scholar]
- 24.Friedländer M. R., Chen W., Adamidi C., Maaskola J., Einspanier R., Knespel S., Rajewsky N. (2008) Discovering microRNAs from deep sequencing data using miRDeep. Nat. Biotechnol. 26, 407–415 [DOI] [PubMed] [Google Scholar]
- 25.Zuker M. (2003) Mfold web server for nucleic acid folding and hybridization prediction. Nucleic Acids Res. 31, 3406–3415 [DOI] [PMC free article] [PubMed] [Google Scholar]
- 26.Reiter R. J., Tan D. X., Korkmaz A., Erren T. C., Piekarski C., Tamura H., Manchester L. C. (2007) Light at night, chronodisruption, melatonin suppression, and cancer risk. A review. Crit. Rev. Oncog. 13, 303–328 [DOI] [PubMed] [Google Scholar]
- 27.Li H., Handsaker B., Wysoker A., Fennell T., Ruan J., Homer N., Marth G., Abecasis G., Durbin R. (2009) The Sequence Alignment/Map format and SAMtools. Bioinformatics 25, 2078–2079 [DOI] [PMC free article] [PubMed] [Google Scholar]
- 28.Quinlan A. R., Hall I. M. (2010) BEDTools. A flexible suite of utilities for comparing genomic features. Bioinformatics 26, 841–842 [DOI] [PMC free article] [PubMed] [Google Scholar]
- 29.Shen J., Ghai K., Sompol P., Liu X., Cao X., Iuvone P. M., Ye K. (2012) _N_-Acetyl serotonin derivatives as potent neuroprotectants for retinas. Proc. Natl. Acad. Sci. U.S.A. 109, 3540–3545 [DOI] [PMC free article] [PubMed] [Google Scholar]
- 30.Miranda K. C., Huynh T., Tay Y., Ang Y. S., Tam W. L., Thomson A. M., Lim B., Rigoutsos I. (2006) A pattern-based method for the identification of microRNA-binding sites and their corresponding heteroduplexes. Cell 126, 1203–1217 [DOI] [PubMed] [Google Scholar]
- 31.Fujita P. A., Rhead B., Zweig A. S., Hinrichs A. S., Karolchik D., Cline M. S., Goldman M., Barber G. P., Clawson H., Coelho A., Diekhans M., Dreszer T. R., Giardine B. M., Harte R. A., Hillman-Jackson J., Hsu F., Kirkup V., Kuhn R. M., Learned K., Li C. H., Meyer L. R., Pohl A., Raney B. J., Rosenbloom K. R., Smith K. E., Haussler D., Kent W. J. (2011) The UCSC Genome Browser database. Update 2011. Nucleic Acids Res. 39, D876–D882 [DOI] [PMC free article] [PubMed] [Google Scholar]
- 32.Varani G., McClain W. H. (2000) The GxU wobble base pair. A fundamental building block of RNA structure crucial to RNA function in diverse biological systems. EMBO Rep. 1, 18–23 [DOI] [PMC free article] [PubMed] [Google Scholar]
- 33.Pall G. S., Hamilton A. J. (2008) Improved Northern blot method for enhanced detection of small RNA. Nat. Protoc. 3, 1077–1084 [DOI] [PubMed] [Google Scholar]
- 34.Válóczi A., Hornyik C., Varga N., Burgyán J., Kauppinen S., Havelda Z. (2004) Sensitive and specific detection of microRNAs by Northern blot analysis using LNA-modified oligonucleotide probes. Nucleic Acids Res. 32, e175. [DOI] [PMC free article] [PubMed] [Google Scholar]
- 35.Ho A. K., Ogiwara T., Chik C. L. (1996) Thapsigargin modulates agonist-stimulated cyclic AMP responses through cytosolic calcium-dependent and -independent mechanisms in rat pinealocytes. Mol. Pharmacol. 49, 1104–1112 [PubMed] [Google Scholar]
- 36.Parfitt A., Weller J. L., Klein D. C., Sakai K. K., Marks B. H. (1975) Blockade by ouabain or elevated potassium ion concentration of the adrenergic and adenosine cyclic 3′,5′-monophosphate-induced stimulation of pineal serotonin _N_-acetyltransferase activity. Mol. Pharmacol. 11, 241–255 [PubMed] [Google Scholar]
- 37.Xu S., Witmer P. D., Lumayag S., Kovacs B., Valle D. (2007) MicroRNA (miRNA) transcriptome of mouse retina and identification of a sensory organ-specific miRNA cluster. J. Biol. Chem. 282, 25053–25066 [DOI] [PubMed] [Google Scholar]
- 38.Sempere L. F., Freemantle S., Pitha-Rowe I., Moss E., Dmitrovsky E., Ambros V. (2004) Expression profiling of mammalian microRNAs uncovers a subset of brain-expressed microRNAs with possible roles in murine and human neuronal differentiation. Genome Biol. 5, R13. [DOI] [PMC free article] [PubMed] [Google Scholar]
- 39.Landgraf P., Rusu M., Sheridan R., Sewer A., Iovino N., Aravin A., Pfeffer S., Rice A., Kamphorst A. O., Landthaler M., Lin C., Socci N. D., Hermida L., Fulci V., Chiaretti S., Foà R., Schliwka J., Fuchs U., Novosel A., Müller R. U., Schermer B., Bissels U., Inman J., Phan Q., Chien M., Weir D. B., Choksi R., De Vita G., Frezzetti D., Trompeter H. I., Hornung V., Teng G., Hartmann G., Palkovits M., Di Lauro R., Wernet P., Macino G., Rogler C. E., Nagle J. W., Ju J., Papavasiliou F. N., Benzing T., Lichter P., Tam W., Brownstein M. J., Bosio A., Borkhardt A., Russo J. J., Sander C., Zavolan M., Tuschl T. (2007) A mammalian microRNA expression atlas based on small RNA library sequencing. Cell 129, 1401–1414 [DOI] [PMC free article] [PubMed] [Google Scholar]
- 40.Vermeulen A., Robertson B., Dalby A. B., Marshall W. S., Karpilow J., Leake D., Khvorova A., Baskerville S. (2007) Double-stranded regions are essential design components of potent inhibitors of RISC function. RNA 13, 723–730 [DOI] [PMC free article] [PubMed] [Google Scholar]
- 41.Krol J., Busskamp V., Markiewicz I., Stadler M. B., Ribi S., Richter J., Duebel J., Bicker S., Fehling H. J., Schübeler D., Oertner T. G., Schratt G., Bibel M., Roska B., Filipowicz W. (2010) Characterizing light-regulated retinal microRNAs reveals rapid turnover as a common property of neuronal microRNAs. Cell 141, 618–631 [DOI] [PubMed] [Google Scholar]
- 42.Candiani S., Moronti L., De Pietri Tonelli D., Garbarino G., Pestarino M. (2011) A study of neural-related microRNAs in the developing amphioxus. Evodevo 2, 15. [DOI] [PMC free article] [PubMed] [Google Scholar]
- 43.Zhu Q., Sun W., Okano K., Chen Y., Zhang N., Maeda T., Palczewski K. (2011) Sponge transgenic mouse model reveals important roles for the microRNA-183 (miR-183)/96/182 cluster in postmitotic photoreceptors of the retina. J. Biol. Chem. 286, 31749–31760 [DOI] [PMC free article] [PubMed] [Google Scholar]
- 44.Patterson E. E., Holloway A. K., Weng J., Fojo T., Kebebew E. (2011) MicroRNA profiling of adrenocortical tumors reveals miR-483 as a marker of malignancy. Cancer 117, 1630–1639 [DOI] [PMC free article] [PubMed] [Google Scholar]
- 45.Rath M. F., Muñoz E., Ganguly S., Morin F., Shi Q., Klein D. C., Møller M. (2006) Expression of the Otx2 homeobox gene in the developing mammalian brain. Embryonic and adult expression in the pineal gland. J. Neurochem. 97, 556–566 [DOI] [PubMed] [Google Scholar]
- 46.Rath M. F., Morin F., Shi Q., Klein D. C., Møller M. (2007) Ontogenetic expression of the Otx2 and Crx homeobox genes in the retina of the rat. Exp. Eye Res. 85, 65–73 [DOI] [PubMed] [Google Scholar]
- 47.Muñoz E. M., Bailey M. J., Rath M. F., Shi Q., Morin F., Coon S. L., Møller M., Klein D. C. (2007) NeuroD1. Developmental expression and regulated genes in the rodent pineal gland. J. Neurochem. 102, 887–899 [DOI] [PubMed] [Google Scholar]
- 48.Eriksson T., Frisk T., Gray S. G., von Schweinitz D., Pietsch T., Larsson C., Sandstedt B., Ekström T. J. (2001) Methylation changes in the human IGF2 p3 promoter parallel IGF2 expression in the primary tumor, established cell line, and xenograft of a human hepatoblastoma. Exp. Cell Res. 270, 88–95 [DOI] [PubMed] [Google Scholar]
- 49.Ho A. K., Chik C. L. (2010) Modulation of Aanat gene transcription in the rat pineal gland. J. Neurochem. 112, 321–331 [DOI] [PubMed] [Google Scholar]
- 50.Wongchitrat P., Felder-Schmittbuhl M. P., Govitrapong P., Phansuwan-Pujito P., Simonneaux V. (2011) A noradrenergic sensitive endogenous clock is present in the rat pineal gland. Neuroendocrinology 94, 75–83 [DOI] [PubMed] [Google Scholar]
- 51.Kim J. S., Coon S. L., Blackshaw S., Cepko C. L., Møller M., Mukda S., Zhao W. Q., Charlton C. G., Klein D. C. (2005) Methionine adenosyltransferase:adrenergic-cAMP mechanism regulates a daily rhythm in pineal expression. J. Biol. Chem. 280, 677–684 [DOI] [PubMed] [Google Scholar]
- 52.Peliciari-Garcia R. A., Marçal A. C., Silva J. A., Carmo-Buonfiglio D., Amaral F. G., Afeche S. C., Cipolla-Neto J., Carvalho C. R. (2010) Insulin temporal sensitivity and its signaling pathway in the rat pineal gland. Life Sci. 87, 169–174 [DOI] [PubMed] [Google Scholar]
- 53.Araki M., Suzuki H., Layer P. (2007) Differential enhancement of neural and photoreceptor cell differentiation of cultured pineal cells by FGF-1, IGF-1, and EGF. Dev. Neurobiol. 67, 1641–1654 [DOI] [PubMed] [Google Scholar]
- 54.Coon S. L., Mazuruk K., Bernard M., Roseboom P. H., Klein D. C., Rodriguez I. R. (1996) The human serotonin _N_-acetyltransferase (EC 2.3.1.87) gene (AANAT). Structure, chromosomal localization, and tissue expression. Genomics 34, 76–84 [DOI] [PubMed] [Google Scholar]
Associated Data
This section collects any data citations, data availability statements, or supplementary materials included in this article.
Supplementary Materials
Supplemental Data
