Global analysis reveals multiple pathways for unique regulation of mRNA decay in induced pluripotent stem cells (original) (raw)
Abstract
Pluripotency is a unique state in which cells can self-renew indefinitely but also retain the ability to differentiate into other cell types upon receipt of extracellular cues. Although it is clear that stem cells have a distinct transcriptional program, little is known about how alterations in post-transcriptional mechanisms, such as mRNA turnover, contribute to the achievement and maintenance of pluripotency. Here we have assessed the rates of decay for the majority of mRNAs expressed in induced pluripotent stem (iPS) cells and the fully differentiated human foreskin fibroblasts (HFFs) they were derived from. Comparison of decay rates in the two cell types led to the discovery of three independent regulatory mechanisms that allow coordinated turnover of specific groups of mRNAs. One mechanism results in increased stability of many histone mRNAs in iPS cells. A second pathway stabilizes a large set of zinc finger protein mRNAs, potentially through reduced levels of miRNAs that target them. Finally, a group of transcripts bearing 3′ UTR C-rich sequence elements, many of which encode transcription factors, are significantly less stable in iPS cells. Intriguingly, two poly(C)-binding proteins that recognize this type of element are reciprocally expressed in iPS and HFF cells. Overall, our results highlight the importance of post-transcriptional control in pluripotent cells and identify miRNAs and RNA-binding proteins whose activity may coordinately control expression of a wide range of genes in iPS cells.
Levels of gene expression are in part determined by mRNA abundance, which in turn is dependent on the rates of synthesis (transcription) and decay. Gene expression patterns vary dramatically between different cell types and the contributions of transcription factors to cell-type specification have therefore been studied extensively. Some transcription factors are so potent that they are able to reprogram cells from one type to another. For example, exogenous expression of a specific combination of four stem cell-specific transcription factors is sufficient to reprogram differentiated cells into a pluripotent state (Takahashi et al. 2007).
Recent studies have strongly suggested that post-transcriptional mechanisms, including mRNA decay, may be vital for reprogramming. First, at least one factor known to influence reprogramming efficiency, LIN28A, is an RNA-binding protein. The full range of functions carried out by LIN28A is unclear, but it enhances translation of genes essential for growth and survival of embryonic stem (ES) cells (Peng et al. 2011), and is essential for processing of certain miRNAs (Hagan et al. 2009; Heo et al. 2009). Second, exogenous expression of certain miRNAs can reprogram cells two orders of magnitude more efficiently than transcription factors (Anokye-Danso et al. 2011; Miyoshi et al. 2011; Subramanyam et al. 2011). This suggests that post-transcriptional down-regulation of the gene expression program of differentiated cells is an essential step on the pathway to pluripotency. This is perhaps not surprising when one considers that very stable mRNAs might take days to be depleted when transcription is repressed. More efficient depletion of unwanted mRNAs can be achieved through coordinated control of transcription and decay.
Despite the potentially wide-ranging impact of mRNA decay on gene expression in pluripotent cells, only one study to date has determined genome-wide mRNA turnover rates in ES cells (Sharova et al. 2009). This study identified several general determinants of mRNA stability in mouse ES cells. Specifically, stability was positively correlated with the number of exons and negatively correlated with the presence of 5′ UTR CpG dinucleotides. In addition, mRNAs with AU-rich elements and PUF protein-binding sites in the 3′ UTR tended to be unstable. Although several transcripts showed altered stability following differentiation, mechanisms behind this regulation were not investigated. Here, we set out to identify mRNAs whose stability differs between human induced pluripotent stem (iPS) cells and the genetically matched fully differentiated cells they were derived from (human foreskin fibroblasts, HFFs). We hoped to identify novel regulatory mechanisms that act specifically in pluripotent cells or in differentiated cells. Such mechanisms might represent targets that could be modulated to improve the efficiency of reprogramming or may prove essential for stem cell renewal or differentiation. Furthermore, we anticipated that transcripts exhibiting differential decay between the two cell types might encode factors that influence the establishment and/or maintenance of pluripotency.
We used a global approach to assess decay rates of ∼5500 mRNAs in both iPS and HFF cells. We discovered that two interesting groups of transcripts are specifically stabilized in iPS cells, the replication-dependent histone mRNAs and a set of mRNAs encoding C2H2-type zinc finger proteins. We also found that transcripts bearing C-rich elements in their 3′ UTRs are significantly less stable in iPS cells than in their differentiated counterparts. Interestingly, expression of two poly(C)-binding proteins that recognize these types of elements is altered in iPS cells. The implications of our findings with regard to understanding and enhancing reprogramming of differentiated cells are discussed.
Results
Estimation of decay rates for 5481 mRNAs in HFF and iPS cells
In order to estimate mRNA decay rates, HFF and iPS cells were treated with actinomycin D to inhibit transcription, and total RNA was isolated from three replicates at 0, 15, 30, 60, 120, and 240 min post-inhibition. This relatively short time frame was selected to minimize toxic effects of the transcription inhibitor, but does mean that half-lives >240 min were determined by extrapolation, and are therefore inherently less accurate. RNA abundance in each replicate was determined using Affymetrix Human Gene 1.0ST microarrays. The abundance of each mRNA at every time point in each of three replicates was plotted and the points were fitted to an exponential decay curve, allowing calculation of the half-life. The half-life for a specific mRNA was deemed to be reliable if the points fitted well to an exponential decay curve (P < 0.05). As an example, half-lives for the HIST1H4B transcript in HFF and iPS cells are shown in Figure 1A. In this manner, reliable estimates of half-life were generated for 8238 transcripts in HFFs (Supplemental Data set 1A) and 10,445 transcripts in iPS cells (Supplemental Data set 1B). There were 5481 mRNAs for which half-lives were obtained in both cell types, and this set of transcripts was used for the remainder of the study (Supplemental Data set 1C; Fig. 1B). Overall, mRNAs decayed slightly slower in HFFs than in iPS cells (Fig. 1C), and this is reflected in the slightly longer median half-life in HFFs (9.2 h vs. 8.6 h in iPS cells) (Fig. 1D,E). A Venn diagram depicting the overlap between the most stable and most unstable mRNAs in the two cell types is shown in Supplemental Figure S1. Interestingly, over half of the mRNAs present in each set are unique to that cell type. For example, of the 548 least stable transcripts in iPS cells, only 218 are among the most rapidly decayed in HFFs, while nine mRNAs are regulated so differently that they fall within the most stable set of transcripts in HFFs.
Figure 1.

Genome-wide determination of mRNA decay rates in HFF cells and the iPS cells derived from them. (A) Exponential decay curves for HIST1H4B mRNA in HFF and iPS cells. Each symbol represents HIST1H4B mRNA abundance in a single replicate with closed symbols denoting mRNA abundance determined in HFF cell samples and open symbols denoting mRNA abundance in iPS cells. Three replicates were performed in each cell type at each time point. The _P_-value for each cell type indicates how well the data fits to the exponential decay curve (solid line). The dashed lines indicate the 95% confidence intervals (CI) for each curve. (B) Venn diagram showing the number of mRNA half-lives generated in each cell type. (C) Graph showing the distribution of 5481 mRNA half-lives in each cell type. (D) Graph showing median, 10th, and 90th percentiles for 5481 mRNA half-lives determined in HFF cells. (E) Graph showing median, 10th, and 90th percentile for 5481 mRNA half-lives determined in iPS cells. (F) Graph showing the fold difference in half-life between HFF and iPS cells for 5481 mRNAs.
Many mRNAs exhibit different decay rates in HFF and iPS cells
In order to identify mRNAs that exhibited different decay rates in iPS and HFF cells, we compared the rates of decay for each transcript between the two cell types and ranked the genes by fold change in half-life (Fig. 1F). The majority of transcripts decayed at similar rates in both cell types, but some mRNAs exhibited dramatic differences in mRNA stability between iPS and HFF cells. The 548 mRNAs that showed the largest increase in stability in iPS cells (90th percentile and above) and the 548 with the largest decrease in stability in iPS cells (10th percentile and below) were investigated in more detail to identify functions shared among the most affected mRNAs and to define sequence elements whose presence correlates with decay rate.
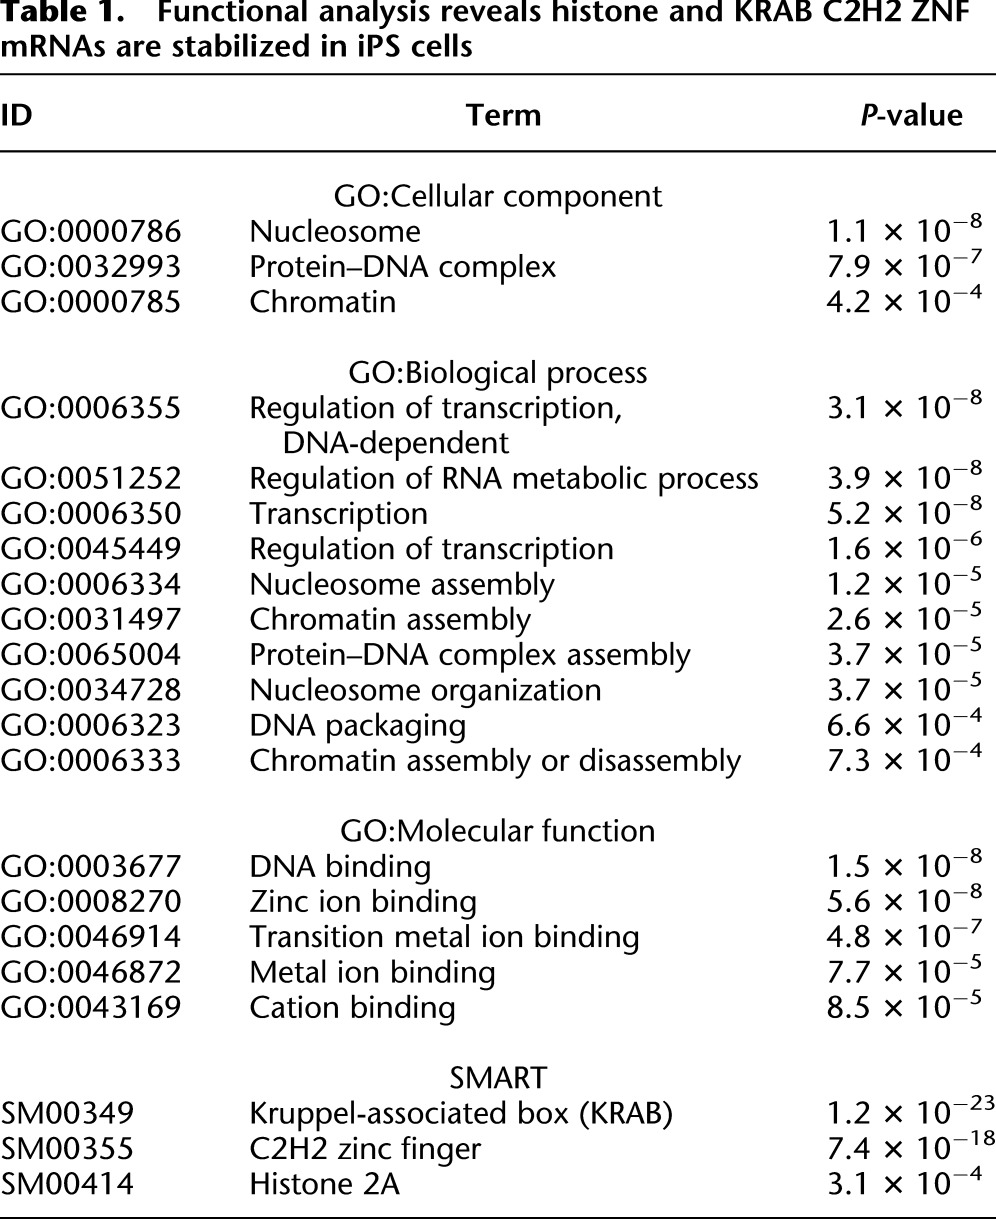
First, we used the DAVID functional annotation tool (Huang et al. 2009a,b) to determine whether specific cellular pathways or functions might be subject to mRNA decay regulation in iPS or HFF cells. The set of mRNAs that were less stable in iPS cells did not show any notable enrichment for Gene Ontology (GO) terms linked with molecular functions or biological processes, but they were more likely to encode proteins associated with the plasma membrane (P = 1.2 × 10⁻⁴). In contrast, transcripts that were more stable in pluripotent cells demonstrated significant enrichment of several functional terms (Table 1). Specifically, the GO terms “nucleosome,” “regulation of transcription,” and “DNA binding” were overrepresented (P < 1 × 10⁻⁷). The mRNAs associated with the term “nucleosome” all encode histones. Similarly, there were many zinc finger (ZNF) protein mRNAs linked with the “DNA-binding” and “regulation of transcription” GO terms. Further investigation revealed that a remarkable number of the stabilized mRNAs (>20%) encode C2H2-type zinc finger proteins, many of which also have a Krüppel-associated box (KRAB). Both these protein domains were highly enriched in the genes whose mRNAs show stabilization in iPS cells (KRAB P = 1.2 × 10⁻²³; C2H2 ZNF P = 7.4 × 10⁻¹⁸) (Table 1).
Table 1.
Functional analysis reveals histone and KRAB C2H2 ZNF mRNAs are stabilized in iPS cells
Histone mRNA stability is increased in iPS cells
The graph in Figure 2A highlights the significant stabilization (P = 2.2 × 10⁻¹¹) of histone mRNAs compared with other transcripts in the data set. We confirmed that histone mRNAs are indeed more stable in iPS cells by using qRT-PCR to assay the half-life of mRNAs encoding the four core histones (H2A, H2B, H3, and H4) and the linker histone (H1) (Fig. 2B). As predicted, we found that all five histone families have significantly increased mRNA half-lives in iPS cells. However, it should be noted that the half-lives determined by qRT-PCR represent the average half-life of the multiple different isoforms of each histone transcript, and thus are not directly comparable to the half-lives determined by microarray for individual histone mRNAs. When we examined abundance of the histone transcripts using the microarray data from the 0 time point of the half-life experiment we found that stabilization correlates with very significant increases (P = 6.5 × 10⁻⁹) in overall abundance of the histone transcripts (Fig. 2C). This was also seen when we used qRT-PCR to measure histone mRNA abundance in cells that had not been treated with actinomycin D (Fig. 2D), demonstrating that this phenomenon is not an artifact caused by transcription inhibition. The fold increase in histone mRNA abundance in iPS cells was higher when assessed using qRT-PCR than with the microarray. This likely reflects several differences in the approaches: (1) Actinomycin D was used for the array experiments and could have nonspecific effects on other aspects of mRNA metabolism, (2) microarrays have a reduced linear range of detection, (3) the qRT-PCR detects multiple histone mRNA species, while the microarray aims to detect each histone transcript separately. Regardless of the scale of the effect, it is very clear that histone transcripts are dramatically more abundant in iPS cells than in HFFs. Some of the increase in abundance of histone mRNAs is likely due to the abbreviated cell cycle in iPS cells (Becker et al. 2006). In support of this, we found by BrdU incorporation that there were approximately twice as many iPS cells as HFF cells synthesizing DNA in asynchronous populations (Supplemental Fig. S2). This would be consistent with an approximately twofold increase in histone mRNA abundance, which is significantly less than the increases we observed. Interestingly, histone protein levels are also elevated in iPS cells. Extracts from ∼4.2 × 10⁴ iPS or HFF cells were separated by SDS-PAGE, and the core histones were detected by Coomassie staining (Fig. 2E). We observed dramatically more core histone protein in the iPS cells. This was also supported by western blots for Histone H2A and H2B (Fig 2E, bottom). Moreover, an approximately fivefold increase in the abundance of the linker histone, H1, was also noted in iPS cells by western blot (Fig. 2E). With the increase in S phase population, the average amount of DNA per cell in iPS cells is likely to be ∼10% higher than in HFFs. The increase in histone protein abundance seems higher than needed to package the excess DNA; thus, we infer that the histone:DNA ratio may be higher in iPS cells than in their HFF counterparts. Overall, our results show that histone gene expression is much increased in iPS cells, more than can be explained by the fact that more iPS cells are in S phase. We believe at least some of the increase can be attributed to enhanced stability of histone mRNAs.
Figure 2.

Histone expression is increased in iPS cells. (A) Graph comparing the change in half-life for 53 histone mRNAs in HFF and iPS cells to changes for all 5481 mRNAs for which half-lives were calculated (_P_-value 2.2 × 10⁻¹¹). (B) Graph showing the half-life of individual histone mRNAs in HFF and iPS cells as determined by qRT-PCR. Error bars denote standard deviation derived from three replicates. (C) Graph comparing the change in abundance of 53 histone mRNAs to that of all 19,190 mRNAs expressed in both iPS and HFF cells. These data were derived from the 0-min time point of the half-life experiment (_P_-value 6.5 × 10⁻⁹). (D) Graph showing increases in abundance of individual histone mRNAs as determined by qRT-PCR. Error bars denote the standard deviation derived from three replicates. (E, top) Coomassie-stained gel showing abundance of histone proteins in extracts derived from equal numbers of HFF and iPS cells. (Bottom) Western blots showing abundance of Histones H1, H2A, and H2B in extracts derived from equal numbers of HFF and iPS cells.
ZNF mRNAs decay more rapidly in HFF cells
C2H2 zinc finger proteins are abundant in vertebrate genomes and have been linked with important functions in development and disease (Urrutia 2003). There is extensive homology between C2H2 ZNF proteins, largely due to the fact that they have arisen by gene duplication, but each species has a unique repertoire of these proteins, suggesting that they are rapidly evolving (Nowick et al. 2011). The KRAB domain found in the N terminus of many C2H2 ZNF proteins has been shown to function as a transcriptional repressor (Margolin et al. 1994; Witzgall et al. 1994). Given the unique gene expression profile of iPS cells, we were excited to discover that 120 of the 532 C2H2 ZNF mRNAs that we obtained half-lives for were significantly stabilized in iPS cells. To gain further insights, we first compared the changes in stability for all C2H2 ZNF mRNAs and all KRAB domain mRNAs with the changes for the whole data set. As shown in Figure 3A, both sets show much more stabilization in iPS cells than expected by chance. We verified stabilization for three transcripts, ZNF43 (19 C2H2 Zn fingers plus KRAB domain), ZNF134 (11 C2H2 Zn fingers), and ZNF627 (10 C2H2 Zn fingers plus KRAB domain), by qRT-PCR (Fig. 3B). It is worth noting that ZNF43 is important for maintenance of an undifferentiated state in Ewing Sarcoma cells and is down-regulated during differentiation (González-Lamuño et al. 2002). Our results suggest that this may be achieved through post-transcriptional changes.
Figure 3.

KRAB C2H2-type zinc finger protein mRNAs are stabilized in iPS cells. (A) Box-and-whisker plot showing fold change in half-life between HFF and iPS cells for different subsets of transcripts. (All genes) The entire data set of 5481 mRNAs; (C2H2 ZNF) 532 transcripts linked with the SMART term C2H2 ZNF (SM00355); (KRAB) 263 transcripts associated with the SMART term KRAB (SM00349). _P_-values were derived by the Kolmogorov-Smirnov Test. (B) Graphs showing decay of ZNF43, ZNF134, and ZNF627 mRNAs in HFF and iPS cells following inhibition of transcription with actinomycin D. mRNA abundance at each time point was determined by qRT-PCR. The error bars denote standard deviation based on three replicates. (C) Graph showing abundance of ZNF-targeting miRNAs in HFF and iPS cells as measured by qRT-PCR. Error bars represent the standard deviation derived from three independent experiments.
miRNAs targeting ZNF mRNAs have lower abundance in iPS cells
Coordinated post-transcriptional regulation of ZNF mRNAs is likely to be mediated by sequence elements shared between these closely related transcripts. Recent studies determined that a large proportion of transcripts encoding C2H2-type zinc finger proteins are subject to translational regulation mediated by four miRNA families (miR-23, miR-181, miR-188, and miR-199) that target sequence motifs within the regions encoding the zinc finger domains (Huang et al. 2010; Schnall-Levin et al. 2011). As these proteins generally have multiple C2H2 ZNF repeats, their transcripts can potentially be targeted by multiple miRNAs, leading to synergistic effects. miRNA profiling has suggested that miR-199 and miR-23 are under-represented in iPS cells as compared with their differentiated counterparts (Bar et al. 2008; Morin et al. 2008). As miRNAs often destabilize the mRNAs they target, either by inducing cleavage or by enhancing deadenylation (Fabian et al. 2010; Huntzinger and Izaurralde 2011), reduced abundance of these miRNAs could explain stabilization of ZNF mRNAs in iPS cells. We used qRT-PCR to assess expression of the ZNF-targeting miRNAs in iPS and HFF cells (Fig. 3C). We determined that members of all four miRNA families are significantly more abundant in HFFs than in iPS cells. The most dramatically affected miRNAs were miR-23a (∼13-fold lower in iPS cells), miR-23b (∼17-fold lower in iPS cells), and miR-199a (>50-fold lower in iPS cells). This inverse correlation strongly supports the idea that miRNAs coordinate expression of a large set of C2H2 ZNF transcription factors in differentiated cells by destabilizing their transcripts.
Identification of sequence elements over-represented in stable and unstable iPS cell mRNAs
Differences in mRNA stability between iPS and HFF cells could occur in multiple ways. As recent studies have shown, 3′ UTR lengths tend to be shorter in stem cells than in their differentiated counterparts (Ji and Tian 2009; Shepard et al. 2011). This results in fewer regulatory sequences being present and often an increase in mRNA stability. Unfortunately, the arrays used here do not readily allow us to distinguish differential usage of poly(A) sites. Another means of altering transcript stability is by varying the availability and/or activity of RNA-binding proteins and/or miRNAs that associate with specific sequence elements. In order to garner clues as to the identity of such regulatory factors, we asked whether the sequence elements present in stable and unstable mRNAs differ between the two cell types. We looked in the 5′ UTR, ORF, and 3′ UTR of the most stable and least stable mRNAs of iPS cells for over-represented hexamers that might embody binding sites for regulatory RNA-binding proteins or miRNAs and ranked the hexamers by _P_-value (Supplemental Table 1A). We also evaluated the occurrence of these same hexamers in the sets of HFF stable and unstable mRNAs for comparison (Supplemental Table 1B). The results for both cell types are summarized in Figure 4, where hexamers over-represented in stable mRNAs are shown in yellow and those over-represented in unstable mRNAs are shown in blue. The heat map allows us to pick out sequence elements that are associated with stability or instability in the 5′ UTR, ORF, and 3′ UTR in each cell type.
Figure 4.

Hexamers enriched in the 5′ UTR, ORF, and 3′ UTR of stable and unstable mRNAs. Occurrence of each possible hexamer in each region of the 548 most stable and 548 least stable mRNAs in iPS cells was determined. Hexamers were ranked as described in the Methods. Those that were over-represented in stable mRNAs (SEs) are depicted in yellow. Hexamers that were over-represented in unstable mRNAs (DEs) are shown in blue. The score for each hexamer in the set of stable and unstable mRNAs for HFFs was also determined, and the scores for iPS and HFF were compared. Specific elements of interest that might represent binding sites for RNA-binding proteins or miRNAs are indicated by arrowheads or brackets and are discussed in more detail in the text. The scores for all hexamers are shown in Supplemental Table 1.
For example, GC-rich elements were abundant in the 5′ UTRs of unstable mRNAs in both HFF and iPS cells (Fig. 4, left). This is in agreement with the previous study in mouse ES cells that found a strong correlation between instability and number of CpG dinucleotides in the 5′ UTR (Sharova et al. 2009). We also noted that the hexamer AAAAAA is significantly over-represented in the 5′ UTR of stable transcripts in both cell types. 5′ UTR A-tracts in vaccinia virus mRNAs can recruit Lsm complex proteins and protect these transcripts from the cellular mRNA decay machinery (Bergman et al. 2007). In addition, 5′ A-tracts in cellular mRNAs have been implicated as modulators of translation initiation through interactions with poly(A)-binding protein (Gilbert et al. 2007). There were also differences between the two cell types in the elements associated with stable mRNAs. Specifically, stable mRNAs were likely to have 5′ UTR CA-rich, CU-rich, or AU-rich elements in iPS cells, but these sequences were not as closely associated with stable transcripts in HFFs (Fig. 4, left). This disparity could reflect differences in abundance of _trans_-acting factors that recognize such elements between the two cell types.
The hexamers that are over-represented in ORFs are noticeably different between the two cell types. Some hexamers associated with stable mRNAs in iPS cells are over-represented in unstable transcripts in HFFs. Interestingly, several of these elements match to the seed sequence of the same miRNAs that were reported to modulate expression of ZNF mRNAs (Fig. 4, center; Schnall-Levin et al. 2011), consistent with the finding that these specific miRNAs are differentially expressed between the two cell types (Fig. 3C).
Our 3′ UTR analysis indicated that stable mRNAs in HFFs often contain CA-repeat elements, but these are not enriched in stable iPS transcripts (Fig.4, right, arrowheads). Stable iPS cell transcripts seemed to have more A-rich 3′ UTR elements than their HFF counterparts (Fig. 4, right). Finally, C-rich (arrowheads and brackets) and U-rich elements were over-represented in the 3′ UTRs of the mRNAs that were unstable in iPS cells, but less so in transcripts that were unstable in HFF cells (Fig. 4, right). U-rich elements have been linked with regulated decay of a large number of mRNAs, particularly those encoding transcription factors, growth factors, and cytokines (Khabar 2005; Halees et al. 2011). Two transcripts bearing U-rich 3′ UTR elements, LATS2, which encodes a kinase required for embryonic development (McPherson et al. 2004), and WEE1, which encodes a checkpoint kinase that influences the rate of cell division in hES cells (Qi et al. 2009), were both significantly less stable in iPS cells when assayed by qRT-PCR (Fig. 5A). We went on to evaluate expression of seven RNA-binding proteins that represent a subset of those known to recognize U-rich elements and modulate mRNA stability, namely, ELAVL1 (Meisner and Filipowicz 2010), HNRNPD (Gratacós and Brewer 2010), KHSRP (Gherzi et al. 2010), PTBP1 (Kosinski et al. 2003), PUM2 (Miller and Olivas 2011), CELF1 (Vlasova et al. 2008; Lee et al. 2010), and ZFP36L2 (Hudson et al. 2004). Interestingly, all seven of these proteins were expressed at higher levels in iPS cells than HFFs (Fig. 5B). Except for ELAVL1 (also known as HuR), the majority of these factors are known mediators of instability, which correlates well with the observation that U-rich elements are more strongly associated with instability in iPS cells.
Figure 5.

mRNAs containing U-rich 3′ UTR elements are destabilized in iPS cells and RBPs that recognize these types of sequence are differentially expressed. (A) mRNA decay was assessed by qRT-PCR following inhibition of transcription with actinomycin D. Each graph represents the average of three experiments. The error bars denote the standard deviation. (B) Western blots showing relative abundance in HFF and iPS cells of various RNA-binding proteins shown to interact with U-rich sequences. The numbers below each blot represent the relative amount of the protein after normalization to alpha-tubulin. Relative abundance of PTBP1 cannot be assessed, as it was undetectable in the HFF cells.
C-rich elements are over-represented in the 3′ UTRs of mRNAs that are destabilized in iPS cells
As 3′ UTRs frequently harbor important determinants of mRNA stability, we focused additional attention on this region to identify elements that might be responsible for destabilizing mRNAs in iPS cells. We examined the set of transcripts whose half-life was significantly decreased in iPS cells compared with HFFs, and again looked for over-represented hexamers. As may have been predicted from the strong association of C-rich elements with unstable iPS transcripts, we discovered that C-rich elements were dramatically enriched in transcripts that are less stable in iPS cells (Fig. 6A; Supplemental Table 2). This is surprising because, unlike U-rich elements, C-rich elements have been implicated predominantly as mRNA stabilizers (Makeyev and Liebhaber 2002), although their role has been characterized in relatively few mRNAs to date. We generated a list of destabilized transcripts that had C-rich elements in their 3′ UTR (Supplemental Table 3) and used DAVID (Huang et al. 2009a,b) to identify functional GO terms that were over-represented in association with these mRNAs. This revealed that a large proportion of the 151 destabilized mRNAs bearing 3′ UTR C-rich elements encode transcription factors and/or proteins with roles in embryonic development (Supplemental Table 4). Decay of three of these transcripts encoding DGCR8 (a miRNA processing factor) (Gregory et al. 2004), DUSP7 (a protein phosphatase required for maintenance of the pluripotent state) (Abujarour et al. 2010), and TOB2 (an antiproliferative protein involved in cell cycle progression (Winkler 2010) was examined by qRT-PCR. As predicted by the microarray analysis, all three were significantly less stable in iPS cells than in HFFs (Fig. 6B).
Figure 6.

mRNAs containing C-rich 3′ UTR elements are destabilized in iPS cells and poly(C)-binding proteins are differentially expressed. (A) Table of hexamers over-represented in the 3′ UTR of transcripts that were significantly less stable in iPS cells than in HFFs. (B) Transcripts that have C-rich elements in their 3′ UTRs are less stable in iPS cells. Half-lives of DGCR8, DUSP7, and TOB2 mRNAs were determined by qRT-PCR following inhibition of transcription with actinomycin D. The error bars represent the standard deviation based on three experiments. (C) Western blots showing abundance of poly(C)-binding proteins PCBP1, PCBP2, PCBP3, and PCBP4 in HFF and iPS cells. Abundance was normalized to GAPDH or alpha-tubulin. The numbers beneath each blot represent the relative amount of each protein in iPS cells with standard deviation derived from three independent experiments.
Poly(C)-binding proteins are differentially expressed in iPS cells
We hypothesized that the effect of C-rich elements on mRNA stability in iPS cells is most likely mediated by RNA-binding proteins whose abundance or activity differs between HFFs and iPS cells. The best-characterized RNA-binding proteins that associate with C-rich sequence elements are the poly(C)-binding proteins (PCBP1–4) (Makeyev and Liebhaber 2002). When we assayed the abundance of these four proteins in extracts from HFF and iPS cells by western blotting, we were interested to discover that PCBP4 is expressed almost exclusively in HFF cells and is only just detectable in iPS cells. Conversely, PCBP3 is more highly expressed (three- to fivefold) in iPS cells than in HFFs. PCBP1 and PCBP2 are the best-characterized members of this family, but their abundance is similar in the two cell types (Fig. 6C). It will be interesting to determine whether these robust changes in abundance of poly(C)-binding proteins are directly linked with the changes in stability of mRNAs bearing C-rich elements in iPS cells.
Discussion
We have determined half-lives for 5481 mRNAs in genetically matched iPS cells and the HFFs they were derived from (Supplemental Data set 1C; Fig. 1). This represents the majority of the transcripts that are expressed at detectable levels in both cell types. We showed that two large classes of mRNAs encoding histones (Fig. 2) and KRAB C2H2-type zinc finger proteins (Fig. 3) are significantly more stable in iPS cells than in HFFs. We found that miRNAs that specifically target the ORF of zinc finger protein mRNAs are down-regulated in iPS cells (Fig. 3C) and suggest that this difference contributes to stabilization of these transcripts in this instance. We identified 3′ UTR sequence motifs that are associated with stability and instability in both cell types (Fig. 4) and find that mRNAs containing U-rich or C-rich elements are likely to be less stable in iPS cells than in their differentiated counterparts. RNA-binding proteins recognizing these types of element also show differential expression between the two cell types studied (Figs. 5, 6) and as such are candidate pluripotency factors.
Reprogramming of cellular identity requires tightly regulated and coordinated changes in expression of many genes. Transcriptional changes are essential, but they must be integrated with altered mRNA decay rates in order to achieve the desired effects in a timely and efficient manner. Therefore, in order to fully understand reprogramming it is necessary to evaluate the contributions of both transcription and mRNA decay to overall changes in gene expression. In this study, we measured the rates of decay of a large proportion of the mRNAs that are expressed in human iPS cells and the fully differentiated HFF cells they were derived from. This data set should be a valuable and unique resource to those interested in mechanisms of maintenance and achievement of pluripotency in human cells. Of the transcripts that showed significant differences in half-life, three classes are highlighted here; those encoding replication-dependent histones, those encoding a class of C2H2-type zinc finger proteins, and mRNAs bearing C-rich 3′UTR elements. However, it is important to note that there are many other regulated transcript encoding factors with links to pluripotency that warrant future investigation. For example, ID1 mRNA, which encodes a transcription factor that inhibits differentiation (Hong et al. 2011), is stabilized over eightfold in iPS cells. Similarly, SOCS3 mRNA, which encodes a suppressor of cytokine signaling required for differentiation (Li et al. 2005) and for maintenance of pluripotency (Forrai et al. 2006), is over sevenfold more stable in iPS cells than in HFFs. In addition, some of the mRNAs whose decay differs most dramatically between iPS and HFF cells may have previously unsuspected roles in pluripotency.
iPS cell-specific stabilization of histone mRNAs
Replication-dependent histone mRNAs are unique in that they lack poly(A) tails, and instead bear a 3′ UTR stem–loop structure that recruits factors essential for coordinated processing, translation, and decay of the transcripts during S phase (Marzluff et al. 2008). Histone transcripts are stabilized as the cell enters S phase and rapidly degraded at the end of S phase. The vast majority of histone mRNA detected in an asynchronous cell population is therefore produced and degraded within S phase. We found that many histone mRNAs were stabilized in iPS cells, but cell cycle differences do not adequately account for the increase in histone mRNA stability, as S phase is of similar length in both cell types (Becker et al. 2006; Schultz et al. 2010). Overall abundance of histone mRNAs and proteins was also increased in iPS cells as compared with HFFs. Increased abundance of histone mRNAs is expected due the fact that iPS cells have an abbreviated G1 phase, which results in a larger proportion of iPS cells being in S phase in an asynchronous population (Becker et al. 2006). For our cell lines, approximately twice as many iPS cells were in S phase as HFF cells, so a twofold difference in histone mRNA would be expected. Interestingly, the overall increases in abundance of histone mRNAs are larger (more than 10-fold in many instances) than could be attributed to the approximately twofold increase in the fraction of cells in S phase. In support of this we also found that histone proteins are more abundant in iPS cells than in HFFs. As histone proteins are present throughout the cell cycle, one expects a smaller increase in their abundance as a result of the increased number of iPS cells in S phase, perhaps 10%. This is much less than the dramatic change we observed.
Histone transcripts degrade by a unique pathway involving 3′ oligouridylation followed by 5′-3′ and 3′-5′ exonucleolytic decay (Mullen and Marzluff 2008). Several proteins are known to influence stability of histone mRNAs, including SLBP (Kaygun and Marzluff 2005), LSM1 (Mullen and Marzluff 2008), UPF1 (Kaygun and Marzluff 2005), SFPQ (also known as PSF) (Heyd and Lynch 2011), and ZCCHC11 (Schmidt et al. 2011). Altered activity or abundance of one or more of these factors could be responsible for stabilization of histone transcripts in iPS cells.
It is also possible that the differences we observe in histone mRNA stability are a result of a different set of histone transcripts being expressed in iPS cells. A recent study found that the relative contribution of different histone genes to the overall histone mRNA population is altered in iPS and ES cells as compared with differentiated cells (Yang et al. 2011). In addition, linker Histone H1 variants are differentially expressed between pluripotent cells and differentiated cells (Terme et al. 2011). This is difficult to rule out based on our analysis, as our qRT-PCR assays do not distinguish between individual histone mRNA species, and there may be some cross-hybridization between different histone species on the microarrays. Thus, it is conceivable that the histone mRNAs most highly expressed in iPS cells generally have longer half-lives. However, it is not clear how such differential regulation might be achieved, given that all replication-dependent histones have similar 3′ UTR stem–loop structures.
The differences in histone expression are intriguing and could perhaps be linked with the unique properties of iPS cells that are poised to rapidly differentiate upon receipt of the correct signals. Chromatin structure in iPS cells is less compact than in other cell types (Meshorer et al. 2006), but during differentiation chromatin must undergo extensive reorganization to facilitate and stabilize the necessary changes in gene expression. Our results indicate that the histone:DNA ratio may be higher in iPS cells than in HFFs. It seems possible that histone proteins and/or mRNAs are stored to increase the ability of iPS cells to respond rapidly to differentiation cues.
Stabilization of ZNF protein mRNAs in pluripotent cells
Another class of transcripts that are stabilized in iPS cells encodes a family of Krüppel or C2H2-type zinc finger proteins. These developmentally regulated transcriptional regulators have arisen through gene duplication events and are thus closely related (Huntley et al. 2006). There are literally hundreds of members of this family in human cells, and we found over 100 that showed increased mRNA stability in iPS cells. This same family of proteins was recently shown to experience extensive post-transcriptional regulation through the action of miRNAs that target repeated sequence elements within the ORF of each mRNA (Huang et al. 2010; Schnall-Levin et al. 2011). Four miRNA families were implicated, and we find that all of these four families show lower expression in iPS cells than in HFFs (Fig. 3). We therefore surmise that the stabilization of mRNAs encoding these zinc finger proteins in iPS cells could be mediated through reduced miRNA action. Interestingly, although the function of the majority of human C2H2 zinc finger proteins is unknown, members of this family have been previously implicated in pluripotency (Jiang et al. 2008; Fidalgo et al. 2011). Our results show that large numbers of these transcription factors are differentially and coordinately regulated at the level of mRNA decay in iPS cells. It will be interesting in the future to determine how this regulation influences reprogramming and/or pluripotency.
_Cis_-acting sequence elements exert cell type specific effects
Our results uncovered U-rich and C-rich sequence elements that are over-represented in the 3′ UTRs of mRNAs that decay more rapidly in iPS cells than in HFFs. U-rich elements are frequently associated with instability, and we found that three RNA-binding factors that recognize U-rich elements are expressed at much higher levels in iPS cells—namely, CELF1, PUM2, and PTBP1 (Fig. 5B). Each of these proteins has been previously implicated in mediating the rapid decay of the transcripts it associates with (Kosinski et al. 2003; Lee et al. 2010; Bermudez et al. 2011). In the future, it will be interesting to tease out how these RBPs influence mRNA stability in iPS cells and whether the changes in their expression are important for pluripotency.
C-rich elements previously were shown to stabilize mRNAs by recruiting poly(C)-binding proteins (PCBPs) (Kiledjian et al. 1995); thus, the fact that they are associated with instability in iPS cells is rather novel. Our western blots show that PCBP1 and PCBP2 are expressed at similar levels in iPS and HFF cells, but the less studied PCBP3 and PCBP4 proteins show very noticeable differences in abundance in these two cell types. PCBP4 is expressed at ∼26-fold higher levels in HFFs than in iPS cells, whereas PCBP3 abundance is up to fivefold higher in iPS cells than in HFFs (Fig. 6C). Interestingly, PCBP4 (also known as MCG10) is a tumor suppressor and inhibits cell cycle progression. This is consistent with our finding that it is expressed more highly in HFFs (Zhu and Chen 2000; Castaño et al. 2008). It will be interesting to determine whether these two PCBPs, which are 59% identical at the protein level, associate with the same transcripts. If so, then they may have opposing effects on mRNA stability, or PCBP3 (which is expressed mainly in iPS cells) may be a less potent stabilizer than PCBP4 (which is expressed in HFFs). Such differences in activity of these RNA-binding proteins could coordinate changes in decay of mRNAs bearing C-rich elements. Many of these transcripts encode transcription factors and/or proteins involved in embryonic development (Supplemental Table 4), thus this regulation could have significant biological relevance.
mRNA decay factors and pluripotency
Overall, our results suggest that factors that modulate mRNA decay have essential roles to play in reprogramming differentiated cells or in maintaining pluripotency. For example, miRNAs may coordinate rapid decay of ZNF mRNAs in differentiated cells. Reducing abundance of these miRNAs would affect a large set of transcription factors, which, in turn, could influence expression of a wide range of downstream genes and thereby facilitate reprogramming. Similarly, another set of transcription factors, encoded by mRNAs with C-rich 3′ UTR elements, are subject to iPS cell-specific regulation that correlates with differential expression of poly(C)-binding proteins. Future studies will aim to determine whether PCBPs and ZNF-targeting miRNAs influence maintenance or achievement of pluripotency.
Methods
Cell culture
Human foreskin fibroblasts (HFFs) and genetically identical induced pluripotent stem (iPS) cells were purchased from System Biosciences. The HFFs were cultured in DMEM medium supplemented with 10% FBS, 2 mM L-glutamine, 100 μM nonessential amino acids, 50 U/mL of penicillin and 50 μg/mL of streptomycin. The iPS cells were cultured in mTeSR1 medium (Stemcell Technologies, Inc.) supplemented with 50 U/mL of penicillin and 50 μg/mL of streptomycin on plates coated with 0.3mg/mL of Matrigel Basement Membrane Matrix Growth Factor Reduced (BD Biosciences). Cells were incubated at 37°C with 5% CO2.
Microarrays
To inhibit transcription, cells were treated with 5 μg/mL of actinomycin D (Invitrogen) starting at 20 min before collection of the 0-min time point. Cells were collected in TRIzol (Invitrogen) at 0, 15, 30, 60, 120, and 240 min after the 20 min preincubation with actinomycin D. Total RNA was isolated according to the manufacturer's protocol. RNA quality and concentration were verified using a NanoDrop 2000c spectrophotometer (Thermo Fisher Scientific) and Bioanalyzer (Agilent). RNA samples for each cell line were processed for hybridization to 18 Affymetrix Human Gene 1.0 ST microarrays (one per time point per replicate). Microarray data were first processed by the Affymetrix Power Tools (APT) program, using the GC-bin method for background correction. All probe set values were then normalized to the fifth-percentile value of the same array. Transcripts whose probe sets with detection above background (DABG) _P_-value <0.05 for at least two out of three replicates at the 0-min time point were considered “expressed” and used for subsequent analyses.
Half-life calculation
We applied a nonlinear least squares model (NLS) (Wang et al. 2002) to calculate transcript half-life using microarray data. Briefly, the abundance values of each mRNA at different time points after actinomycin D treatment were fitted to a first-order exponential decay curve over time to determine the decay rate constant (k). Half-life (t1/2) was defined as ln(2)/k. All three replicates were utilized to generate a single decay curve and a single half-life for each transcript. We used only mRNAs with a reliable estimate of half-life (_P_-value <0.05 for fitting to the exponential curve) for further analysis.
_Cis_-acting element analysis
We examined 5′ UTRs, ORFs, and 3′ UTRs for hexamers that were significantly enriched in the most stable (top 10% in half-life) and the least stable (bottom 10% in half-life) transcripts. Sequences and their annotations were retrieved from the RefSeq database. The significance of a hexamer was calculated by the Fisher's exact test comparing its frequencies in the most stable and the least stable transcript sets. We assigned a significance score to each hexamer. Significance score equals −log10(_P_-value)*s, where s equals −1 if the hexamer is more common in the least stable transcripts, and s equals 1 otherwise.
Gene ontology analysis
Gene lists were uploaded to DAVID (Huang et al. 2009a,b) along with a background list consisting of all the genes for which half-lives were generated in both cell types. Terms that were significantly over-represented in the list of interest were selected based on _P_-value. For Figure 3A, where half-life distributions of different sets of mRNAs were compared, DAVID was used to retrieve lists of genes associated with terms defined by Simple Modular Architecture Research Tool (SMART) (Letunic et al. 2009). The accession numbers for these terms are C2H2-ZNF #SM00355 or KRAB #SM00349. Half-lives for genes in each list were then used to generate the box and whisker plot and _P_-values were determined using the Kolmogorov-Smirnov Test.
qRT-PCR
Complementary DNA was made using random hexamers and ImProm-II Reverse Transcriptase (Promega) according to the manufacturer's recommendations. The cDNA was used in 10 μL qPCR reactions containing 5 μL of iQ SYBR Green Supermix (Bio-Rad), 0.4 μL each of primer (2.5 mM), 3.4 μL of dH2O and 0.8 μL of cDNA. Thermal cycling was performed using the CFX96 Real-Time PCR Detection System and analyzed using CFX Manager Software (Bio-Rad). Prior to using for the microarrays, the RNA samples were evaluated by measuring the half-lives of FOS and TUT1 mRNAs using GAPDH as a reference. Histone transcript abundances and half-lives were measured using primer sets described previously (Bogenberger and Laybourn 2008), and all other oligonucleotides are described in Supplemental Table 5. All primer sets were standardized using five- or 10-fold cDNA serial dilutions to allow determination of PCR efficiency.
miRNA abundance
Measurement of miRNA abundance by qRT-PCR was performed as previously described (Git et al. 2010). Approximately 1 μg of total RNA was polyadenylated in a 25-μL reaction using the Poly(A) Tailing Kit (Ambion) according to the manufacturer's protocol. After phenol:chloroform extraction, cDNA was made using 500 ng of oligo(dT) adapter (Integrated DNA Technologies Inc) and ImProm-II Reverse Transcriptase (Promega). The resulting cDNA was treated with RNase H (Fermentas) at 37°C for 1 h and 12.5 ng was added to each reaction for qPCR analysis. MicroRNA abundances were measured using human 5S rRNA as a reference gene. Oligonucleotide sequences are listed in Supplemental Table 5.
Western blots
Whole cell lysates were prepared by washing cells twice in PBS (Mediatech) and lysing in RIPA buffer (50 mM Tris (pH 7.4), 150 mM NaCl, 1 mM EDTA, 1% Triton X-100, 1% Na-deoxycholate, 0.1% SDS, 1 mM PMSF). Extracts were sonicated three times for 3 sec each and insoluble material was removed by centrifugation. Protein concentrations were measured using the Bio-Rad Protein Assay (Bio-Rad), and 25-μg samples (which contained approximately ∼4.2 × 10⁴ cells) were then prepared for loading on SDS–polyacrylamide gels by adding 6× SDS protein dye (0.375 M Tris at pH 6.8, 12% SDS, 60% glycerol, 0.6 M DTT, and 0.06% bromophenol blue). Samples for detection of histones H2A, H2B, H3, and H4 were separated on 15% SDS-PAGE gels and stained with Coomassie blue. Samples for detection of all other proteins were resolved on 8% or 10% SDS-PAGE gels and transferred to 0.45-μm PVDF Immobilon Transfer Membranes (Millipore). Membranes used for detection CELF1 were blocked and incubated in 5% nonfat dried milk in 1× PBS and 0.05% Tween20, while all others were blocked and incubated in 5% nonfat dried milk in 1× TBS and 0.1% Tween20. Primary antibodies were as follows: mouse anti-GAPDH (Millipore), mouse anti-alpha-tubulin (Sigma), mouse anti-Histone H1 (Santa Cruz), mouse anti-PCBP1 (Abnova), rabbit anti-PCBP2 (MBL International), rabbit anti-PCBP3 (Sigma), rabbit anti-PCBP4 (Santa Cruz), mouse anti-CELF1 (mAb3B1; Santa Cruz), mouse anti-ELAVL1 (mAb3A2; Santa Cruz), rabbit anti-PUM2 (Bethyl Laboratories), rabbit anti-KHSRP (Novus Biologicals), goat anti-PTBP1 (Abcam), rabbit anti-AUF1 (HNRNPD; Millipore), and rabbit anti-ZFP36L2 (Genway). Secondary antibodies were HRP-conjugated goat anti-mouse IgG antibody (Santa Cruz) and HRP-conjugated goat anti-rabbit IgG (Bio-Rad). SuperSignal West Pico Chemiluminescent Substrate (Thermo Fisher Scientific) was used for detection in concert with a ChemiDoc XRS+ System (Bio-Rad). Quantification was performed using Image Lab 3.0 software (Bio-Rad).
Data access
The microarray data were deposited in the NCBI Gene Expression Omnibus (GEO) (http://www.ncbi.nlm.nih.gov/geo/) under accession number GSE33417.
Acknowledgments
We thank Paul Laybourn and Laurie Stargell for sharing reagents to study histone gene expression and Erin Petrilli of the CSU Genomics and Proteomics Core for performing microarray hybridization. We also thank members of the Wilusz laboratories and Shobha Vasudevan for helpful discussions. This work was funded by an NIH R01 award (GM072481) and ARRA supplement, as well as a Colorado State University CVMBS College Research Council Award to J.W. The Tian lab was funded by an NIH R01 award (GM084089) to B.T.
Author contributions: A.T.N. performed all the wet bench experiments including cell culture, RNA sample preparation, qRT-PCR, and western blotting. J.Y.L. performed bioinformatic analysis of the microarray results. J.W. conceived the project and participated in the experimental design. B.T. designed the bioinformatics aspects of the project and helped with analysis. C.J.W. wrote the paper, participated in experimental design, and performed some of the data analysis. All authors were involved in editing the final manuscript.
Footnotes
[Supplemental material is available for this article.]
References
- Abujarour R, Efe J, Ding S 2010. Genome-wide gain-of-function screen identifies novel regulators of pluripotency. Stem Cells 28: 1487–1497 [DOI] [PubMed] [Google Scholar]
- Anokye-Danso F, Trivedi CM, Juhr D, Gupta M, Cui Z, Tian Y, Zhang Y, Yang W, Gruber PJ, Epstein JA, et al. 2011. Highly efficient miRNA-mediated reprogramming of mouse and human somatic cells to pluripotency. Cell Stem Cell 8: 376–388 [DOI] [PMC free article] [PubMed] [Google Scholar]
- Bar M, Wyman SK, Fritz BR, Qi J, Garg KS, Parkin RK, Kroh EM, Bendoraite A, Mitchell PS, Nelson AM, et al. 2008. MicroRNA discovery and profiling in human embryonic stem cells by deep sequencing of small RNA libraries. Stem Cells 26: 2496–2505 [DOI] [PMC free article] [PubMed] [Google Scholar]
- Becker KA, Ghule PN, Therrien JA, Lian JB, Stein JL, van Wijnen AJ, Stein GS 2006. Self-renewal of human embryonic stem cells is supported by a shortened G1 cell cycle phase. J Cell Physiol 209: 883–893 [DOI] [PubMed] [Google Scholar]
- Bergman N, Moraes KCM, Anderson JR, Zaric B, Kambach C, Schneider RJ, Wilusz CJ, Wilusz J 2007. Lsm proteins bind and stabilize RNAs containing 5′ poly(A) tracts. Nat Struct Mol Biol 14: 824–831 [DOI] [PubMed] [Google Scholar]
- Bermudez O, Jouandin P, Rottier J, Bourcier C, Pagès G, Gimond C 2011. Post-transcriptional regulation of the DUSP6/MKP-3 phosphatase by MEK/ERK signaling and hypoxia. J Cell Physiol 226: 276–284 [DOI] [PubMed] [Google Scholar]
- Bogenberger JM, Laybourn PJ 2008. Human T Lymphotropic Virus Type 1 protein Tax reduces histone levels. Retrovirology 5: 9 doi: 10.1186/1742-4690-5-9 [DOI] [PMC free article] [PubMed] [Google Scholar]
- Castaño Z, Vergara-Irigaray N, Pajares MJ, Montuenga LM, Pio R 2008. Expression of α CP-4 inhibits cell cycle progression and suppresses tumorigenicity of lung cancer cells. Int J Cancer 122: 1512–1520 [DOI] [PubMed] [Google Scholar]
- Fabian MR, Sonenberg N, Filipowicz W 2010. Regulation of mRNA translation and stability by microRNAs. Annu Rev Biochem 79: 351–379 [DOI] [PubMed] [Google Scholar]
- Fidalgo M, Shekar PC, Ang Y-S, Fujiwara Y, Orkin SH, Wang J 2011. Zfp281 functions as a transcriptional repressor for pluripotency of mouse embryonic stem cells. Stem Cells 29: 1705–1716 [DOI] [PMC free article] [PubMed] [Google Scholar]
- Forrai A, Boyle K, Hart AH, Hartley L, Rakar S, Willson TA, Simpson KM, Roberts AW, Alexander WS, Voss AK, et al. 2006. Absence of suppressor of cytokine signalling 3 reduces self-renewal and promotes differentiation in murine embryonic stem cells. Stem Cells 24: 604–614 [DOI] [PubMed] [Google Scholar]
- Gherzi R, Chen C-Y, Trabucchi M, Ramos A, Briata P 2010. The role of KSRP in mRNA decay and microRNA precursor maturation. Wiley Interdiscip Rev RNA 1: 230–239 [DOI] [PubMed] [Google Scholar]
- Gilbert WV, Zhou K, Butler TK, Doudna JA 2007. Cap-independent translation is required for starvation-induced differentiation in yeast. Science 317: 1224–1227 [DOI] [PubMed] [Google Scholar]
- Git A, Dvinge H, Salmon-Divon M, Osborne M, Kutter C, Hadfield J, Bertone P, Caldas C 2010. Systematic comparison of microarray profiling, real-time PCR, and next-generation sequencing technologies for measuring differential microRNA expression. RNA 16: 991–1006 [DOI] [PMC free article] [PubMed] [Google Scholar]
- González-Lamuño D, Loukili N, García-Fuentes M, Thomson TM 2002. Expression and regulation of the transcriptional repressor ZNF43 in Ewing sarcoma cells. Pediatr Pathol Mol Med 21: 531–540 [DOI] [PubMed] [Google Scholar]
- Gratacós FM, Brewer G 2010. The role of AUF1 in regulated mRNA decay. Wiley Interdiscip Rev RNA 1: 457–473 [DOI] [PMC free article] [PubMed] [Google Scholar]
- Gregory RI, Yan K-P, Amuthan G, Chendrimada T, Doratotaj B, Cooch N, Shiekhattar R 2004. The Microprocessor complex mediates the genesis of microRNAs. Nature 432: 235–240 [DOI] [PubMed] [Google Scholar]
- Hagan JP, Piskounova E, Gregory RI 2009. Lin28 recruits the TUTase Zcchc11 to inhibit let-7 maturation in mouse embryonic stem cells. Nat Struct Mol Biol 16: 1021–1025 [DOI] [PMC free article] [PubMed] [Google Scholar]
- Halees AS, Hitti E, Al-Saif M, Mahmoud L, Vlasova-St Louis IA, Beisang DJ, Bohjanen PR, Khabar K 2011. Global assessment of GU-rich regulatory content and function in the human transcriptome. RNA Biol 8: 681–691. [DOI] [PMC free article] [PubMed] [Google Scholar]
- Heo I, Joo C, Kim Y-K, Ha M, Yoon M-J, Cho J, Yeom K-H, Han J, Kim VN 2009. TUT4 in concert with Lin28 suppresses microRNA biogenesis through pre-microRNA uridylation. Cell 138: 696–708 [DOI] [PubMed] [Google Scholar]
- Heyd F, Lynch KW 2011. PSF controls expression of histone variants and cellular viability in thymocytes. Biochem Biophy. Res Comm 414: 743–749 [DOI] [PMC free article] [PubMed] [Google Scholar]
- Hong S-H, Lee J-H, Lee JB, Ji J, Bhatia M 2011. ID1 and ID3 represent conserved negative regulators of human embryonic and induced pluripotent stem cell hematopoiesis. J Cell Sci 124: 1445–1452 [DOI] [PubMed] [Google Scholar]
- Huang DW, Sherman BT, Lempicki RA 2009a. Bioinformatics enrichment tools: Paths toward the comprehensive functional analysis of large gene lists. Nucleic Acids Res 37: 1–13 [DOI] [PMC free article] [PubMed] [Google Scholar]
- Huang DW, Sherman BT, Lempicki RA 2009b. Systematic and integrative analysis of large gene lists using DAVID bioinformatics resources. Nat Protoc 4: 44–57 [DOI] [PubMed] [Google Scholar]
- Huang S, Wu S, Ding J, Lin J, Wei L, Gu J, He X 2010. MicroRNA-181a modulates gene expression of zinc finger family members by directly targeting their coding regions. Nucleic Acids Res 38: 7211–7218 [DOI] [PMC free article] [PubMed] [Google Scholar]
- Hudson BP, Martinez-Yamout MA, Dyson HJ, Wright PE 2004. Recognition of the mRNA AU-rich element by the zinc finger domain of TIS11d. Nat Struct Mol Biol 11: 257–264 [DOI] [PubMed] [Google Scholar]
- Huntley S, Baggott DM, Hamilton AT, Tran-Gyamfi M, Yang S, Kim J, Gordon L, Branscomb E, Stubbs L 2006. A comprehensive catalog of human KRAB-associated zinc finger genes: Insights into the evolutionary history of a large family of transcriptional repressors. Genome Res 16: 669–677 [DOI] [PMC free article] [PubMed] [Google Scholar]
- Huntzinger E, Izaurralde E 2011. Gene silencing by microRNAs: Contributions of translational repression and mRNA decay. Nat Rev Genet 12: 99–110 [DOI] [PubMed] [Google Scholar]
- Ji Z, Tian B 2009. Reprogramming of 3′ untranslated regions of mRNAs by alternative polyadenylation in generation of pluripotent stem cells from different cell types. PLoS ONE 4: e8419 doi: 10.1371journal.pone.0008419 [DOI] [PMC free article] [PubMed] [Google Scholar]
- Jiang J, Chan Y-S, Loh Y-H, Cai J, Tong G-Q, Lim C-A, Robson P, Zhong S, Ng H-H 2008. A core Klf circuitry regulates self-renewal of embryonic stem cells. Nat Cell Biol 10: 353–360 [DOI] [PubMed] [Google Scholar]
- Kaygun H, Marzluff WF 2005. Regulated degradation of replication-dependent histone mRNAs requires both ATR and Upf1. Nat Struct Mol Biol 12: 794–800 [DOI] [PubMed] [Google Scholar]
- Khabar KSA 2005. The AU-rich transcriptome: More than interferons and cytokines, and its role in disease. J Interferon Cytokine Res 25: 1–10 [DOI] [PubMed] [Google Scholar]
- Kiledjian M, Wang X, Liebhaber SA 1995. Identification of two KH domain proteins in the α-globin mRNP stability complex. EMBO J 14: 4357–4364 [DOI] [PMC free article] [PubMed] [Google Scholar]
- Kosinski PA, Laughlin J, Singh K, Covey LR 2003. A complex containing polypyrimidine tract-binding protein is involved in regulating the stability of CD40 ligand (CD154) mRNA. J Immunol 170: 979–988 [DOI] [PubMed] [Google Scholar]
- Lee JE, Lee JY, Wilusz J, Tian B, Wilusz CJ 2010. Systematic analysis of _cis_-elements in unstable mRNAs demonstrates that CUGBP1 is a key regulator of mRNA decay in muscle cells. PLoS ONE 5: e11201 doi: 10.1371/journal.pone.0011201 [DOI] [PMC free article] [PubMed] [Google Scholar]
- Letunic I, Doerks T, Bork P 2009. SMART 6: Recent updates and new developments. Nucleic Acids Res 37: D229–D232 [DOI] [PMC free article] [PubMed] [Google Scholar]
- Li Y, McClintick J, Zhong L, Edenberg HJ, Yoder MC, Chan RJ 2005. Murine embryonic stem cell differentiation is promoted by SOCS-3 and inhibited by the zinc finger transcription factor Klf4. Blood 105: 635–637 [DOI] [PubMed] [Google Scholar]
- Makeyev AV, Liebhaber SA 2002. The poly(C)-binding proteins: A multiplicity of functions and a search for mechanisms. RNA 8: 265–278 [DOI] [PMC free article] [PubMed] [Google Scholar]
- Margolin JF, Friedman JR, Meyer WK, Vissing H, Thiesen HJ, Rauscher FJ III 1994. Krüppel-associated boxes are potent transcriptional repression domains. Proc Natl Acad Sci 91: 4509–4513 [DOI] [PMC free article] [PubMed] [Google Scholar]
- Marzluff WF, Wagner EJ, Duronio RJ 2008. Metabolism and regulation of canonical histone mRNAs: Life without a poly(A) tail. Nat Rev Genet 9: 843–854 [DOI] [PMC free article] [PubMed] [Google Scholar]
- McPherson JP, Tamblyn L, Elia A, Migon E, Shehabeldin A, Matysiak-Zablocki E, Lemmers B, Salmena L, Hakem A, Fish J, et al. 2004. Lats2/Kpm is required for embryonic development, proliferation control and genomic integrity. EMBO J 23: 3677–3688 [DOI] [PMC free article] [PubMed] [Google Scholar]
- Meisner N-C, Filipowicz W 2010. Properties of the regulatory RNA-binding protein HuR and its role in controlling miRNA repression. Adv Exp Med Biol 700: 106–123 [PubMed] [Google Scholar]
- Meshorer E, Yellajoshula D, George E, Scambler PJ, Brown DT, Misteli T 2006. Hyperdynamic plasticity of chromatin proteins in pluripotent embryonic stem cells. Dev Cell 10: 105–116 [DOI] [PMC free article] [PubMed] [Google Scholar]
- Miller MA, Olivas WM 2011. Roles of Puf proteins in mRNA degradation and translation. Wiley Interdiscip Rev RNA 2: 471–492 [DOI] [PubMed] [Google Scholar]
- Miyoshi N, Ishii H, Nagano H, Haraguchi N, Dewi DL, Kano Y, Nishikawa S, Tanemura M, Mimori K, Tanaka F, et al. 2011. Reprogramming of mouse and human cells to pluripotency using mature microRNAs. Cell Stem Cell 8: 633–638 [DOI] [PubMed] [Google Scholar]
- Morin RD, O'Connor MD, Griffith M, Kuchenbauer F, Delaney A, Prabhu A-L, Zhao Y, McDonald H, Zeng T, Hirst M, et al. 2008. Application of massively parallel sequencing to microRNA profiling and discovery in human embryonic stem cells. Genome Res 18: 610–621 [DOI] [PMC free article] [PubMed] [Google Scholar]
- Mullen TE, Marzluff WF 2008. Degradation of histone mRNA requires oligouridylation followed by decapping and simultaneous degradation of the mRNA both 5′ to 3′ and 3′ to 5′. Genes Dev 22: 50–65 [DOI] [PMC free article] [PubMed] [Google Scholar]
- Nowick K, Fields C, Gernat T, Caetano-Anolles D, Kholina N, Stubbs L 2011. Gain, loss and divergence in primate zinc-finger genes: A rich resource for evolution of gene regulatory differences between species. PLoS ONE 6: e21553 doi: 10.1371/journal.pone.0021553 [DOI] [PMC free article] [PubMed] [Google Scholar]
- Peng S, Chen L-L, Lei X-X, Yang L, Lin H, Carmichael GG, Huang Y 2011. Genome-wide studies reveal that Lin28 enhances the translation of genes important for growth and survival of human embryonic stem cells. Stem Cells 29: 496–504 [DOI] [PubMed] [Google Scholar]
- Qi J, Yu J-Y, Shcherbata HR, Mathieu J, Wang AJ, Seal S, Zhou W, Stadler BM, Bourgin D, Wang L, et al. 2009. microRNAs regulate human embryonic stem cell division. Cell Cycle 8: 3729–3741 [DOI] [PMC free article] [PubMed] [Google Scholar]
- Schmidt M-J, West S, Norbury CJ 2011. The human cytoplasmic RNA terminal U-transferase ZCCHC11 targets histone mRNAs for degradation. RNA 17: 39–44 [DOI] [PMC free article] [PubMed] [Google Scholar]
- Schnall-Levin M, Rissland OS, Johnston WK, Perrimon N, Bartel DP, Berger B 2011. Unusually effective microRNA targeting within repeat-rich coding regions of mammalian mRNAs. Genome Res 21: 1395–1403 [DOI] [PMC free article] [PubMed] [Google Scholar]
- Schultz SS, Desbordes SC, Du Z, Kosiyatrakul S, Lipchina I, Studer L, Schildkraut CL 2010. Single-molecule analysis reveals changes in the DNA replication program for the POU5F1 locus upon human embryonic stem cell differentiation. Mol Cell Biol 30: 4521–4534 [DOI] [PMC free article] [PubMed] [Google Scholar]
- Sharova LV, Sharov AA, Nedorezov T, Piao Y, Shaik N, Ko MSH 2009. Database for mRNA half-life of 19 977 genes obtained by DNA microarray analysis of pluripotent and differentiating mouse embryonic stem cells. DNA Res 16: 45–58 [DOI] [PMC free article] [PubMed] [Google Scholar]
- Shepard PJ, Choi E-A, Lu J, Flanagan LA, Hertel KJ, Shi Y 2011. Complex and dynamic landscape of RNA polyadenylation revealed by PAS-Seq. RNA 17: 761–772 [DOI] [PMC free article] [PubMed] [Google Scholar]
- Subramanyam D, Lamouille S, Judson RL, Liu JY, Bucay N, Derynck R, Blelloch R 2011. Multiple targets of miR-302 and miR-372 promote reprogramming of human fibroblasts to induced pluripotent stem cells. Nat Biotechnol 29: 443–448 [DOI] [PMC free article] [PubMed] [Google Scholar]
- Takahashi K, Tanabe K, Ohnuki M, Narita M, Ichisaka T, Tomoda K, Yamanaka S 2007. Induction of pluripotent stem cells from adult human fibroblasts by defined factors. Cell 131: 861–872 [DOI] [PubMed] [Google Scholar]
- Terme J-M, Sesé B, Millán-Ariño L, Mayor R, Belmonte JCI, Barrero MJ, Jordan A 2011. Histone H1 variants are differentially expressed and incorporated into chromatin during differentiation and reprogramming to pluripotency. J Biol Chem 286: 35347–35357 [DOI] [PMC free article] [PubMed] [Google Scholar]
- Urrutia R 2003. KRAB-containing zinc-finger repressor proteins. Genome Biol 4: 231 doi: 10.1186/gb-2003-4-10-231 [DOI] [PMC free article] [PubMed] [Google Scholar]
- Vlasova IA, Tahoe NM, Fan D, Larsson O, Rattenbacher B, Sternjohn JR, Vasdewani J, Karypis G, Reilly CS, Bitterman PB, et al. 2008. Conserved GU-rich elements mediate mRNA decay by binding to CUG-binding protein 1. Mol Cell 29: 263–270 [DOI] [PMC free article] [PubMed] [Google Scholar]
- Wang Y, Liu CL, Storey JD, Tibshirani RJ, Herschlag D, Brown PO 2002. Precision and functional specificity in mRNA decay. Proc Natl Acad Sci 99: 5860–5865 [DOI] [PMC free article] [PubMed] [Google Scholar]
- Winkler GS 2010. The mammalian anti-proliferative BTG/Tob protein family. J Cell Physiol 222: 66–72 [DOI] [PubMed] [Google Scholar]
- Witzgall R, O'Leary E, Leaf A, Onaldi D, Bonventre JV 1994. The Krüppel-associated box-A (KRAB-A) domain of zinc finger proteins mediates transcriptional repression. Proc Natl Acad Sci 91: 4514–4518 [DOI] [PMC free article] [PubMed] [Google Scholar]
- Yang L, Duff MO, Graveley BR, Carmichael GG, Chen L-L 2011. Genomewide characterization of non-polyadenylated RNAs. Genome Biol 12: R16 doi: 10.1186/gb-2011-12-2-r16 [DOI] [PMC free article] [PubMed] [Google Scholar]
- Zhu J, Chen X 2000. MCG10, a novel p53 target gene that encodes a KH domain RNA-binding protein, is capable of inducing apoptosis and cell cycle arrest in G(2)-M. Mol Cell Biol 20: 5602–5618 [DOI] [PMC free article] [PubMed] [Google Scholar]