Structural insights into transient receptor potential vanilloid type 1 (TRPV1) from homology modeling, flexible docking, and mutational studies (original) (raw)
. Author manuscript; available in PMC: 2012 Aug 16.
Published in final edited form as: J Comput Aided Mol Des. 2011 Mar 30;25(4):317–327. doi: 10.1007/s10822-011-9421-5
Abstract
The transient receptor potential vanilloid subtype 1 (TRPV1) is a non-selective cation channel composed of four monomers with six transmembrane helices (TM1-TM6). TRPV1 is found in the central and peripheral nervous system, and it is an important therapeutic target for pain relief. We describe here the construction of a tetrameric homology model of rTRPV1. We experimentally evaluated by mutational analysis the contribution of residues of rat TRPV1 (rTRPV1) contributing to ligand binding by the prototypical TRPV1 agonists capsaicin and resiniferatoxin. We then performed docking analysis using our homology model. The docking results with capsaicin and RTX showed that our homology model was reliable, affording good agreement with our mutation data. Additionally, the binding mode of a simplified RTX (sRTX) ligand as predicted by the modeling agreed well with those of capsaicin and RTX, accounting for the high binding affinity of the sRTX ligand for TRPV1. Through the homology modeling, docking and mutational studies, we obtained important insights into the ligand-receptor interactions at the molecular level which should prove of value in the design of novel TRPV1 ligands.
Keywords: transient receptor potential vanilloid type 1 (TRPV1), capsaicin, resiniferatoxin (RTX), homology modeling, docking, mutation
1. Introduction
TRPV1 (Vanilloid receptor 1 or VR1) is a member of the transient receptor potential (TRP) superfamily.{Alawi, #42} The receptor is activated by protons, heat, endogenous substances such as anandamide and lipoxygenase products, and by natural ligands such as capsaicin (CAP) and resiniferatoxin (RTX).{Szallasi, 1999, #43} Since TRPV1 functions as a non-selective cation channel with high Ca2+ permeability, its activation by these agents leads to an increase in intracellular Ca2+ that results in excitation of primary sensory neurons and ultimately in the central perception of pain. The involvement of this receptor in both pathological and physiological conditions suggests that the blocking of this receptor activation, by desensitization or antagonism, should have considerable therapeutic utility.{Wong, 2009, #44} TRPV1 antagonists in particular have attracted much attention as promising drug candidates to inhibit the transmission of nociceptive signals from the periphery to the CNS and to block other pathological states associated with this receptor.{Szallasi, 2007, #45, Lazar, 2009, #16} Multiple TRPV1 antagonists are currently in clinical development, with neuropathic pain being a leading therapeutic target.{Wong, 2009, #44, Gunthorpe, 2009, #46}
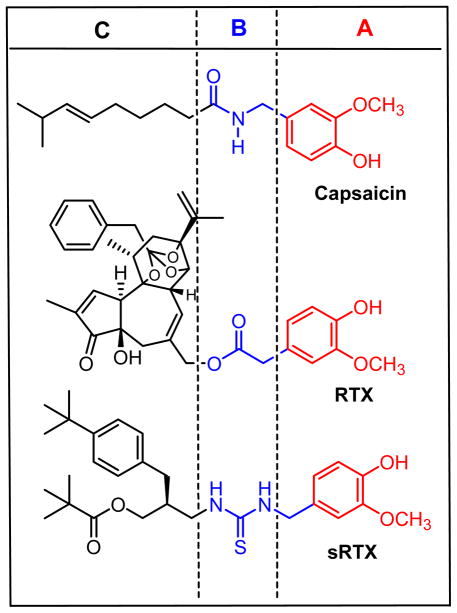
Among TRPV1 activators, resiniferatoxin (RTX), a tricyclic diterpene isolated from Euphorbia resinifera, functions pharmacologically as an ultrapotent agonist, displaying 103- to 104-fold greater potency than the prototypical agonist capsaicin.{Appendino, 1997, #47, Szallasi, 1989, #48} Structure-activity relations for capsaicinoids and RTX derivatives have highlighted three critical structural features - the A-region (4-hydroxy-3-methoxyphenyl), B-region (amide for CAP, C20-ester for RTX), and C-region (nonenyl for CAP, diterpene for RTX) (Figure 1).{Lee, 2003, #49} Analysis has indicated that the 4-hydroxy-3-methoxyphenyl, C20-ester, C3-keto, and orthophenyl groups represent principal pharmacophores in RTX for TRPV1 and have proven to be important elements for the design of novel TRPV1 ligands.{Lee, 2003, #49}
Figure 1.
Structures of capsaicin, resiniferatoxin (RTX), and sRTX. These compounds are composed of three pharmacophoric regions: (A-region) 4-hydroxy-3-methoxyphenyl, (B-region) the connecting amide, ester or thiourea groups, (C-region) lipophilic side chains.
Previously, we have demonstrated that so-called simplified RTX (sRTX) analogues containing these four principal pharmacophores showed potent TRPV1 agonism with high binding affinity. For example, a series of _N_-(3-pivaloyloxy-2-benzylpropyl)-_N_′-(4-hydroxy-3-methoxybenzyl)thioureas were found to be potent TRPV1 agonists with high affinity for rat TRPV1 heterologously expressed in Chinese hamster ovary (CHO) cells and the specific sRTX illustrated in Figure 1 showed high affinity TRPV1 agonism with a Ki = 11 nM in an [3H]RTX binding assay on DRG neurons.{Lee, 2001, #50} The pharmacophoric comparison of capsaicin, RTX and sRTX is represented in Figure 1.
TRPV1 is a tetrameric membrane protein with each monomer composed of six transmembrane helices (TM1-TM6) and cytosolic N- and C-terminal tails.{Kedei, 2001, #39} The membrane region consists of two domains - a pore domain (TM5-TM6), containing a pore-forming loop between TM5 and TM6, and a voltage sensor domain (TM1-TM4). The overall topology of TRPV1 is known to be similar to that of voltage-gated K+ channels.{Harteneck, 2000, #41} The recently reported single-particle electron cryomicroscopy (cryo-EM) structure, with a resolution of 19 Å, revealed that TRPV1 has the four monomers symmetrically arrayed to generate two distinct domains: a large open basket-like domain, likely corresponding to the cytoplasmic N- and C-terminal portions, and a more compact domain, corresponding to the transmembrane portion.{Moiseenkova-Bell, 2008, #15}
Although an X-ray crystal structure has not been reported as yet, several research groups have proposed TRPV1 models and tried to predict the binding modes of some ligands in terms of their models. Jordt and Julius suggested the first helix-packing model of TRPV1 with capsaicin, but this was just a schematic structural model.{Jordt, 2002, #17} Gavva and co-workers constructed a model limited to the TM3-TM4 regions and predicted binding modes of capsaicin and RTX in which the same residues in TRPV1 interacted with the vanillyl moieties of the two ligands.{Gavva, 2004, #18} Middleton et al. built a homology model for the TM1-TM4 regions using the isolated voltage-sensor domain from KvAP; this model oriented the vanillyl moieties of capsaicin and RTX in opposite directions in TRPV1.{Chou, 2004, #19} A limitation of both of these last two models is that they were built from only a portion of the transmembrane regions, and their proposed binding modes for ligands showed appreciable discrepancies, especially with respect to the interactions of the vanillyl moieties of the ligands with TRPV1. Moreover, docking studies using those models could not reasonably explain the structure-activity relationships (SAR) of TRPV1 ligands. Finally, since the binding site of the ligands seems to be located between monomers, the models could not account for the influence of the neighboring monomer on the ligand binding.
In order to obtain a more reliable TRPV1 homology model, we have now constructed a tetramer model of rTRPV1 based on our mutation data and the emerging structural insights regarding TRPV1 {Moiseenkova-Bell, 2008, #15}. The model was verified by a docking study of the prototypical agonists, along with the mutation data. Using the refined homology model, the binding mode of our potent sRTX ligand was predicted. The homology model and flexible docking results provide structural insights for the ligand-receptor interactions at the molecular level and should prove of great value in the design of novel potent TRPV1 ligands.
2. Results and discussion
2.1
We generated and verified the sequence of a series of rat TRPV1 mutants within the TM3 (Y511A, Y511F) and TM4 (M547L, T550A, T550I, T550S) regions, as described in Materials and Methods, to assess their roles in ligand recognition. The wild-type and mutant TRPV1 constructs were tagged with GFP to monitor expression and then transiently transfected into Chinese hamster ovary (CHO) cells. The effects of the mutations on ligand recognition were assessed for capsaicin from their dose response curves for stimulation of 45Ca2+ uptake and expressed as the EC50 values, which represent the doses yielding half-maximal stimulation (Table 1). For RTX, its potencies for the mutated TRPV1 variants were determined by direct binding assays, using [3H]RTX, and the values were expressed as the dissociation constants (Kd values) (Table 2). Maximal binding capacity of the Y511F, M547L, T550A, T550I, T550S mutants were 40 to 60 % (2600 to 3800 fmol/mg protein) of the level of that of the wild type receptor (6400 fmol/mg protein). The highest final [3H]RTX concentration (140 nM) was insufficient to obtain a full dose response curve in the case of the Y511A mutant, preventing a measurement of Kd for that mutation.
Table 1.
Effect of mutated residues on capsaicin affinity for rTRPV1 as determined by stimulation of 45Ca2+ uptake.
| Mutation | EC50 (nM)* | Ratio |
|---|---|---|
| WT | 7.7 ± 2.5 | 1.0 |
| Y511F | 213 ± 57 | 28 |
| Y511A | 3800 ± 400 | 494 |
| M547L | 6.67 ± 1.1 | 0.9 |
| T550I | 511± 12 | 66 |
| T550S | 45.2 ± 2.2 | 5.9 |
| T550A | 116 ± 12 | 15 |
Table 2.
Effect of mutated residues on RTX binding affinity for rTRPV1.
| Mutation | Kd (pM)* | Ratio |
|---|---|---|
| WT | 203 ± 20 | 1.0 |
| Y511F | 790 ± 130 | 3.9 |
| M547L | 2380 ± 240 | 11.7 |
| T550I | 4160 ± 820 | 20.5 |
| T550S | 233 ± 22 | 1.14 |
| T550A | 417 ± 62 | 2.05 |
The data highlight the importance of these residues for ligand recognition, demonstrate the differential recognition of capsaicin and RTX, and provide a basis for assessing the validity of the computer modeling.
2.2. Homology modeling of rTRPV1
Since our mutation study and analysis of receptor activities were conducted with rat TRPV1 (rTRPV1), we built the three-dimensional structure of rTRPV1. The X-ray crystal structure of the voltage-dependent shaker family K+ channel (PDB ID: 2R9R){Long, 2007, #6} was chosen for a template since it contains the full six transmembrane helices (TM1-TM6) as in TRPV1. Although both TRPV1 and the voltage-dependent K+ channel have the six transmembrane regions in common, their level of sequence identity is still low. We performed multiple sequence alignment using CLUSTAL W and manually refined it to properly align the transmembrane regions based on the predicted TM1-TM6 residues according to topology prediction tools{#10}. The resulting alignment displayed sequence identity between the template and rTRPV1 of 11.9% and sequence similarity of 33.9% (Figure 2).
Figure 2.
Sequence alignment of the rat TRPV1 and the voltage-dependent shaker family K+ channel (PDB ID: 2R9R). The identical, strongly conserved, and weakly conserved residues are denoted, respectively, with boxes of dark-blue box with asterisk, blue with double dots, and light-blue with single dot marks.
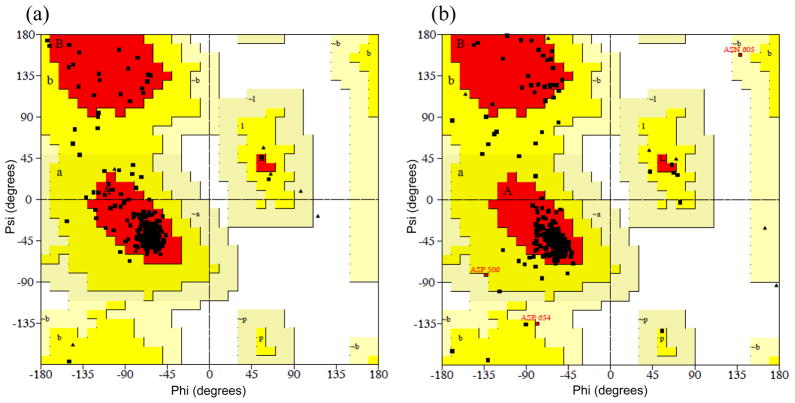
Among the ten models generated by the MODELER program, the model with the lowest probability density function (PDF) total energy was selected and further refined by energy minimization. The quality of the refined model was assessed by a Ramachandran plot with the PROCHECK program, which evaluates the stereochemical quality of a protein structure by analyzing residue-by-residue geometry and overall structural geometry.{#9, Laskowski, 1996, #2} The Ramachandran plot of the template X-ray crystal structure showed that 89.7% of the residues were in the most favored regions and 10.3% in additional allowed regions (Figure 3a). All the residues of our refined model were also found in the allowed regions: 86.4% of the residues in the most favored regions, 12.3% in additional allowed regions, and 1.3% in generously allowed regions (Figure 3b). As another assessment criterion, the ERRAT score gives an overall quality factor for non-bonded atomic interactions, and a score of greater than 50 is acceptable.{#9, Colovos, 1993, #3} The template and our refined model yielded ERRAT scores of 95.420 and 86.905, respectively, and the values were clearly well within the range of high quality. Consequently, the Ramachandran plot and ERRAT analysis indicated that our refined homology model of the rTRPV1 monomer is reasonable and reliable enough to investigate the binding interactions of ligands.
Figure 3.
Ramachandran plots of (a) the template voltage-dependent shaker family K+ channel (PDB ID: 2R9R) and (b) the rTRPV1 homology model monomer. The shading on the plot represents the different regions (red: the most favored regions; yellow: the allowed regions; beige: the generously allowed regions; and white: the disallowed regions).
As shown in Figure 4, our refined monomer model has six transmembrane helices with a voltage sensor domain and a pore domain. These two domains are V-shaped and connected through the linker between TM4 and TM5. The voltage sensor domain consists of four helices (TM1-TM4) and shows a classical anticlockwise topology. The pore domain (TM5-TM6) has a pore-forming loop between the two helices and demonstrates antiparallel stacking.
Figure 4.
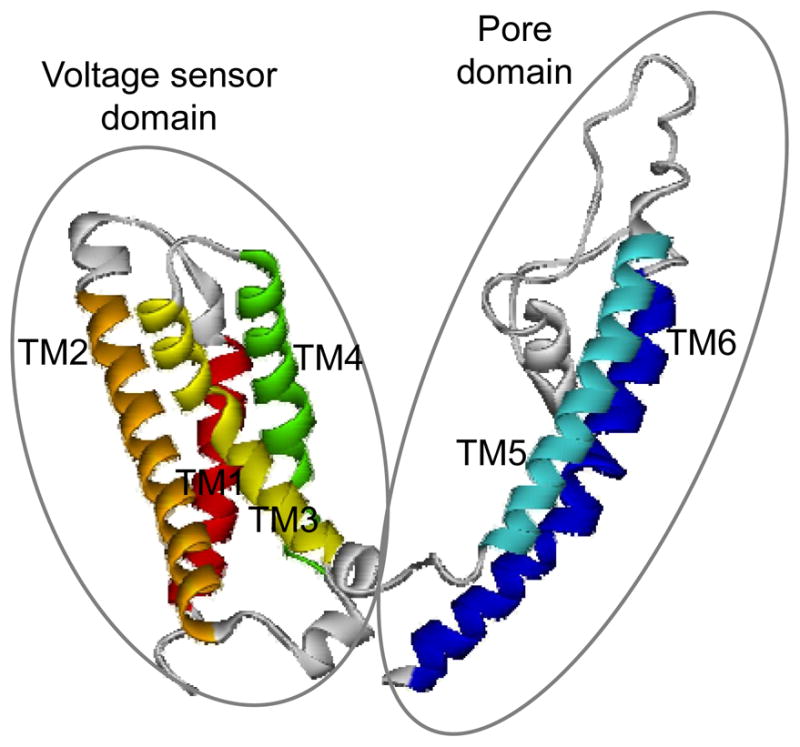
Homology model of the rTRPV1 monomer. It is represented in the secondary structure with the voltage sensor and pore domains circled. The six transmembrane helices (TM1-TM6) are colored by red, orange, yellow, green, cyan, and blue, respectively, and the loop regions are in white.
The functional TRPV1 is a homotetramer{Kedei, 2001, #39} and our preliminary docking study indicated that the ligand binding may occur between two monomers. Therefore, we assembled the tetramer model by aligning our refined monomer model on the reported TRPV1 tetramer model{Brauchi, 2007, #5}, which had been optimized with a phosphatidylinositol 4,5-bisphosphate (PIP2) bound to a pore domain, remote from the vanilloid binding site according to mutation studies.
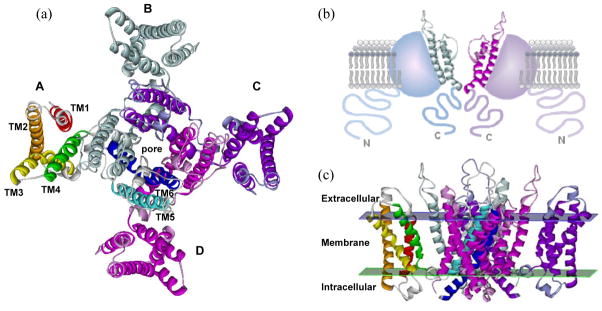
The constructed tetramer model was refined by energy minimization, and the resulting tetramer model is as shown in Figure 5. The overall structure is symmetrical with the four identical monomers arranged around the central pore (Figure 5a). The pore domain (TM5-TM6) of each monomer is partially fitted between the voltage sensor domain (TM1-TM4) and the pore domain of a neighboring monomer. In addition, the pore region is formed by the loop between TM5 and TM6 of each monomer (Figure 5a and 5b). To better understand the topology of the six helices embedded in the membrane, we predicted the membrane region in our tetramer model using Add Membrane and Orient Molecule protocol. The resulting model with intracellular and extracellular membranes is as shown in Figure 5c. The details of the predicted TM1-TM6 regions are summarized in Supplementary data.
Figure 5.
Tetrameric architecture of the rTRPV1 homology model. (a) Model viewed from the extracellular side. One monomer (A chain) is represented as in Figure 4, and three other monomers (B, C, and D chain) are in light-blue, purple, and magenta. The pore region is formed by the loop between TM5 and TM6 from four monomers. (b) Schematic diagram of the rTRPV1 structure. The voltage sensor domains (TM1-TM4) of A and C chains are displayed as (bluish and purplish) spherical sections with their cytosolic N-terminal tails, and the pore domains (TM5-TM6) of the B and D chains are in the secondary structures with their C-terminal tails. (c) Model viewed parallel to the membrane. The hydrophilic heads of the membrane are displayed as blue and green planes.
2.3. Flexible docking studies
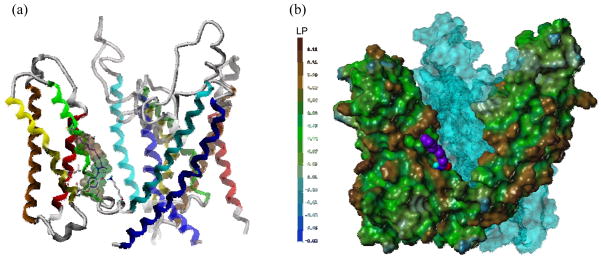
The mutation studies by us and other groups, along with comparisons of TRPV1 variants from species sensitive or insensitive to vanilloids, have identified important residues for ligand binding such as Tyr511, Met547, and Thr550.{Jordt, 2002, #17, Gavva, 2004, #18, Chou, 2004, #19} Their mutation leads to large changes in the activity of capsaicin or RTX, as expected for the regions including those residues representing the ligand binding site. This site lies in the TM3/TM4 region of the voltage sensor domain in our model, located at the voltage sensor domain of a monomer and near the pore domain of an adjacent momomer (Figure 6). The binding site has a deep bottom hole surrounded by Tyr511, Tyr565, and Lys571 and an upper hydrophobic region composed of Phe543 and Met547. The key residues for the binding of ligands are exposed to the surface allowing for easy access of ligand for binding. In order to evaluate the consistency of our homology model with the mutation data, we performed a docking study with the prototypical agonists, capsaicin and RTX.
Figure 6.
rTRPV1 ligand binding site at the interface of monomers. (a) Ribbon and tube representation of rTRPV1. rTRPV1 is displayed in the secondary structure and colored as in Figure 4. (b) Surface representation of rTRPV1. It is generated by MOLCAD and colored to show its lipophilic potential (LP), which ranges from brown (highest lipophilic area) to blue (highest hydrophilic area). Capsaicin is docked in the putative binding site and depicted with a spacefilling model with carbon atoms in purple. The surface of a neighboring monomer is colored in cyan and, for clarity, only two monomers are shown.
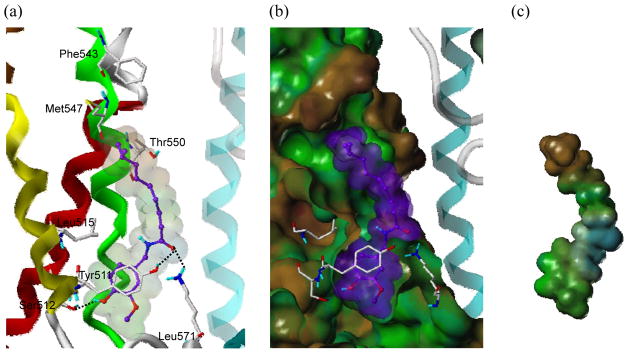
The docking results for capsaicin indicated that the vanillyl moiety (A-region) oriented toward Tyr511 in the deep bottom hole, while the tail end (C-region) extended toward Met547 in the upper hydrophobic region (Figure 7). The vanillyl moiety formed π-π stacking and hydrophobic interactions with Tyr511 and H-bonding with Ser512. In addition, the carbonyl group (B region) made H-bonding interactions with Tyr511 and Leu571. This docking result is in accordance with the mutation data. Mutation of Tyr511 to Phe affected the activity of capsaicin only slightly, but when it was mutated to Ala, it caused the loss of the π-π stacking and H-bonding capabilities, leading to a significant decrease in the capsaicin activity. The mutation of Thr550 to Ile also caused a significant decrease in capsaicin activity, but when it was mutated to Ala or Ser its influence was much smaller. It would reflect the bulky side chain of Ile disturbing the binding of the nonenyl tail (C-region) of capsaicin. Although the hydrophobic nonenyl tail oriented toward the upper hydrophobic region of the binding site, it did not fully occupy the hydrophobic region of the two shallow hydrophobic areas composed of Phe543 and Met547 because it is linear and too short to reach both areas (Figure 7b and 7c). Our docking study indicated that the overall size, shape and/or hydrophobicity of the C-region are important for binding, consistent with the previous structure-activity relationship (SAR) studies that the compounds with carbon chains longer than that in capsaicin showed better activity{Christopher S. J. Walpole, 1993, #53}.
Figure 7.
Predicted binding mode of capsaicin with rTRPV1 and surface representations. (a) Binding mode of capsaicin. The key interacting residues are marked and displayed as a capped-stick representation with carbon atoms in white. Individual helices are colored red (TM1), yellow (TM3), and green (TM4) and the helices of the neighboring monomer are displayed transparently. The ligand is depicted as a ball-and-stick representation with carbon atoms in purple. Hydrogen bonds are drawn in black dashed lines and non-polar hydrogens are undisplayed for clarity. (b) Surface of rTRPV1 and capsaicin. The Fast Connolly surface of rTRPV1 is generated by MOLCAD and its lipophilic potential is displayed. The surface of rTRPV1 is Z-clipped and that of the ligand is in its carbon color for clarity. (c) Surface of capsaicin with its lipophilic potential displayed. The Van der Waals surface of the ligand is presented with its lipophilic potential displayed.
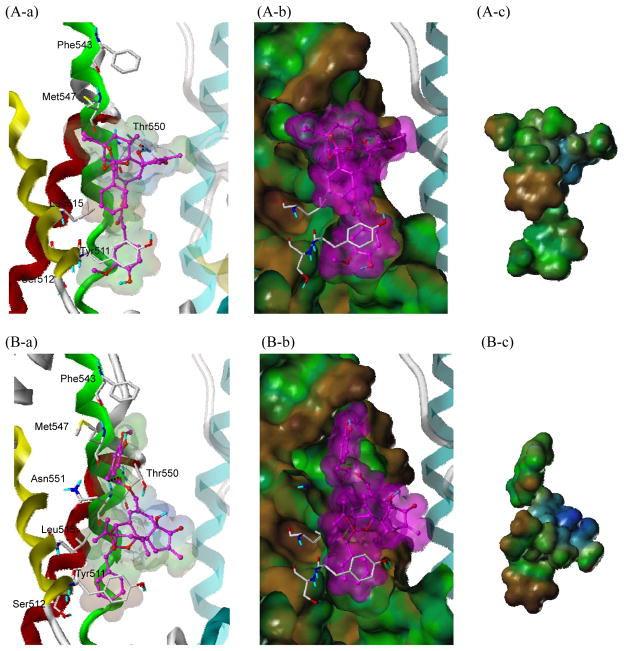
In the case of RTX, the vanillyl moiety (A-region) appeared to occupy the deep bottom hole and form the π-π stacking with Tyr511 as did that of capsaicin (Figure 8A). The importance of Tyr511 in RTX binding was also confirmed by our mutation study. When Tyr511 was mutated to Phe, the binding affinity of RTX decreased less than 4-fold, as the important π-π stacking and hydrophobic interactions of the vanillyl group of RTX were maintained. Compared with relatively short and linear tail of capsaicin, the C13-propenyl group of RTX contributed to the hydrophobic interaction with Met547, and its importance in RTX binding was confirmed by the mutation studies by us and other groups{Gavva, 2004, #18, Chou, 2004, #19}. When Met547 was mutated to Ile, the binding affinity of RTX decreased over 11-fold. This would fit with the greater ability of Met547 than of Leu to extend to make the hydrophobic interaction with RTX. In addition, the C4-OH group of RTX seemed to fit well with the small side chain of Thr550 in addition to H-bonding with the residue. This docking result is in agreement with the mutation data that both the mutated T550S and T550A did not cause any binding loss compared to the wild type, while T550I made a drastic decrease (over 20-fold) in RTX binding affinity. As with capsaicin binding, the bulky side chain of Ile could cause steric interference with the binding of RTX. It was noticeable that the orthophenyl group of RTX made a hydrophobic interaction with Leu515 (Figure 8A-a and b). The ultrapotency of RTX might be because it could fully occupy the binding site, taking full advantage of the multiple possible binding interactions with TRPV1.
Figure 8.
Predicted two binding modes of RTX with rTRPV1 and surface representations. (A) The major binding and (B) the minor binding mode. The ligand is depicted as a ball-and-stick representation with carbon atoms in magenta ; the details are the same as in Figure 7.
Since RTX has phenyl rings both in the A- and C-regions and there are hydrophobic residues at both ends of the binding site, RTX could flip over and have a minor binding mode (Figure 8B). In this case, the vanillyl moiety would point toward Met547 and make the hydrophobic interaction. Correspondingly, the orthophenyl group would orient toward Tyr511 and occupy the deep bottom hole. The C20-ester seemed to make H-bonding interactions with Asn551, and the C13-propenyl group formed the hydrophobic interaction with Leu515.
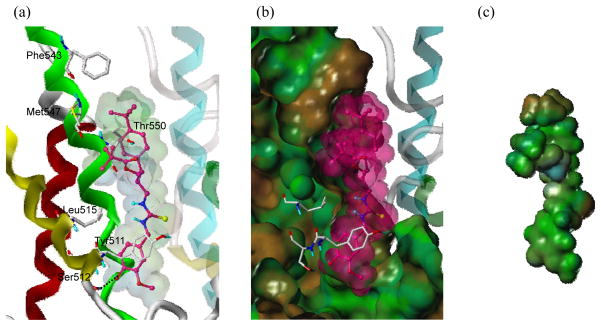
Using the homology model, we also tried to predict the binding mode of a simplified RTX (sRTX), _N_-{3-pivaloyloxy-2-(4-_t_-butylbenzyl)propyl}-_N_′-(4-hydroxyl-3-methoxybenzyl)thiourea, which has the vanillyl moiety in the A-region, the thiourea in the B-region, and the 4-_t_-butylbenzyl and pivaloyloxymethyl groups in the C-region (Figure 1). Docking results for the sRTX demonstrated that the vanillyl moiety (A-region) was located in the deep bottom hole of the binding site and made the H-bonding interaction with Ser512 (Figure 9). Furthermore, the two bulky and hydrophobic groups in the C-region showed an excellent fit to the upper hydrophobic region formed from the two shallow hydrophobic areas composed of Phe543 and Met547. The pivaloyloxymethyl group extended toward Met547 and made a hydrophobic interaction. In addition, the branched 4-_t_-butylbenzyl group oriented toward Phe543 and formed another hydrophobic interaction. It was noticeable that the thiourea group in the B-region contributes to the appropriate positioning of the 4-_t_-butylbenzyl and pivaloyloxymethyl groups in the upper hydrophobic region.
Figure 9.
Predicted binding mode of sRTX in rTRPV1 and surface representations. The ligand is depicted as a ball-and-stick representation with carbon atoms in reddish pink ; the details are the same as in Figure 7.
3. Conclusions
The mutation study on the important residues of rTRPV1 in the ligand binding was performed with the prototypical TRPV1 agonists. We constructed a tetramer homology model of rTRPV1 and performed flexible docking studies using this model. The docking results with capsaicin and RTX showed that our homology model was reliable and in good agreement with the effect of mutations on their binding. Furthermore, the binding mode of a sRTX was predicted and the result agreed well with those of capsaicin and RTX. The vanillyl moiety (A-region) was oriented toward Tyr511 in the deep bottom hole of the binding site and the opposite part (C-region) formed the hydrophobic interaction with Phe543 and Met547. This binding mode could explain the high binding affinity of sRTX. Through the homology modeling and docking studies, we obtained valuable information on the ligand binding at the molecular level and this model should assist us in the design of novel TRPV1 ligands.
4. Materials and methods
4.1 Constructs
The wild-type rat TRPV1 (sequence corresponds to AF029310) containing entry plasmid (Invitrogen’s Gateway technology, Carlsbad, CA) was used to generate the different binding site mutants according to the GeneTaylor Mutagenesis System manual. The full sequence of the mutants was verified by sequencing (DNA Minicore NIH, NCI, Building 37, Bethesda, MD). The N terminal GFP tagged constructs were generated by LR reaction between the appropriate entry plasmid and the pcDNA DEST53 destination plasmid (Invitrogen’s Gateway technology). Further sequencing reactions were set up to validate the alignment and the presence of mutation site along with restriction reactions to verify the size and purity of the constructs.
Cell culture and transfection
CHO cells were cultured in Ham’s F12 medium with 1 mM L-glutamine supplemented with 10 % FBS, 25 mM HEPES Buffer, pH 7.2. At 60–80% confluency, 10 μg GFP tagged wild type or mutant rat TRPV1 encoding plasmid was used to transfect cells with Lipofectamine and Plus reagent for 3 hours in OptiMEM medium. After transfection, OptiMEM was replaced with CHO culture medium and the cells were cultured for 48 hr before binding assays or the cells were harvested with trypsin and 1 T75 flask of cells were seeded onto 4–5 24-well plates for 45Ca uptake experiments. All of the chemicals and media were from Invitrogen Carlsbad, CA, USA.
[3H]RTX Binding Assay
Saturation binding assays were carried out in Ca2+ and Mg2+ free DPBS (Dulbecco’s phosphate buffered saline) (Invitrogen) containing 0.25 mg/ml bovine serum albumin (Sigma, St Louis, MO). 100 μl of transfected CHO cell pellet (which corresponds to 1/30 of the contents of a T75 flask of confluent, transfected CHO cells) was incubated in a 350 μl final volume with half dilutions of the stock 4.5 μM [3H]RTX (Perkin Elmer Life Sciences Inc, Boston, MA) at 37 °C. Nonspecific binding was measured in the presence of 100 nM nonradioactive RTX (Alexis, San Diego, CA). We also used 30 times “diluted” [3H]RTX to expand the concentration range of the assay. After 60 min, the mixture was cooled on ice; nonspecific binding of [3H]RTX was reduced by addition of 200 μg per tube acid glycoprotein (ICN Pharmaceuticals, Costa Mesa, CA, USA). After 15 minutes of incubation on ice the mixture was transferred to 1.5-ml plastic, capped centrifuge tubes and spun at 12200 rpm 4 °C for 15 min. To determine the concentration of free [3H]RTX, 200-μl aliquots of supernatant were transferred to scintillation vials. Membrane bound [3H]RTX was determined from the pellets. The protein concentration of each sample was also determined using the BCA protein assay kit (Thermo Fisher Scientific (Pierce Biotechnology Inc), Rockford, IL, USA).
45Ca uptake measurement
Wild-type and mutant rTRPV1-GFP expressing CHO cells were cultured for 36–48 hours after transfection in 24-well plates. For measurement of agonist 45Ca uptake, plates were incubated for 5 minutes at 37 °C in a water bath in 400 μl DMEM (Invitrogen) containing 1.8 mM CaCl2, 0.25 mg/ml bovine serum albumin (Sigma), 1 μCi 45Ca2+ (ICN Pharmaceuticals) and the different concentrations of capsaicin. Immediately after the incubation the medium was removed quickly, the wells were washed twice with DPBS (Invitrogen), and the cells were lysed by addition of 400 μl/well RIPA buffer (50 mM Tris-Cl, pH 7.4, 150 mM NaCl, 1 % Triton X-100, 0.1 % SDS and 1 % sodium deoxycholate, all from Sigma) and shaken slowly for at least 1 hour. From each well, all of the lysate was transferred to a scintillation vial and the radioactivity was determined. Each experimental condition was assayed in quadruplicate in each experiment and each experiment was performed at least three times.
Data analysis
Data for the [3H]RTX binding and 45Ca2+ uptake assays were fitted to the Hill equation and KD and Bmax values were calculated using Microcal™ Origin software (Microcal Software Inc, Northampton, MA, USA).
4.2. Homology model building
The primary sequence of rTRPV1 (accession: O35433) was downloaded from the UniProtKB database (http://www.uniprot.org/uniprot/). Because we focused on the transmembrane region, the sequences of the N- and C-terminal regions were removed. The sequence alignment of the rTRPV1 and the voltage-dependent shaker family K+ channel (PDB code: 2R9R) was carried out using the Align Multiple Sequence protocol, which was based on the CLUSTAL W program which aligns multiple sequences using a progressive pairwise alignment algorithm{Thompson, 1994, #11}. Using transmembrane prediction tools (HMMTOP, TMHMM, TMpred, etc){#10}, the alignment was manually refined. Based on the refined sequence alignment, the homology model of rTRPV1 was built by the MODELER 9v4 program. Among the resulting ten models, the model with the lowest probability density function (PDF) total energy was selected, and loop and side chain refinement was carried out. Then, the model was energy minimized with the CHARMm force field until the rms of the conjugated gradient was 0.05 kcal/mol·Å using the implicit solvent model of the Generalized Born with Molecular Volume (GBMV) method {Feig, 2004, #22} and harmonic restraints with a force constant of 10 to backbone atoms of the residues. The refined model was evaluated by a Ramachandran plot with PROCHECK and ERRAT from the Structure Analysis and Verification Server (SAVES){#9}.
To make the tetramer model, the monomer coordinates were aligned with the reported tetramer model{Brauchi, 2007, #5} using the Align and Superimposed Protein protocol. The generated tetramer model was energy minimized using a CHARMm force field until the rms of the steepest descent gradient was 0.05 kcal/mol·Å with the Generalized Born with simple SWitching (GBSW) method {Feig, 2004, #22} and harmonic restraints with a force constant of 10 to backbone atoms of the residues. To predict the transmembrane regions in the tetramer model, the Add Membrane and Orient Molecule protocol was preformed with GBSW. It uses a stepwise search algorithm for the optimal orientation of the molecule relative to an implicit membrane. The optimal orientation corresponds to the minimum of the solvation energy calculated in Generalized Born/solvent accessible surface area approximation.{Inc., 2009, #12}
4.3. Molecular docking/Flexible docking
The ligand structures were generated with Concord and energy minimized using an MMFF94s force field and MMFF94 charge until the rms of the Powell gradient was 0.05 kcal/mol·Å in SYBYL 8.1.1 (Tripos International, St. Louis, MO, USA). The docking study on the homotetramer model of rTRPV1 was performed using GOLD v.4.1.2 (Cambridge Crystallographic Data Centre, Cambridge, UK), which employs a genetic algorithm (GA) and allows for full ligand flexibility and partial protein flexibility. The binding site was defined as the 10 Å around the center of Leu515 and Thr550. The side chains of the six residues (i.e. Tyr511, Ser512, Leu515, Met547, Thr550, and Asn551) in the binding site were set to be flexible with ‘crystal mode’. The GoldScore scoring function was used and other parameters were set as suggested by the GOLD authors except that the number of GA runs was 30. The resulting docked complexes were energy minimized using the CHARMm force field until the rms of conjugate gradient was lower than 0.05 kcal/mol·Å with the fixed backbone atoms.
All computation calculations were undertaken on an Intel® Xeon™ Quad-core workstation with Linux Cent OS release 4.6. Sequence alignment, homology modeling, loop and side chain refinement and energy minimization were performed in Discovery Studio v2.5 (Accelrys Inc., San Diego, CA, USA).
Supplementary Material
Acknowledgments
This research was supported by Grants R01-2007-000-20052-0 from the Ministry of Education, Science and Technology (MEST) and National Research Foundation of Korea (NRF) (to J. Lee and S. Choi), the National Core Research Center (NCRC) program (R15-2006-020) of MEST and NRF through the Center for Cell Signaling & Drug Discovery Research at Ewha Womans University (to S. Choi), and by the Intramural Research Program of the National Institutes of Health, Center for Cancer Research, National Cancer Institute (to P. M. Blumberg).
References and notes
- Alawi K, Keeble J. Pharmacol Ther. 2010;125:181. doi: 10.1016/j.pharmthera.2009.10.005. [DOI] [PubMed] [Google Scholar]
- Szallasi A, Blumberg PM. Pharmacol Rev. 1999;51:159. [PubMed] [Google Scholar]
- Wong GY, Gavva NR. Brain Res Rev. 2009;60:267. doi: 10.1016/j.brainresrev.2008.12.006. [DOI] [PubMed] [Google Scholar]
- Szallasi A, Cortright DN, Blum CA, Eid SR. Nat Rev Drug Discov. 2007;6:357. doi: 10.1038/nrd2280. [DOI] [PubMed] [Google Scholar]
- Lazar J, Gharat L, Khairathkar-Joshi N, Blumberg PM, Szallasi A. Expert Opinion on Drug Discovery. 2009;4:159. doi: 10.1517/17460440802681300. [DOI] [PubMed] [Google Scholar]
- Gunthorpe MJ, Chizh BA. Drug Discov Today. 2009;14:56. doi: 10.1016/j.drudis.2008.11.005. [DOI] [PubMed] [Google Scholar]
- Appendino G, Szallasi A. Life Sci. 1997;60:681. doi: 10.1016/s0024-3205(96)00567-x. [DOI] [PubMed] [Google Scholar]
- Szallasi AB, PM Neuroscience. 1989;30:515. doi: 10.1016/0306-4522(89)90269-8. [DOI] [PubMed] [Google Scholar]
- Lee J, Kang M, Shin M, Kim JM, Kang SU, Lim JO, Choi HK, Suh YG, Park HG, Oh U, Kim HD, Park YH, Ha HJ, Kim YH, Toth A, Wang Y, Tran R, Pearce LV, Lundberg DJ, Blumberg PM. J Med Chem. 2003;46:3116. doi: 10.1021/jm030089u. [DOI] [PubMed] [Google Scholar]
- Lee J, Kim J, Kim SY, Chun MW, Cho H, Hwang SW, Oh U, Park YH, Marquez VE, Beheshti M, Szabo T, Blumberg PM. Bioorg Med Chem. 2001;9:19. doi: 10.1016/s0968-0896(00)00216-9. [DOI] [PubMed] [Google Scholar]
- Ryu H, Jin MK, Kim SY, Choi HK, Kang SU, Kang DW, Lee J, Pearce LV, Pavlyukovets VA, Morgan MA, Tran R, Toth A, Lundberg DJ, Blumberg PM. J Med Chem. 2008;51:57. doi: 10.1021/jm701049p. [DOI] [PubMed] [Google Scholar]
- Kedei N, Szabo T, Lile JD, Treanor JJ, Olah Z, Iadarola MJ, Blumberg PM. J Biol Chem. 2001;276:28613. doi: 10.1074/jbc.M103272200. [DOI] [PubMed] [Google Scholar]
- Harteneck C, Plant TD, Schultz G. Trends Neurosci. 2000;23:159. doi: 10.1016/s0166-2236(99)01532-5. [DOI] [PubMed] [Google Scholar]
- Moiseenkova-Bell VY, Stanciu LA, Serysheva II, Tobe BJ, Wensel TG. Proc Natl Acad Sci U S A. 2008;105:7451. doi: 10.1073/pnas.0711835105. [DOI] [PMC free article] [PubMed] [Google Scholar]
- Jordt SE, Julius D. Cell. 2002;108:421. doi: 10.1016/s0092-8674(02)00637-2. [DOI] [PubMed] [Google Scholar]
- Gavva NR, Klionsky L, Qu Y, Shi L, Tamir R, Edenson S, Zhang TJ, Viswanadhan VN, Toth A, Pearce LV, Vanderah TW, Porreca F, Blumberg PM, Lile J, Sun Y, Wild K, Louis JC, Treanor JJ. J Biol Chem. 2004;279:20283. doi: 10.1074/jbc.M312577200. [DOI] [PubMed] [Google Scholar]
- Chou MZ, Mtui T, Gao YD, Kohler M, Middleton RE. Biochemistry. 2004;43:2501. doi: 10.1021/bi035981h. [DOI] [PubMed] [Google Scholar]
- Long SB, Tao X, Campbell EB, MacKinnon R. Nature. 2007;450:376. doi: 10.1038/nature06265. {#10}. ; http://www.expasy.org/tools/ [DOI] [PubMed] [Google Scholar]
- Jiang Y, Lee A, Chen J, Ruta V, Cadene M, Chait BT, MacKinnon R. Nature. 2003;423:33. doi: 10.1038/nature01580. [DOI] [PubMed] [Google Scholar]
- Long SB, Campbell EB, Mackinnon R. Science. 2005;309:897. doi: 10.1126/science.1116269. {#9}. ; http://nihserver.mbi.ucla.edu/SAVS/ [DOI] [PubMed] [Google Scholar]
- Laskowski RA, Rullmannn JA, MacArthur MW, Kaptein R, Thornton JM. J Biomol NMR. 1996;8:477. doi: 10.1007/BF00228148. [DOI] [PubMed] [Google Scholar]
- Colovos C, Yeates TO. Protein Sci. 1993;2:1511. doi: 10.1002/pro.5560020916. [DOI] [PMC free article] [PubMed] [Google Scholar]
- Brauchi S, Orta G, Mascayano C, Salazar M, Raddatz N, Urbina H, Rosenmann E, Gonzalez-Nilo F, Latorre R. Proc Natl Acad Sci USA. 2007;104:10246. doi: 10.1073/pnas.0703420104. [DOI] [PMC free article] [PubMed] [Google Scholar]
- Christopher SJ, Walpole RW, Bevan Stuart, Campbell Elizabeth A, Dray Andy, James Iain F, Masdin Kay J, Perkins Martin N, Winter Janet. J Med Chem. 1993;36:2381. doi: 10.1021/jm00068a016. [DOI] [PubMed] [Google Scholar]
- Conway SJ. Chem Soc Rev. 2008;37:1530. doi: 10.1039/b610226n. [DOI] [PubMed] [Google Scholar]
- Thompson JD, Higgins DG, Gibson TJ. Nucleic Acids Res. 1994;22:4673. doi: 10.1093/nar/22.22.4673. [DOI] [PMC free article] [PubMed] [Google Scholar]
- Feig M, Brooks CL., 3rd Curr Opin Struct Biol. 2004;14:217. doi: 10.1016/j.sbi.2004.03.009. [DOI] [PubMed] [Google Scholar]
- Inc., A. S. Discovery Studio Modeling Enviroment, Release 2.5. San Diego: Accelrys Software Inc; 2009. [Google Scholar]
Associated Data
This section collects any data citations, data availability statements, or supplementary materials included in this article.
