Dynamic hydroxymethylation of deoxyribonucleic acid marks differentiation-associated enhancers (original) (raw)
Abstract
Enhancers are developmentally controlled transcriptional regulatory regions whose activities are modulated through histone modifications or histone variant deposition. In this study, we show by genome-wide mapping that the newly discovered deoxyribonucleic acid (DNA) modification 5-hydroxymethylcytosine (5hmC) is dynamically associated with transcription factor binding to distal regulatory sites during neural differentiation of mouse P19 cells and during adipocyte differentiation of mouse 3T3-L1 cells. Functional annotation reveals that regions gaining 5hmC are associated with genes expressed either in neural tissues when P19 cells undergo neural differentiation or in adipose tissue when 3T3-L1 cells undergo adipocyte differentiation. Furthermore, distal regions gaining 5hmC together with H3K4me2 and H3K27ac in P19 cells behave as differentiation-dependent transcriptional enhancers. Identified regions are enriched in motifs for transcription factors regulating specific cell fates such as Meis1 in P19 cells and PPARγ in 3T3-L1 cells. Accordingly, a fraction of hydroxymethylated Meis1 sites were associated with a dynamic engagement of the 5-methylcytosine hydroxylase Tet1. In addition, kinetic studies of cytosine hydroxymethylation of selected enhancers indicated that DNA hydroxymethylation is an early event of enhancer activation. Hence, acquisition of 5hmC in cell-specific distal regulatory regions may represent a major event of enhancer progression toward an active state and participate in selective activation of tissue-specific genes.
INTRODUCTION
Enhancers are essential non-coding elements of the genome involved in long-distance cell-specific regulation of gene expression and whose mutation can impact on disease development (1). Although high sequence conservation across species is a hallmark of enhancers regulating neural gene expression during development (2), other regulatory regions involved in pluripotency or heart formation are weakly conserved (3,4). Hence, identification of enhancers cannot rely solely on their sequence conservation but requires the analysis of specific chromatin features such as histone post-translational modifications (5–7), histone variant deposition (8,9) and nucleosome stability (10).
Putative regulatory regions defined by their DNAse I hypersensitivity contain H2A.Z and H3.3 variants in unstable nucleosomes, which are thought to facilitate transcription factor engagement and enhancer activation (8,11). In many instances, H2A.Z is associated with regions of low 5-methylcytosine (5mC) content (12,13), a characteristic shared with the active chromatin mark H3K4me2 (14). Despite the low-C.G dinucleotide (CpG) content of cell-specific enhancers (14), an implication of deoxyribonucleic acid (DNA) methylation in the regulation of their activity has been suggested (15–17). The discovery that Tet dioxygenases can generate 5-hydroxymethylcytosine (5hmC) from 5mC (18,19) led to the hypothesis that Tet could initiate active DNA demethylation. The demonstration that Tet enzymes can further process 5hmC in 5-formylcytosine (5fC) and 5-carboxylcytosine (5caC) and that the DNA glycosylase TDG specifically cleaves 5fC and 5caC further supports this hypothesis (20–22). Recent genome-wide mapping studies in embryonic stem (ES) cells have revealed that (i) 5hmC is enriched in gene bodies where it correlates with gene expression levels, (ii) 5hmC is associated with low gene expression when present at transcription start sites [TSSs (23–28)] and (iii) 5hmC is found at binding sites for pluripotency transcription factors in undifferentiated ES cells (26,29–31). Nonetheless, information pertaining to the dynamics of 5hmC in regulatory regions and its relationship with enhancer activity during cell differentiation is still missing. Interestingly, 5hmC tissue levels are higher in differentiated cells than in stem cells (32) and increase with age in neural cells (33), suggesting that a dynamic modulation of cytosine hydroxymethylation could occur at cell-specific transcription regulatory regions during differentiation and aging. In this study, we used a paralleled thorough analysis of 5hmC dynamics during adipocyte and neural differentiation to describe the relationship between DNA hydroxymethylation, transcription factor binding and enhancer activation. Our data indicate that hydroxymethylation of cytosine at occupied transcription factor-binding sites dynamically correlates with cell-specific enhancer activity.
MATERIALS AND METHODS
Cell culture and transfections
P19.6 mouse embryonal carcinoma cells were grown in high-glucose Dulbecco’s Modified Eagle’s Medium (DMEM) containing 10% fetal calf serum (GIBCO) and differentiated with 1 µM all-trans retinoic acid (RA) for 48 h. Enhancer assays of selected regulatory regions cloned into the CpG-free luciferase expression vector pCpGLCMV/EF1 (34) were run as described (17) on P19 cells treated or not with 1 µM RA for 48 h. Mouse 3T3-L1 preadipocytes were obtained from American Type Culture Collection and cultured in high-glucose DMEM supplemented with 10% bovine calf serum (Hyclone-ThermoScientific). Mature adipocytes were harvested after 8 days of differentiation as described (35).
Hydroxymethylated DNA and chromatin immunoprecipitation
Genomic DNA obtained from cultured cells (DNeasy Blood and Tissue kit, Qiagen) was sonicated to produce fragments ranging from 200 to 500 bp. Hydroxymethylated DNA immunoprecipitation (hMeDIP) used 20 µg of fragmented DNA, 2 µg of rabbit polyclonal antibody against 5hmC (Diagenode, CS-HMC-020) and followed the same procedure as described for methylated DNA immunoprecipitation (17). hMeDIP samples recovered from independent experiments in P19 and 3T3-L1 cells were pooled and sequenced using Illumina Genome Analyzer IIx (Institut de Biologie, IBL, Lille, France). H3K4me2, H3K27ac, Tet1 and Meis1 ChIPed DNA recovered from 10 to 12 independent ChIP experiments were pooled for library preparation and sequencing using Illumina Genome Analyzer II at IGBMC sequencing facility (Strasbourg, France) or at IBL. A complete list of antibodies used in this study is provided in Supplementary Table S1.
Selective chemical labeling assay
Selective chemical labeling (SCL) was performed in triplicates with 500 ng of sonicated genomic DNA from P19 cells ± RA according to recommendations from the Hydroxymethyl Collector kit (Active Motif).
FAIRE assay
Formaldehyde assisted isolation of regulatory elements (FAIRE) was performed as described (36). Recovered DNA was analyzed by real-time polymerase chain reaction (PCR) on a CFX96 real-time system (Biorad, France). All primer sequences are indicated in Supplementary Table S1. Primers were synthesized by Sigma-Aldrich.
Transcriptomic analysis
Ten micrograms of P19 RNA was used as template for complementary DNA (cDNA) synthesis using the Superscript Double-Stranded cDNA Synthesis Kit (Invitrogen). Hybridization of the cDNAs and scanning of the arrays (2006-08-03_MM8_60mer_expr) were performed in triplicates at the NimbleGen service facilities (Reykjavic, Iceland). Quantile normalization of the data through the robust multi-array average algorithm and all primary analyses were performed using the ArraySTar software suite (DNAstar, Inc.). Regulated genes were identified through calculations of fold-changes (FC) in gene expression and were considered significant for FC greater than 2, with P < 0.02 as determined by a Benjamini–Hochberg-corrected Student _t_-test. A similar procedure was used to process 3T3-L1 transcriptomic data from Mikkelsen et al . (6). Transcriptomic and sequencing data have been deposited in the Gene Expression Omnibus database under accession number GSE27436.
Bioinformatics
hMeDIP-seq data and ChIP-seq data for Tet1, Meis1, H3K4me2 and H3K27ac in fastq format were mapped onto chromosomes of the mus musculus genome (mm8 version) using bowtie (37). The .sam files were converted to .bam files using SAMtools (38). The .bam files were then processed to yield .wig files using MACS (39).
We developed our own peak-calling algorithm, which considers each position of the signal in turn, looking for genomic regions of length L bp within which at least n genomic positions had signal values lying above a given threshold t. Overlapping regions satisfying these constraints were then merged and considered as one single peak. Assuming the data follow a Poisson distribution, an approximate _p_-value P is associated to the value chosen for threshold t according to:
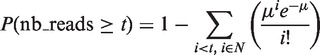
where µ is the expected number of reads.
Looking for genomic regions where 5hmC varied dynamically on differentiation, we first constructed the un-normalized signed raw differential signal for P19 and 3T3 cells, as:  , a positive value for genomic position p meaning an increase in signal for that position during differentiation. The peak-calling algorithm was then applied to 5hmC differential signals with parameters (n = 4; L = 65; P < 1e−16) yielding 5hmC up-regulated and down-regulated genomic regions. The algorithm was also used to treat P19 Tet1 and Meis1 ChIP-seq signals with parameters (n = 4; L = 65; P < 1e−11 for Meis1 and 4e−7 for Tet1).
Sequence conservation was analyzed by creating a wiggle file from the ‘PhastCons17way’ file from University of California, Santa Cruz (http://genome.ucsc.edu, 10 April 2012, date last accessed), which describes conservation of DNA sequences between 17 vertebrates. This wiggle file was used to plot the average conservation scores of identified regions.
RESULTS
Mapping of chromatin mark dynamics during cell differentiation defines distinct classes of 5hmC-associated putative regulatory regions
To characterize the dynamics of 5hmC and its correlation with those of active chromatin marks H3K4me2 and H3K27ac [a hallmark of enhancer activation (7,40)] during cellular differentiation, we used two distinct mouse cell lines that undergo either neural differentiation on RA addition [P19 embryonal carcinoma cells (41)] or adipocyte differentiation on treatment with a differentiation cocktail (DC) containing insulin, dexamethasone and IBMX [3T3-L1 cells (6)]. Hydroxymethylated DNA was recovered from both cells lines by immunoprecipitation (hMeDIP) with a specific polyclonal antibody (Supplementary Figure S1a) and processed for deep sequencing. As the use of 5hmC antibodies has been suggested to introduce a bias toward genomic regions with high CpG numbers compared with the SCL and GLIB methods (23,24), average profiles of CpG density in hMeDIP- (P19 cells) and SCL [cerebellum (24)] -enriched regions were plotted (Supplementary Figure S1b). Data showed that SCL-enriched regions were not characterized by a lower CpG density compared with hMeDIP-enriched regions (Supplementary Figure S1c). Hence, CpG density is unlikely to impose a strong bias on our analysis. However, it cannot be excluded that certain 5hmC-containing regions with low CpG number are not efficiently pulled down by our procedure.
As described for ES cells (25,28), 5hmC was found to be particularly abundant in gene-rich regions of both P19 and 3T3-L1 cells (data not shown). When comparing 5hmC levels in undifferentiated versus RA-treated P19 cells, specific regions showed a remarkable increase in 5hmC levels as exemplified with the meis1 locus, a RA-activated gene (Figure 1a, Supplementary Table S2) coding for a Hox cofactor (42). To determine whether these variations in 5hmC levels were associated with changes in levels of other active chromatin marks, we ran H3K4me2 and H3K27ac ChIP-seq assays in P19 cells. Interestingly, H3K4me2 and H3K27ac also increased in these regions on RA addition. Hydroxymethylation of the meis1 promoter region was not affected although H3K4me2 and H3K27ac raised (Figure 1a). Finally, consistent with previous observations (43), intragenic levels of 5hmC increased significantly at specific positions when meis1 was expressed in response to RA. Similar dynamics were observed at the fatty acid-binding protein 4 (fabp4) locus in 3T3-L1 cells. Indeed, this activated gene (Supplementary Table S3) showed correlated elevation of 5hmC, H3K4me2 and H3K27ac levels in intragenic and distal putative regulatory regions but not immediately upstream of the TSS (Figure 1b). Hence, differentiation-associated chromatin remodeling in intragenic regions and putative distal regulatory regions involves hydroxymethylation of DNA. This provided a rationale for the further characterization of regions that gain hmC (‘5hmC-up’ regions) during cell differentiation.
Figure 1.

Coordinated variations of chromatin marks define putative regulatory regions. (a) Integrated genome browser representation of ChIP/hMeDIP-seq signals at the meis1 locus on mouse chromosome 11 in P19 cells. Putative regulatory regions (highlighted in gray upstream and downstream of meis1) were characterized by an elevation in 5hmC, H3K4me2 and H3K27ac levels, whereas 5hmC levels at promoter region (highlighted in brown) were not affected. (b) Integrated genome browser representation of ChIP/hMeDIP-seq signals at the fabp4 locus on mouse chromosome 11 in 3T3-L1 cells. ChIP-seq data were from Mikkelsen et al. (6) and were recovered from Gene Expression Omnibus (GEO) database (GSE20752). Highlighted regions are as in (a).
To allow genomic annotation, 5hmC-up regions were identified genome wide through direct comparison of our hMeDIP-seq data from undifferentiated and differentiated P19 and 3T3-L1 cells, as described in ‘Materials and Methods’ section (Supplementary Tables S4 and S5). We then generated heatmaps of 5hmC signals on 5hmC-up regions rank ordered according to their 5hmC content in the presence of RA (Figure 2a) or DC (Figure 2b), using Cistrome (44). As shown in these heatmaps, peak calling efficiently identified 5hmC-up regions in both cell lines. _Cis_-regulatory Element Annotation System (45) indicated that genomic distribution of 5hmC-up regions differed between the two cell lines as intergenic regions were highly represented in P19 compared with 3T3-L1 (Figure 2c and d), indicating that the DNA hydroxymethylation machinery was mobilized to different genomic locations during adipocyte and neural differentiation. We next questioned to what extent differentiation-regulated genes were associated with 5hmC-up regions in P19 and 3T3-L1 cells by analyzing the percentage of activated and repressed gene regions (±20 kb of TSS), which contained 5hmC-up peaks (Figure 2e and f). Overall, the localization of 5hmC-up regions was biased toward activated genes in both cell lines. Consistent with the respective differentiation potential of P19 and 3T3-L1 cells, functional annotation of 5hmC-up regions using genomic regions enrichment of annotations tool (GREAT) (46) revealed that regions identified in P19 cells were associated with stem cell differentiation process and genes expressed in neural tissues, whereas regions identified in 3T3-L1 cells were associated with fat cell differentiation process and genes expressed in adipose tissue (Figure 2g and h). Interestingly, a highly significant association with peroxisome proliferator activated receptor (PPAR) signaling was observed for 3T3-L1 cells (Figure 2h).
Figure 2.

Functional annotation of 5hmC-up regions in P19 (left) and 3T3-L1 (right) cells. (a and b) Heatmap representations of 5hmC enrichment in identified 5hmC-up regions (5 kb flanking the center of 5hmC-up called regions). (c and d) Gene-centered annotation of 5hmC-up regions. Annotation was run with Cistrome and is depicted as pie charts. Promoters are defined as regions extending to 3 kb upstream of TSSs. Downstream regions extend to 3 kb from transcription termination sites (TTSs). (e and f) Association of 5hmC-up regions with regulated genes. Bars indicate the percentage of activated or repressed gene regions (±20 kb around TSS), which overlap with 5hmC-up regions (5hmC) or random regions (random). (g and h) P19 (g) and 3T3-L1 (h) 5hmC-up regions were analyzed with GREAT, and results concerning biological processes (GO biological process), signaling pathways (MsigDB pathway) and tissue-specific expression (MGI expression detected) of the genes associated with 5hmC-up regions are shown.
We next used clustering to group 5hmC-up regions according to both their 5hmC and H3K4me2 signals (Figure 3). Clusters were analyzed for CpG density, conservation among vertebrates, H3K27ac signal and annotated according to their genomic location (Figure 3a and b and Supplementary Figure S2a and b). Remarkable general features were recovered from this analysis: (i) the center of 5hmC-up regions showed peaks of CpG density and peaks of sequence conservation in both P19 and 3T3-L1 cells; (ii) 5hmC-up regions with less than 5% of promoters (i.e. clusters C3, C4 and C5 in P19 cells and C6 and C7 in 3T3-L1 cells) showed a centered gain of H3K4me2 and H3K27ac. Collectively, these data suggest that 5hmC-up regions harboring centered and differentiation-induced peaks of H3K4me2 and H3K27ac signals represent conserved regulatory regions bearing characteristics of cell-type-specific enhancers.
Figure 3.

Characterization of differentiation-dependent hydroxymethylated genomic regions in P19 (a) and 3T3-L1 cells (b). Heatmaps represent 5hmC and H3K4me2 profiles in clusterized 5hmC-up regions. Clustering was run with Cistrome taking into account all signals. Clustering parameters were adjusted for each cell line to obtain a minimal number of clusters with homogeneous distribution of signals. Horizontal lines demarcate the different clusters and the number of regions lying within each cluster is given in brackets. Average profiles of CpG density, conservation among vertebrates and H3K27ac were generated for each cluster of 5hmC-up regions and are shown for P19 cluster C4 and 3T3-L1 cluster C6. Gene-centered annotation of clusters is depicted as rings.
Dynamic regulation of 5hmC-associated enhancers during neural differentiation
To investigate whether the identified dynamic chromatin signatures could mark enhancers dynamically regulated by RA in P19 cells, we selected five regions lying in the vicinity of RA-regulated genes and gaining 5hmC, H3K4me2 and H3K27ac (Figure 4a). Fluctuations in 5hmC levels during differentiation were first validated through hMeDIP-qPCR (Figure 4b). RA-dependent hydroxymethylation of these five regions was confirmed through SCL-qPCR (Supplementary Figure S3a). Furthermore, bisulfite sequencing of genomic DNA indicated that CpGs from regions 1 to 5 were heavily methylated in undifferentiated P19 cells (Supplementary Figure S3b), providing substrates for hydroxylation (18,19). To further investigate the relationship between 5hmC and enhancer activation, we measured H3K27me3 and H3K27ac [two marks of poised and active enhancers, respectively (7,40)] enrichment by chromatin immunoprecipitation-quantitative polymerase chain reaction (ChIP-qPCR). Variations in H3K27ac enrichment mirrored those in 5hmC levels (Figure 4c), whereas H3K27me3 was not detected in these regions (Figure 4d). To verify that these enhancers indeed had temporally controlled activities during P19 cell neural differentiation, we monitored the relative nucleosomal depletion/stability of these chromatin regions using FAIRE-qPCR [formaldehyde-assisted isolation of regulatory elements (47)]. Consistent with the requirement for an open chromatin structure at active enhancers, nucleosome density/stability decreased in these regions during differentiation (Figure 4e). DNA from the selected regions was next cloned in a luciferase reporter vector bearing a minimal promoter and transfected in P19 cells. Among the five cloned sequences, four showed moderate to high RA-activated enhancer activities (Figure 4f). Thus, integrating DNA hydroxymethylation and histone mark dynamics efficiently identified enhancers which were activated during RA-driven P19 cell differentiation.
Figure 4.

Regions defined by coordinated variations in 5hmC, H3K4me2 and H3K27ac in P19 cells are RA-dependent enhancers. (a) Table indicating the genomic coordinates of selected 5hmC-up regions cloned in a luciferase reporter vector and their position relative to RA-regulated genes. (b) Validation of 5hmC variations in selected regions by hMeDIP-qPCR shown as relative enrichment (percentage of input). (c) ChIP-qPCR analysis of H3K27ac enrichment of selected regions. The open chromatin of the Hus1 promoter served as a positive control, whereas amplification of a region within Nf1a on chromosome 4 provided a negative control. Results are shown as mean ± SEM of biological duplicates. (d) ChIP-qPCR analysis of H3K27me3 enrichment of selected regions. Negative and positive controls are as in (c). Results are shown as mean ± SEM of biological duplicates. (e) FAIRE assay of nucleosome depletion/stability in selected regions. Results are shown as mean ± SEM of biological triplicates. (f) Luciferase reporter assay of the cloned regions −/+ RA. Negative control indicates relative luciferase activities obtained after transfection of the empty control vector.
5hmC-based chromatin signatures identify a subset of transcription factor-targeted enhancers
As enhancer activity is regulated through transcription factor binding to DNA (48), we interrogated 5hmC-up clusters for the presence of known transcription factor-binding motifs with the Seq-Pos motif tool from Cistrome. Among the retrieved motifs, PBX1 and its three amino-acid loop extension (TALE)-homeodomain (HD) partner PKNOX2 motifs were enriched in P19 cluster C4 (Figure 5a). CEBP and PPAR motifs were particularly enriched in 3T3-L1 clusters, especially in C7 (Figure 5c). The enriched motifs were confirmed through the CENTDIST algorithm (53), which uses position to center of sample peaks to rank the identified motifs and were identified both in intergenic and intronic 5hmC-up regions (Supplementary Figure S4). Identification of these motifs was relevant to our differentiation models as Pre-B cell leukemia homeobox (PBX) and their TALE-HD protein partners Meis, TG-interacting factor and peroxisome proliferator activated receptor (PKNOX) play crucial role in development (42) and are required for P19 cell differentiation (54), whereas CCAAT enhancer binding protein beta and PPARγ are required for adipogenesis (55).
Figure 5.

5hmC-up regions are enriched in cell-specific transcription factor binding motifs. (a) Logos of transcription factor-binding motifs enriched in cluster C4 of 5hmC-up regions from P19 cells. Clusters were scanned (500 bp around peak center) for transcription factor motifs with the SeqPos motif tool from Cistrome, using Transfac matrices. (b) Average profile of Meis1 binding to regions from clusters C4 and C5 in P19 cells treated with RA for 48 h. (c) Examples of transcription factor-binding motifs enriched in 5hmC-up regions from 3T3-L1 cluster C7. (d) Average profile of PPARγ binding to clusters C6 and C7 regions in differentiated 3T3-L1 cells. Profiles were generated with GSM340799 from Nielsen et al. (49). (e and f) Heatmap representations of hMeDIP-seq signal at Meis1 (e), PPARγ- and CEBPα-(f) -binding sites rank ordered according to signal in the presence of differentiation inducer and classified into non-CGI and CGI sites. PPARγ sites represent pooled sites from GSM535769 and GSM535770 (6), GSM686980 (50) and GSM532740 (51) after removal of redundant binding events. CEBPα sites are from GSM678392 (52).
As Meis1 binds as a complex with PBX1 to a brain-specific enhancer (56), we next decided to identify Meis1 genome-wide binding sites in RA-treated P19 cells through ChIP-seq (Supplementary Figure S5). Although Meis1 sites were particularly enriched in introns and intergenic sequences (Supplementary Figure S5), 14% of Meis1 peaks were located in CpG islands (CGIs). Of note, de novo motif prediction on Meis1 high-confidence peaks identified not only Meis1- and PBX-binding sequences but also CA repeats in a large fraction of Meis1-binding regions (11 207 of 36 044 regions—Supplementary Figure S5). As CA repeats have been shown to be enriched by hMeDIP but not by GLIB or SCL procedures (57), and regardless of the potential relevance of these CA repeat-containing regions in Meis1 binding and function, these regions were excluded from the analysis of Meis1-binding sites throughout this study. Consistent with the retrieved motifs, average profiles of Meis1 ChIP-seq signal indicated that Meis1 binds and peaks at the center of P19 5hmC-up regions (Figure 5b). Similarly, using PPARγ ChIP-seq data from Nielsen et al. (49), we found PPARγ binding to 3T3-L1 5hmC-up regions (Figure 5d). The variations in 5hmC levels were validated by hMeDIP-qPCR for selected PPARγ-bound enhancers (Supplementary Figure S6). Hence, cell-specific hydroxymethylated enhancers are bound by transcription factors regulating cell differentiation. To get further insight into the distribution of 5hmC at transcription factor-binding sites and the proportion of sites that become hydroxymethylated on differentiation, we then generated heatmaps of Meis1 and PPARγ-binding sites according to their 5hmC signal (Figure 5e and f) with binding regions divided into CGIs and non-CGIs. As already described by others (26,57), 5hmC signal in CGIs was low and did not increase with differentiation (Figure 5e and f). Conversely, almost all non-CGI Meis1 sites gained 5hmC in RA-treated cells regardless of Meis1 signal. A differentiation-dependent hydroxymethylation of cytosines was also observed for PPARγ- and CEBPα-binding regions in 3T3-L1 cells (Figure 5f).
To determine the sequence of events occurring at enhancers during differentiation, we then analyzed the kinetics of DNA hydroxymethylation, H3K27 acetylation and Meis1 recruitment at enhancers R1 to R5 during the first 48 h of RA-induced P19 cell differentiation. DNA hydroxymethylation was either concomitant (R1, R2 and R5) with activation of enhancers or occurred before (R3 and R4) activation (Supplementary Figure S7). Hence, DNA hydroxymethylation might be an early event of enhancer activation.
A fraction of hydroxymethylated Meis1-bound enhancers recruits Tet1 during differentiation
Increased 5hmC levels at enhancers activated during differentiation suggested that Tet enzymes could be recruited to these regions. Hence, we mapped Tet1-binding sites in P19 cells -/+ RA through ChIP-seq assays. As described in RA-treated ES cells, Tet1 expression decreased on P19 cell differentiation to reach levels comparable with those of Tet2 and Tet3 (Supplementary Figure S8). Consistent with decreased expression, high-confidence (P ≤ 3.e−7) Tet1-binding regions dropped from 15 039 in undifferentiated cells to 12 236 in RA-treated P19 cells. Similar to its distribution in ES cells, Tet1 was enriched in promoters (Supplementary Figure S9a) and in CGIs (Supplementary Figure S9b). Despite its lower expression in RA-treated cells, we identified 6096 high-confidence Tet1-up sites (P ≤ 2.4e−9) among which 824 were located in CGIs (Supplementary Figure S9c). Interestingly, as evidenced by heatmaps, most of these Tet1-up regions were not associated with a gain in 5hmC (Supplementary Figure S9d), indicating that Tet1 enzymatic activity might be regulated at its binding sites and/or that Tet1 can serve additional functions as already suggested (25). Further analysis evidenced that H3K27ac levels raised in Tet1-up regions which became hydroxymethylated but not in others (Supplementary Figure S9d).
We then examined the engagement of Tet1 at non-CGI Meis1-binding sites and found that Tet1 associates with a fraction of Meis1 sites, which shows an enrichment in CpGs (Figure 6a and Supplementary Figure S10). Through a second round of clustering, we identified 1306 regions (Figure 6a) that show, as exemplified for an intronic region of the bcas3 gene (Figure 6c), a simultaneous increase in Tet1 and DNA hydroxymethylation levels during RA-induced differentiation. Interestingly, a large fraction of these regions was already associated with low levels of Tet1 in undifferentiated cells (Figure 6a) in line with premarking of Meis1-binding sites by low levels of 5hmC (Figure 5e). Although Tet1 loading decreased on RA treatment at 613 specific Meis1-binding sites, average 5hmC levels increased by 40% (Figure 6b). These data indicate a complex relationship between Meis1 and Tet1 and suggest that Meis1 engagement at Tet1-binding sites could stimulate its recruitment and/or its activity.
Figure 6.

A fraction of Meis1-binding sites interacts with Tet1. (a) Heatmaps of Tet1 signal in clusters of non-CGI regions binding Meis1. The 2391 Tet1 positive regions from cluster C3 were submitted to a second round of clustering to generate clusters C′1 to C′5. (b) Average profiles of Tet1 and 5hmC in regions from clusters C′3, C′4 and C′5. (c) Integrated genome browser representation of 5hmC, Tet1, Meis1 and H3K27ac signals in bcas3 24th intron (chr11).
DISCUSSION
Taken together, our data indicate a relationship between DNA hydroxymethylation and enhancer activation during mouse cell differentiation. Our observations are in line with previous studies reporting an enrichment in 5hmC at enhancers in correlation with H3K4me1, H3K4me2 and H3K27ac levels in undifferentiated human stem cells (30,31) and that binding sites engaged with the pluripotency transcription factor NANOG bear 5hmC. On differentiation, ES cells tend to lose 5hmC, and it remains unknown whether the mark is lost in a general way or if specific genomic regions can become hydroxymethylated during programming of alternative cell states. In this study, we provide evidence that differentiation is associated with dynamic DNA hydroxymethylation of a subset of cell-type-specific enhancers.
Pioneer studies focusing on the genome-wide distribution of 5hmC showed that intragenic 5hmC is positively associated with gene activity (26,29,58). Consistent with this observation, 5hmC inhibits binding of several Methyl CpG binding protein (MBD) including MeCP2 (59, 60) and could reduce maintenance methylation by DNMT1 (61). As MeCP2 recruits enzymatic systems that drive chromatin condensation (62–64), oxidation of 5mC could help chromatin opening and thereby facilitate gene expression. As demonstrated for FOXA1-dependent enhancers, chromatin opening at enhancers is associated with their cell-specific activity (36). In this study, we establish that chromatin opening, as assessed by FAIRE, is associated with acquisition of 5hmC at selected enhancers. In parallel to the gain in 5hmC, H3K27 acetylation levels raised, suggesting a model of enhancer activation that involves the conversion of 5mC to 5hmC. In line with this hypothesis, a recent study of glucocorticoid receptor (GR)-bound enhancers suggested that a fraction of GR sites distal to TSS and outside of CGIs are demethylated on GR binding (65). Similar to what is observed for 5hmC-up regions defined in this study, these enhancers are characterized by a peak of CpG density that is also observed for DNAse I hypersensitive sites not overlapping with CGIs (65), hence defining a category of enhancers that show intermediate CpG density (compared with CGIs and the rest of the genome) and whose activity is controlled by methylation. Recently, Schübeler and coworkers (66) described methylome remodeling through transcription factor binding at enhancers with low to intermediate levels of CpGs and associated with Tet1. It is most likely that 5hmC-up regions identified in P19 and 3T3-L1 cells belong to this particular category of enhancers implying that loss of methylation at these sites actually results from hydroxylation by Tet enzymes, then leading to chromatin activation. Although we cannot exclude that the observed CpG density of these 5hmC-up regions reflects a bias due to the antibody-based 5hmC capture, they show striking similarities with the aforementioned GR-bound enhancers. Indeed, these regions have intermediate CpG density levels, bind transcription factors and harbor active chromatin marks when hydroxymethylated. We propose that Meis1 activation of enhancers enriched in CpGs involves engagement of Tet enzymes (Supplementary Figure S11). Indeed, we have shown in this study that Tet1 was recruited to a subset of Meis1-bound enhancers.
The data presented herein argue for a positive role of active DNA demethylation through conversion of 5mC to 5hmC in the regulation of enhancer activity. This could be a transitory state toward replacement of modified cytosines by cytosines through base excision repair (20), but 5hmC levels seem to be quite stable over time both in P19 and 3T3-L1 cells. Indeed, we observed that enhancers that gain 5hmC at 48 h post RA or DC addition are still hydroxymethylated 7 days after beginning of the treatment (data not shown). This relative stability of 5hmC levels at enhancers suggests that 5hmC could be a signaling mark rather than a short-lived intermediate of active DNA demethylation. Such signaling would involve putative hydroxymethyl-DNA-binding proteins regulating chromatin activity. Alternatively, 5hmC stability could merely protect active enhancer DNA from remethylation and recognition by MBDs. Consistent with the hypothesis that 5hmC is a mark of active enhancer rather than an intermediate in DNA demethylation, we noticed that loss of 5hmC in 5hmC-down regions from P19 cells was correlated with a decrease in active chromatin marks (Supplementary Figure S12 and Supplementary Table S6). In accordance with chromatin inactivation, motif search in 5hmC-down regions revealed a highly significant enrichment in putative binding sites for pluripotency transcription factors SF1, ESRRB and LRH1 [Supplementary Figure S12d (67–69)]. Importantly, SF1 is known to activate the Oct3/4 promoter in P19 cells, and its expression is dramatically reduced on RA addition (67). Hence, loss of transcription factor binding during differentiation is likely to promote chromatin inactivation and 5hmC erasure at target enhancers.
Collectively, our data support and extend the concept of transcription factor shaping the methylome at distal regulatory regions by indicating that stable hydroxymethylation of DNA associates with transcription factor binding and activation of enhancers.
SUPPLEMENTARY DATA
Supplementary Data are available at NAR Online: Supplementary Tables 1–6 and Supplementary Figures 1–12.
FUNDING
The Ligue National Contre le Cancer [Equipe Labellisée Ligue 2009 to G.S.]; the Agence Nationale pour la Recherche [ANR-09-BLAN-0268-01 to G.S.]; the Région Bretagne [CREATE-DYNAMED-4793 to R.M. and SAD 08HC-315-02 to J.E.]; F.O. and C.G. were supported by OSEO-ANVAR [IT-DIAB]; A.A.S. was a recipient of a PhD fellowship from the Ministère de la Recherche. Funding for open access charge: CNRS.
Conflict of interest statement. None declared.
Supplementary Material
Supplementary Data
AKNOWLEDGEMENTS
The authors thank I. Davidson, B. Jost, S. Le Gras (IGBMC sequencing facility), O. Sand and F. Degraeve (Institut de Biologie de Lille) for sample processing.
REFERENCES
- 1.Visel A, Rubin EM, Pennacchio LA. Genomic views of distant-acting enhancers. Nature. 2009;461:199–205. doi: 10.1038/nature08451. [DOI] [PMC free article] [PubMed] [Google Scholar]
- 2.Pennacchio LA, Ahituv N, Moses AM, Prabhakar S, Nobrega MA, Shoukry M, Minovitsky S, Dubchak I, Holt A, Lewis KD, et al. In vivo enhancer analysis of human conserved non-coding sequences. Nature. 2006;444:499–502. doi: 10.1038/nature05295. [DOI] [PubMed] [Google Scholar]
- 3.Blow MJ, McCulley DJ, Li Z, Zhang T, Akiyama JA, Holt A, Plajzer-Frick I, Shoukry M, Wright C, Chen F, et al. ChIP-seq identification of weakly conserved heart enhancers. Nat. Genet. 2010;42:806–810. doi: 10.1038/ng.650. [DOI] [PMC free article] [PubMed] [Google Scholar]
- 4.Fernandez-Tresguerres B, Canon S, Rayon T, Pernaute B, Crespo M, Torroja C, Manzanares M. Evolution of the mammalian embryonic pluripotency gene regulatory network. Proc. Natl Acad. Sci. USA. 2010;107:19955–19960. doi: 10.1073/pnas.1010708107. [DOI] [PMC free article] [PubMed] [Google Scholar]
- 5.Hawkins RD, Hon GC, Lee LK, Ngo Q, Lister R, Pelizzola M, Edsall LE, Kuan S, Luu Y, Klugman S, et al. Distinct epigenomic landscapes of pluripotent and lineage-committed human cells. Cell Stem Cell. 2010;6:479–491. doi: 10.1016/j.stem.2010.03.018. [DOI] [PMC free article] [PubMed] [Google Scholar]
- 6.Mikkelsen TS, Xu Z, Zhang X, Wang L, Gimble JM, Lander ES, Rosen ED. Comparative epigenomic analysis of murine and human adipogenesis. Cell. 2010;143:156–169. doi: 10.1016/j.cell.2010.09.006. [DOI] [PMC free article] [PubMed] [Google Scholar]
- 7.Rada-Iglesias A, Bajpai R, Swigut T, Brugmann SA, Flynn RA, Wysocka J. A unique chromatin signature uncovers early developmental enhancers in humans. Nature. 2011;470:279–283. doi: 10.1038/nature09692. [DOI] [PMC free article] [PubMed] [Google Scholar]
- 8.Jin C, Zang C, Wei G, Cui K, Peng W, Zhao K, Felsenfeld G. H3.3/H2A.Z double variant-containing nucleosomes mark ‘nucleosome-free regions’ of active promoters and other regulatory regions. Nat. Genet. 2009;41:941–945. doi: 10.1038/ng.409. [DOI] [PMC free article] [PubMed] [Google Scholar]
- 9.Goldberg A, Banaszynski LA, Noh KM, Lewis PW, Elsaesser SJ, Stadler S, Dewell S, Law M, Guo X, Li X, et al. Distinct factors control histone variant H3.3 localization at genomic regions. Cell. 2010;140:678–691. doi: 10.1016/j.cell.2010.01.003. [DOI] [PMC free article] [PubMed] [Google Scholar]
- 10.Gaulton KJ, Nammo T, Pasquali L, Simon JM, Giresi PG, Fogarty MP, Panhuis TM, Mieczkowski P, Secchi A, Bosco D, et al. A map of open chromatin in human pancreatic islets. Nat. Genet. 2010;42:255–259. doi: 10.1038/ng.530. [DOI] [PMC free article] [PubMed] [Google Scholar]
- 11.He HH, Meyer CA, Shin H, Bailey ST, Wei G, Wang Q, Zhang Y, Xu K, Ni M, Lupien M, et al. Nucleosome dynamics define transcriptional enhancers. Nat. Genet. 2010;42:343–347. doi: 10.1038/ng.545. [DOI] [PMC free article] [PubMed] [Google Scholar]
- 12.Conerly ML, Teves SS, Diolaiti D, Ulrich M, Eisenman RN, Henikoff S. Changes in H2A.Z occupancy and DNA methylation during B-cell lymphomagenesis. Genome Res. 2010;20:1383–1390. doi: 10.1101/gr.106542.110. [DOI] [PMC free article] [PubMed] [Google Scholar]
- 13.Zemach A, McDaniel IE, Siva P, Zilberman D. Genome-wide evolutionary analysis of eukaryotic DNA methylation. Science. 2010;328:916–919. doi: 10.1126/science.1186366. [DOI] [PubMed] [Google Scholar]
- 14.Edwards JR, O’Donnell AH, Rollins RA, Peckham HE, Lee C, Milekic MH, Chanrion B, Fu Y, Su T, Hibshoosh H, et al. Chromatin and sequence features that define the fine and gross structure of genomic methylation patterns. Genome Res. 2010;20:972–980. doi: 10.1101/gr.101535.109. [DOI] [PMC free article] [PubMed] [Google Scholar]
- 15.Lister R, Pelizzola M, Dowen RH, Hawkins D, Hon G, Tonti-Filippini J, Nery JR, Lee L, Ye Z, Ngo Q-M, et al. Human DNA methylomes at base resolution show widespread epigenomic differences. Nature. 2009;462:315–322. doi: 10.1038/nature08514. [DOI] [PMC free article] [PubMed] [Google Scholar]
- 16.Schmidl C, Klug M, Boeld TJ, Andreesen R, Hoffman P, Edinger M, Rehli M. Lineage-specific DNA methylation in T cells correlates with histone methylation and enhancer activity. Genome Res. 2009;19:1165–1174. doi: 10.1101/gr.091470.109. [DOI] [PMC free article] [PubMed] [Google Scholar]
- 17.Sérandour AA, Avner S, Percevault F, Demay F, Bizot M, Lucchetti-Miganeh C, Barloy-Hubler F, Brown M, Lupien M, Métivier R, et al. Epigenetic switch involved in activation of pioneer factor FOXA1-dependent enhancers. Genome Res. 2011;21:555–565. doi: 10.1101/gr.111534.110. [DOI] [PMC free article] [PubMed] [Google Scholar]
- 18.Tahiliani M, Koh KP, Shen Y, Pastor WA, Bandukwala H, Brudno Y, Agarwal S, Lyer LM, Liu DR, Aravind L, et al. Conversion of 5-methylcytosine to 5-hydroxymethylcytosine in mammalian DNA by MLL partner TET1. Science. 2009;324:930–935. doi: 10.1126/science.1170116. [DOI] [PMC free article] [PubMed] [Google Scholar]
- 19.Ito S, D’Alessio AC, Taranova OV, Hong K, Sowers LC, Zhang Y. Role of Tet proteins in 5mC to 5hmC conversion, ES cells self-renewal and inner cell mass specification. Nature. 2010;466:1129–1133. doi: 10.1038/nature09303. [DOI] [PMC free article] [PubMed] [Google Scholar]
- 20.He YF, Li BZ, Li Z, Liu P, Wang Y, Tang Q, Ding J, Jia Y, Chen Z, Li L, et al. Tet-mediated formation of 5-carboxylcytosine and its excision by TDG in mammalian cells. Science. 2011;333:1303–1307. doi: 10.1126/science.1210944. [DOI] [PMC free article] [PubMed] [Google Scholar]
- 21.Ito S, Shen L, Dai Q, Wu SC, Collins LB, Swenberg JA, He C, Zhang Y. Tet proteins can convert 5-methylcytosine to 5-formylcytosine and 5-carboxylcytosine. Science. 2011;333:1300–1303. doi: 10.1126/science.1210597. [DOI] [PMC free article] [PubMed] [Google Scholar]
- 22.Maiti A, Drohat AC. Thymine DNA glycosylase can rapidly excise 5-formylcytosine and 5-carboxylcytosine: potential implications for active demethylation of CpG sites. J. Biol. Chem. 2011;286:35334–35338. doi: 10.1074/jbc.C111.284620. [DOI] [PMC free article] [PubMed] [Google Scholar]
- 23.Pastor WA, Pape UJ, Huang Y, Henderson HR, Lister R, Ko M, McLoughlin EM, Brudno Y, Mahapatra S, Kapranov P, et al. Genome-wide mapping of 5-hydroxymethylcytosine in embryonic stem cells. Nature. 2011;473:394–397. doi: 10.1038/nature10102. [DOI] [PMC free article] [PubMed] [Google Scholar]
- 24.Song CX, Szulwach KE, Fu Y, Dai Q, Yi C, Li X, Li Y, Chen CH, Zhang W, Jian X, et al. Selective chemical labeling reveals the genome-wide distribution of 5-hydroxymethylcytosine. Nat Biotechnol. 2011;29:68–72. doi: 10.1038/nbt.1732. [DOI] [PMC free article] [PubMed] [Google Scholar]
- 25.Williams K, Christensen J, Pedersen MT, Johansen JV, Cloos PAC, Rappsilber J, Helin K. TET1 and hydroxymethylcytosine in transcription and DNA methylation fidelity. Nature. 2011;473:343–348. doi: 10.1038/nature10066. [DOI] [PMC free article] [PubMed] [Google Scholar]
- 26.Wu H, D’Alessio AC, Ito S, Wang Z, Cui K, Zhao K, Sun YE, Zhang Y. Genome-wide analysis of 5-hydroxymethylcytosine distribution reveals its dual function in transcriptional regulation in mouse embryonic stem cells. Genes Dev. 2011;25:679–684. doi: 10.1101/gad.2036011. [DOI] [PMC free article] [PubMed] [Google Scholar]
- 27.Xu Y, Wu F, Tan L, Kong L, Xiong L, Deng J, Barbera AJ, Zheng L, Zhang H, Huang S, et al. Genome-wide regulation of 5hmC, 5mC, and gene expression by Tet1 hydroxylase in mouse embryonic stem cells. Mol. Cell. 2011;42:451–464. doi: 10.1016/j.molcel.2011.04.005. [DOI] [PMC free article] [PubMed] [Google Scholar]
- 28.Yildirim O, Li R, Hung JH, Chen PB, Dong X, Ee LS, Weng Z, Rando OJ, Fazzio TG. Mbd3/NURD complex regulates expression of 5-hydroxymethylcytosine marked genes in embryonic stem cells. Cell. 2011;147:1498–1510. doi: 10.1016/j.cell.2011.11.054. [DOI] [PMC free article] [PubMed] [Google Scholar]
- 29.Ficz G, Branco MR, Seisenberger S, Santos F, Krueger F, Hore TA, Marques CJ, Andrews S, Reik W. Dynamic regulation of 5-hydroxymethylcytosine in mouse ES cells and during differentiation. Nature. 2011;473:398–402. doi: 10.1038/nature10008. [DOI] [PubMed] [Google Scholar]
- 30.Stroud H, Feng S, Morey Kinney S, Pradhan S, Jacobsen SE. 5-hydroxymethylcytosine is associated with enhancers and gene bodies in huan embryonic stem cells. Genome Biol. 2011;12:R54. doi: 10.1186/gb-2011-12-6-r54. [DOI] [PMC free article] [PubMed] [Google Scholar]
- 31.Szulwach KE, Li X, Li Y, Song C-X, Han JW, Kim S, Namburi S, Hermetz K, Kim JJ, Rudd MK, et al. Integrating 5-hydroxymethylcytosine into the epigenomic landscape of human embryonic stem cells. PLoS Genet. 2011;7:e1002154. doi: 10.1371/journal.pgen.1002154. [DOI] [PMC free article] [PubMed] [Google Scholar]
- 32.Haffner MC, Chaux A, Meeker AK, Esopi DM, Gerber J, Pellakuru LG, Toubaji A, Argani P, Iacobuzio-Donahue C, Nelson WG, et al. Global 5-hydroxymethylcytosine content is significantly reduced in tissue stem/progenitor cell compartments and in human cancers. Oncotarget. 2011;2: 627–637. doi: 10.18632/oncotarget.316. [DOI] [PMC free article] [PubMed] [Google Scholar]
- 33.Szulwach KE, Li X, Li Y, Song C-X, Wu H, Dai Q, Irier H, Upadhyay AK, Gearing M, Levey AI, et al. 5-hmC-mediated epigenetic dynamics during postnatal neurodevelopment and aging. Nat. Neurosci. 2011;14:1607–1616. doi: 10.1038/nn.2959. [DOI] [PMC free article] [PubMed] [Google Scholar]
- 34.Klug M, Rehli M. Functional analysis of promoter CpG methylation using a CpG-free luciferase reporter vector. Epigenetics. 2006;1:127–130. doi: 10.4161/epi.1.3.3327. [DOI] [PubMed] [Google Scholar]
- 35.Lefebvre B, Benomar Y, Guédin A, Langlois A, Hennuyer N, Dumont J, Bouchaert E, Dacquet C, Pénicaud L, Casteilla L, et al. Proteasomal degradation of retinoid X receptor alpha reprograms transcriptional activity of PPARgamma in obese mice and humans. J. Clin. Invest. 2010;120:1454–1468. doi: 10.1172/JCI38606. [DOI] [PMC free article] [PubMed] [Google Scholar]
- 36.Eeckhoute J, Lupien M, Meyer CA, Verzi MP, Shivdasani RA, Liu XS, Brown M. Cell-type selective chromatin remodeling defines the active subset of FOXA1-bound enhancers. Genome Res. 2009;19:372–380. doi: 10.1101/gr.084582.108. [DOI] [PMC free article] [PubMed] [Google Scholar]
- 37.Langmead B, Trapnell C, Pop M, Salzberg SL. Ultrafast and memory-efficient alignment of short DNA sequences to the human genome. Genome Biol. 2009;10:R25. doi: 10.1186/gb-2009-10-3-r25. [DOI] [PMC free article] [PubMed] [Google Scholar]
- 38.Li H, Handsaker B, Wysoker A, Fennell T, Ruan J, Homer N, Marth G, Abecasis G, Durbin R. The Sequence alignment/map format and SAMtools. Bioinformatics. 2009;25:2078–2079. doi: 10.1093/bioinformatics/btp352. [DOI] [PMC free article] [PubMed] [Google Scholar]
- 39.Zhang Y, Liu T, Meyer CA, Eeckhoute J, Johnson WE, Bernstein BE, Nusbaum C, Myers RM, Brown M, Li W, et al. Model-based Analysis of ChIP-Seq (MACS) Genome Biol. 2008;9:R137. doi: 10.1186/gb-2008-9-9-r137. [DOI] [PMC free article] [PubMed] [Google Scholar]
- 40.Creyghton MP, Cheng AW, Welstead GG, Kooistra T, Carey BW, Steine EJ, Hanna J, Lodato MA, Frampton GM, Sharp PA, et al. Histone H3K27ac separates active from poised enhancers and predicts developmental state. Proc. Natl Acad. Sci. USA. 2010;107:21931–21936. doi: 10.1073/pnas.1016071107. [DOI] [PMC free article] [PubMed] [Google Scholar]
- 41.Jones-Villeneuve EM, McBurney MW, Rogers KA, Kalnins VI. Retinoic acid induces embryonal carcinoma cells to differentiate into neurons and glial cells. J. Cell Biol. 1982;94:253–262. doi: 10.1083/jcb.94.2.253. [DOI] [PMC free article] [PubMed] [Google Scholar]
- 42.Moens CB, Selleri L. Hox cofactors in vertebrate development. Dev. Biol. 2006;291:193–206. doi: 10.1016/j.ydbio.2005.10.032. [DOI] [PubMed] [Google Scholar]
- 43.Wu H, Zhang Y. Tet1 and 5-hydroxymethylation: a genome-wide view in mouse embryonic stem cells. Cell Cycle. 2011;10:2428–2436. doi: 10.4161/cc.10.15.16930. [DOI] [PMC free article] [PubMed] [Google Scholar]
- 44.Liu T, Ortiz JA, Taing L, Meyer CA, Lee B, Zhang Y, Shin H, Wong SS, Ma J, Lei Y, et al. Cistrome: an integrative platform for transcriptional regulation studies. Genome Biol. 2011;12:R83. doi: 10.1186/gb-2011-12-8-r83. [DOI] [PMC free article] [PubMed] [Google Scholar]
- 45.Shin H, Liu T, Manrai AK, Liu S. CEAS: cis-regulatory element annotation system. Bioinformatics. 2009;25:2605–2606. doi: 10.1093/bioinformatics/btp479. [DOI] [PubMed] [Google Scholar]
- 46.McLean CY, Bristor D, Hiller M, Clarke SL, Schaar BT, Lowe CB, Wenger AM, Benjerano G. GREAT improves functional interpretation of cis-regulatory regions. Nat. Biotechnol. 2010;42:1093–1100. doi: 10.1038/nbt.1630. [DOI] [PMC free article] [PubMed] [Google Scholar]
- 47.Giresi PG, Lieb JD. Isolation of active regulatory elements from eukaryotic chromatin using FAIRE (Formaldehyde Assisted Isolation of Regulatory Elements) Methods. 2009;48:233–239. doi: 10.1016/j.ymeth.2009.03.003. [DOI] [PMC free article] [PubMed] [Google Scholar]
- 48.Ong C-T, Corces VG. Enhancer function: new insights into the regulation of tissue-specific gene expression. Nat. Rev. Genet. 2011;12:283–293. doi: 10.1038/nrg2957. [DOI] [PMC free article] [PubMed] [Google Scholar]
- 49.Nielsen R, Pedersen TA, Hagenbeek D, Moulos P, Siersbaek R, Megens E, Denissov S, Borgesen M, Francoijs KJ, Mandrup S, et al. Genome-wide profiling of PPARgamma:RXR and RNA polymerase II occupancy reveals temporal activation of distinct metabolic pathways and changes in RXR dimer composition during adipogenesis. Genes Dev. 2008;22:2953–2967. doi: 10.1101/gad.501108. [DOI] [PMC free article] [PubMed] [Google Scholar]
- 50.Siersbaek R, Nielsen R, John S, Sung MH, Baek S, Loft A, Hager GL, Mandrup S. Extensive remodeling and establishment of transcription factor ‘hotspots’ during early adipogenesis. EMBO J. 2011;30:1459–1472. doi: 10.1038/emboj.2011.65. [DOI] [PMC free article] [PubMed] [Google Scholar]
- 51.Lefterova MI, Steger DJ, Zhuo D, Qatanani M, Mullican SE, Tuteja G, Manduchi E, Grant GR, Lazar MA. Cell-specific determinants of peroxisome proliferator-activated receptor gamma function in adipocytes and macrophages. Mol. Cell. Biol. 2010;30:2078–2089. doi: 10.1128/MCB.01651-09. [DOI] [PMC free article] [PubMed] [Google Scholar]
- 52.Schmidt SF, Jørgensen M, Chen Y, Nielsen R, Sandelin A, Mandrup S. Cross species comparison of C/EBPα and PPARγ profiles in mouse and human adipocytes reveals interdependent retention of binding sites. BMC Genomics. 2011;12:152. doi: 10.1186/1471-2164-12-152. [DOI] [PMC free article] [PubMed] [Google Scholar]
- 53.Zhang Z, Chang CW, Goh WL, Sung W-K, Cheung E. CENTDIST: discovery of co-associated factors by motif distribution. Nucleic Acids Res. 2011;39:W391–W399. doi: 10.1093/nar/gkr387. [DOI] [PMC free article] [PubMed] [Google Scholar]
- 54.Qin P, Haberbusch JM, Zhang Z, Soprano KJ, Soprano DR. Pre-B cell leukemia transcription factor (PBX) proteins are important mediators for retinoic acid-dependent endordermal and neuronal differentiation of mouse embryonal carcinoma cells. J. Biol. Chem. 2004;279:16263–16271. doi: 10.1074/jbc.M313938200. [DOI] [PubMed] [Google Scholar]
- 55.Cristancho AG, Lazar MA. Forming functional fat: a growing understanding of adipocyte differentiation. Nat. Rev. Mol. Cell. Biol. 2011;12:722–734. doi: 10.1038/nrm3198. [DOI] [PMC free article] [PubMed] [Google Scholar]
- 56.Jacobs Y, Schnabel CA, Cleary ML. Trimeric association of Hox and Tale homeodomain proteins mediates Hoxb2 hindbrain enhancer activity. Mol. Cell. Biol. 1999;19:5134–5142. doi: 10.1128/mcb.19.7.5134. [DOI] [PMC free article] [PubMed] [Google Scholar]
- 57.Matarese F, Carrillo-de Santa Pau E, Stunnenberg HG. 5-Hydroxymethylcytosine: a new kid on the epigenetic block? Mol. Syst. Biol. 2011;7:562. doi: 10.1038/msb.2011.95. [DOI] [PMC free article] [PubMed] [Google Scholar]
- 58.Wu H, D’Alessio AC, Ito S, Xia K, Wang Z, Cui K, Zhao K, Sun YE, Zhang Y. Dual functions of Tet1 in transcriptional regulation in mouse embryonic stem cells. Nature. 2011;473:389–393. doi: 10.1038/nature09934. [DOI] [PMC free article] [PubMed] [Google Scholar]
- 59.Valinluk V, Tsai HH, Rogstad DK, Burdzy A, Bird A, Sowers LC. Oxidative damage to methyl-CpG sequences inhibits the binding of methyl-CpG binding domain (MBD) of methyl-CpG binding protein 2 (MeCP2) Nucleic Acids Res. 2004;32:4100–4108. doi: 10.1093/nar/gkh739. [DOI] [PMC free article] [PubMed] [Google Scholar]
- 60.Jin SG, Kadam S, Pfeifer GP. Examination of the specificity of DNA methylation profiling techniques towards 5-methylcytosine and 5-hydroxymethylcytosine. Nucleic Acids Res. 2010;38:e125. doi: 10.1093/nar/gkq223. [DOI] [PMC free article] [PubMed] [Google Scholar]
- 61.Valinluk V, Sowers LC. Endogenous cytosine damage products alter the site selectivity of human DNA maintenance methyltransferase DNMT1. Cancer Res. 2007;67:946–950. doi: 10.1158/0008-5472.CAN-06-3123. [DOI] [PubMed] [Google Scholar]
- 62.Jones PL, Veenstra GJ, Wade PA, Vermaak D, Kass SU, Landsberger N, Strouboulis J, Wolffe AP. Methylated DNA and MeCP2 recruit histone deacetylase to repress transcription. Nat. Genet. 1998;19:187–191. doi: 10.1038/561. [DOI] [PubMed] [Google Scholar]
- 63.Nan X, Ng HH, Johnson CA, Laherty CD, Turner BM, Eisenman RN, Bird A. Transcriptional repression by the methyl-CpG-binding protein MeCP2 involves a histone deacetylase complex. Nature. 1998;393:386–389. doi: 10.1038/30764. [DOI] [PubMed] [Google Scholar]
- 64.Fuks F, Hurd PJ, Wolf D, Nan X, Bird AP, Kouzarides T. The methyl-CpG-binding protein MeCP2 links DNA methylation to histone methylation. J. Biol. Chem. 2003;278:4035–4040. doi: 10.1074/jbc.M210256200. [DOI] [PubMed] [Google Scholar]
- 65.Wiench M, John S, Baek S, Johnson TA, Sung M-H, Escobar T, Simmons CA, Pearce KH, Biddie SC, Sabo PJ, et al. DNA methylation status predicts cell-type specific enhancer activity. EMBO J. 2011;30:3028–3039. doi: 10.1038/emboj.2011.210. [DOI] [PMC free article] [PubMed] [Google Scholar]
- 66.Stadler MB, Murr R, Burger L, Ivanek R, Lienert F, Schöler A, Wirbelauer C, Oakeley EJ, Gaidatzis VK, Schübeler D. DNA-binding factors shape the mouse methylome at distal regulatory regions. Nature. 2011;480:490–495. doi: 10.1038/nature10716. [DOI] [PubMed] [Google Scholar]
- 67.Barnea E, Bergman Y. Synergy of SF1 and RAR in activation of Oct3/4 promoter. J. Biol. Chem. 2000;275:6608–6619. doi: 10.1074/jbc.275.9.6608. [DOI] [PubMed] [Google Scholar]
- 68.Gu P, Goodwin B, Chung AC-K, Xu X, Wheeler DA, Price RR, Galardi C, Peng L, Latour AM, Koller BH, et al. Orphan nuclear receptor LRH-1 is required to maintain Oct4 expression at the epiblast stage of embryonic development. Mol. Cell. Biol. 2005;25:3492–3505. doi: 10.1128/MCB.25.9.3492-3505.2005. [DOI] [PMC free article] [PubMed] [Google Scholar]
- 69.Zhang X, Zhang J, Wang T, Esteban MA, Pei D. Esrrb activates Oct4 transcription and sustains self-renewal and pluripotency in embryonic stem cells. J. Biol. Chem. 2008;283:35825–35833. doi: 10.1074/jbc.M803481200. [DOI] [PubMed] [Google Scholar]
Associated Data
This section collects any data citations, data availability statements, or supplementary materials included in this article.
Supplementary Materials
Supplementary Data