The long-range interaction landscape of gene promoters (original) (raw)
. Author manuscript; available in PMC: 2013 Mar 6.
Published in final edited form as: Nature. 2012 Sep 6;489(7414):109–113. doi: 10.1038/nature11279
Abstract
The vast non-coding portion of the human genome is awash in functional elements and disease-causing regulatory variants. The principles defining the relationships between these elements and distal target genes remain unknown. Promoters and distal elements can engage in looping interactions that have been implicated in gene regulation1. Here we have applied chromosome conformation capture carbon copy, 5C2, to comprehensively interrogate interactions between transcription start sites (TSSs) and distal elements in 1% of the human genome representing the ENCODE pilot project regions3. 5C maps were generated for GM12878, K562 and HeLa-S3 cells and results were integrated with data from the ENCODE consortium4. In each cell line we discovered >1,000 long-range interactions between promoters and distal sites that include elements resembling enhancers, promoters and CTCF-bound sites. We observed significant correlations between gene expression, promoter-enhancer interactions and the presence of enhancer RNAs. Long-range interactions display striking asymmetry with a bias for interactions with elements located ~120 Kb upstream of the TSS. Long-range interactions are often not blocked by sites bound by CTCF and cohesin implying that many of these sites do not demarcate physically insulated gene domains. Further, only ~7% of looping interactions are with the nearest gene, suggesting that genomic proximity is not a simple predictor for long-range interactions. Finally, promoters and distal elements are engaged in multiple long-range interactions to form complex networks. Our results start to place genes and regulatory elements in three-dimensional context, revealing their functional relationships.
Spatial proximity and specific long-range interactions between genomic elements can be detected using 3C-based methods5. Previous studies have been limited to analysis of single loci5-8, to interactions that involve a single protein of interest 9 or to analysis of genome-wide folding of chromosomes at a resolution that cannot detect specific looping interactions between genes and functional elements10. To overcome these limitations we previously developed 5C2. 5C is a high-throughput adaptation of 3C and employs pools of Reverse and Forward 5C primers to detect long-range interactions between two targeted sets of genomic loci, e.g. promoters and distal gene regulatory elements in this study. By targeting a specific part of the genome 5C facilitates detection of interactions at single restriction fragment resolution.
To begin to define principles of long-range gene regulation in the human genome we have employed 5C to systematically map interactions between promoters and distal elements throughout the 44 ENCODE pilot project regions representing 1% (30 Mb, Supplementary Table 1) of the genome in 3 cell lines (Figure 1a). The ENCODE regions, ranging in size from 500 Kb to 1.9 Mb, were selected for comprehensive annotation by the ENCODE pilot project11. Here we analyzed interactions between 628 TSS-containing restriction fragments and 4,535 “distal” restriction fragments covering the ENCODE regions (Figure 1a; Supplementary Tables 2 and 3, see supplementary methods).
Figure 1. 5C approach to identify looping interactions.
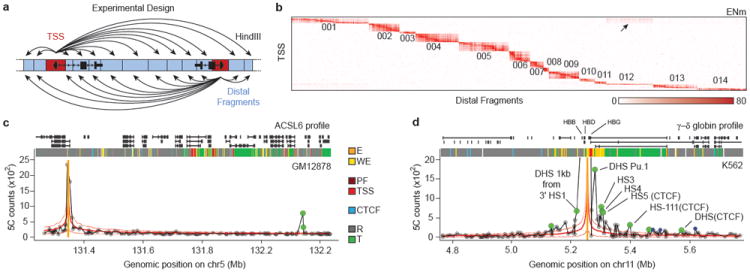
a, 5C design29. Reverse 5C primers were designed for _Hin_dIII fragments that contains a TSS (red; according to the Gencode-v720) and Forward 5C primers for all other ‘distal’ _Hin_dIII fragments (blue). b, Heatmap of all interrogated TSS-distal fragment interactions in 14 ENCODE regions (ENm001-014) in K562 cells. Fragments are displayed in their genomic order. Each dark rectangular area in the heatmap denotes interactions within a single ENCODE region while remaining areas denote interactions between regions. ENCODE regions that are on the same chromosome show a higher interaction frequency (arrow) than regions that were on different chromosomes. c and d, examples of 5C interaction profiles for two TSSs indicated by vertical orange bars (left: ASCL6 gene located in ENm002; right: γ-δ globin located in ENm009). The solid red lines show the expected interaction level (LOWESS line, Supplementary Methods); dashed red lines above and below indicate LOWESS ± 1 standard deviation. 5C signals that are significantly higher than expected in both biological replicates (green circles, False Discovery Rate = 1%) are considered looping interactions. Interactions that are significant in only one replicate (blue circles) are not considered as a high-confidence 5C looping interaction. 5C peak calling detects a long-range interaction between the TSS of ASCL6 and a distal CTCF-bound element in GM12878 cells. The approach identifies the known long-range interactions of γ-δ globin to HS-3,4,5 and -111 and several additional DHS and CTCF sites in K562 cells2 (labeled).
5C libraries were generated for 2 biological replicates of GM12878, K562 and HeLa-S3 (Supplemental Table 4-6). These cell lines are extensively annotated by the ENCODE consortium3,4. 5C interaction frequencies measured between ENCODE regions located on different chromosomes were used to quantify minor variations in interaction detection efficiencies, due to technical biases related to either 5C primer efficiency, restriction fragment length or digestion efficiency. 5C interaction frequencies were then corrected for these biases (Supplementary Methods; Supplementary Data File).
An example of a 5C long-range interaction map representing TSS-distal fragment interactions along and between 14 ENCODE regions (ENm001-ENm014) is shown in Figure 1b. 5C detects known general features of spatial chromatin organization. First, interactions within the same ENCODE region are more frequent than those between different ENCODE regions. Within one ENCODE region interaction frequencies are generally higher for pairs of loci located closer together in the linear genome. This inverse relationship between genomic distance and interaction frequency is as expected for a flexible chromatin fiber5,12. Second, interactions between ENCODE regions that are located on the same chromosome are more frequent than interactions between regions located on different chromosomes (arrow in Figure 1b). This is consistent with 4C and Hi-C analyses6,10, and is due to the formation of spatially separated chromosome territories.
5C datasets were analyzed to identify TSS-distal fragment pairs that interact more frequently than expected indicating they are relatively close in space. For each biological replicate we independently determined the average relationship between interaction frequency and genomic distance (solid red lines in Figure 1 (for the ASCL6 (1c) and the γ–δ-globin promoters (1d)). We defined this as the expected interaction frequency. Next we identified interactions that occur significantly more frequent than expected for loci separated by a corresponding genomic distance by transforming 5C signals into a z-score (FDR=1%, Supplementary Methods). Specific long-range interactions are then defined as pairs of loci that interact significantly more frequently than expected in both replicates. By excluding interactions that are significant in only one replicate we estimate that only around 10-18% of the significant long-range interactions identified by our approach might be false positives, as estimated from analysis of interactions in gene desert ENCODE regions (ENr112, 113 and 313) where no significant long-range interactions were expected (Supplementary Methods). This stringent thresholding likely leads to a higher false-negative rate. Consistently, interaction frequencies that are found to be significant in only one replicate are still significantly elevated in the other replicate as compared to interactions that are never significant, but are just below the chosen 1% FDR threshold (Supplementary Figure 1).
Our analysis correctly identified known interactions between TSSs and their cognate distal regulatory elements, providing validation of the approach (Supplementary Figure 3). As an example, Figure 1d shows the 5C interaction profile in K562 cells for a TSS located in the beta-globin locus. We previously found that this TSS located just downstream of the gamma-globin genes, displayed prominent looping interactions with the distal Locus Control Region (LCR) in K562 cells2. Our analysis accurately detected these looping interactions (HS3, 4, 5). We identified additional known long-range interactions with DNase I hypersensitive sites (DHSs) near distal CTCF-bound elements (3’HS1 and HS-111)2,13,14. In K562 cells we also detected the known interactions between the gamma-globin gene and the LCR (HS5) and between the alpha-globin genes and three distal regulatory elements including the alpha-globin enhancer HS40, and two CTCF-bound elements (HS46 and HS10), located 40, 46 and 10 Kb upstream of the genes respectively (Supplementary Figure 3, 15,16). The importance of these distal elements in regulating globin gene expression through looping has been extensively documented14,16. As expected these looping interactions in the globin loci were not detected in GM12878 or HeLa-S3 cells that express little or any globin (Supplemental Figure 3). Additional examples of cell-type specific TSS-distal elements interactions are shown in Supplementary Figure 4. Furthermore, 5C interaction frequencies are correlated with TSS-distal DHS pairs predicted to be functionally connected based on their highly correlated activity across a large panel of cell lines (P < 10-13, one-sided Mann-Whitney test17), providing independent validation of their biological significance.
In each cell line we identified large numbers of statistically significant TSS-distal fragment interactions, of which ~60% were observed in only one of the 3 cell lines (Figure 2a). These data point to intricate cell type specific three-dimensional folding of chromatin. 3C-based assays detect specific and functional interactions, e.g. TSSs with gene regulatory elements8. In addition the assay will detect “structural” interactions, e.g. close spatial proximity as a result of other nearby specific looping interactions (bystander interactions) or overall higher order folding of the chromatin fiber. To determine which looping interactions involved distal sites that displayed specific chromatin features associated with functional elements we compared our data with datasets generated by the ENCODE consortium (Figure 2b; Supplementary Table 7). We find that looping interactions in all cell lines are significantly enriched for distal fragments that are bound by CTCF, a protein known to mediate DNA looping18, contain open chromatin (as determined by FAIRE19 or DHS mapping17), and/or histones with modifications that are characteristic for active functional elements (H3K4me1, H3K4me2, H3K4me3). Long-range interactions are also enriched for H3K9ac and H3K27ac, but are not enriched or significantly depleted for H3K27me3, a mark typically found at inactive or closed chromatin.
Figure 2. Distribution of looping interactions across cell types and their relationship with chromatin features and gene expression.
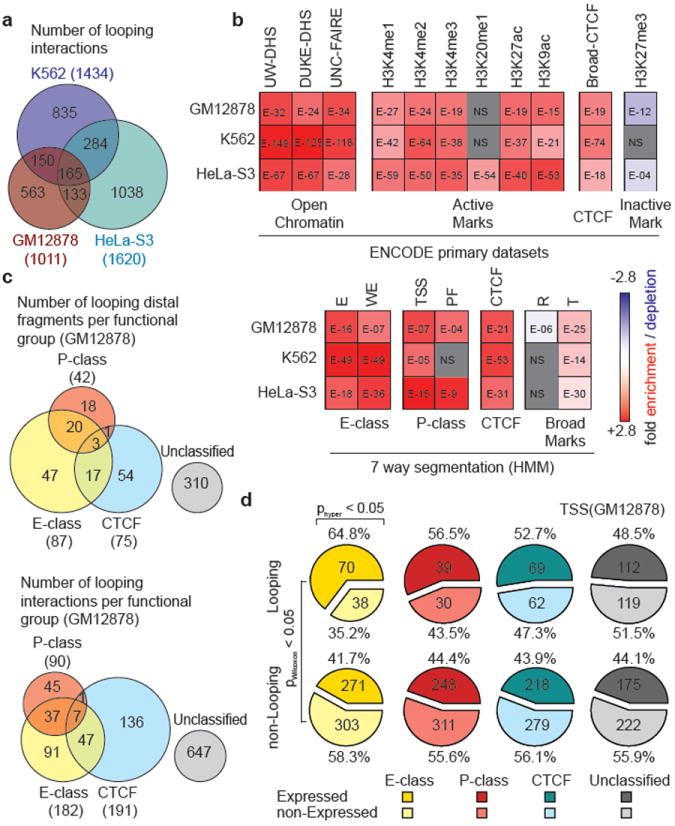
a, Venn diagram showing the number of unique and overlapping looping interactions across 3 cell types. b, Heatmap showing the enrichment/depletion of chromatin features in looping fragments compared to all interrogated fragments based on genome-wide datasets from ENCODE consortium (Supplemental Table 7). Features include Open Chromatin: UW DHS, Duke DHS and UNC-FAIRE; Active Marks: Broad Institute Histone H3K4me1/2/3, H4K20me1, H3K27ac, H3K9ac; CTCF: Broad Institute CTCF ChIP peaks; Inactive Marks: Broad Institute Histone H3K27me3 and; 7-way segmentation20: based on HMM prediction for indicated cells. We further grouped segmentation categories E and WE into “E-class”, TSS and PF into “P-class”, and R and T into “Broad Marks”. The color scale represents the fold enrichment (red) or depletion (blue). The numbers listed inside each box represent p-values of the significant enrichment/depletion for that mark (NS= not significant, grey; two-tailed hypergeometric test and corrected for multiple testing using Bonferroni). c, Venn diagram showing the number of unique and overlapping looping distal fragments (top) and looping interactions (bottom) among 4 functional groups in GM12878 cells. Distal fragments are classified into 4 non-exclusive groups based on the 7-way segmentation. Similarly, TSS - distal fragment interactions are classified based on the functional grouping of the distal fragments. The four functional groups are E-class (yellow), P-class (magenta), CTCF (cyan) and Unclassified (grey). d, Pie charts showing percentages and numbers of expressed/non-expressed TSSs looping or not looping to a particular group (E-, P-, CTCF or Unclassified; colored as in c) of distal fragments in GM12878 cells. TSSs with a CAGE value > 0 are deemed expressed. Significant enrichment for expressed TSSs in the looping or non-looping categories are indicated on top (hypergeometric test; phyper<0.05). Significant differences in expression levels between TSS in the looping vs the non-looping category is indicated on the left (Wilcoxon signed-rank test; pWilcoxon<0.05).
To gain more insights into the types of elements present in the distal looping fragments we made use of genome-wide and cell line specific segmentation analyses that identified seven distinct chromatin states based on histone modifications, the presence of DHSs and the localization of proteins such as RNA polymerase II and CTCF (20; Figure 2b). These states are 1) “Enhancer” (E), 2) “Weak Enhancer” (WE), 3) “TSS”, 4) “Predicted Promoter Flanking regions” (PF), 5) “Insulator element” (CTCF), 6) “Predicted Repressed region” (R) and 7) “Predicted Transcribed region” (T). The ENCODE consortium tested sets of the E elements in enhancer assays and confirmed that >50% display enhancer activity4. We find that looping interactions are significantly enriched for distal fragments that contain E, WE and CTCF elements, and the actively transcribed chromatin state (“T”), but are depleted for the repressed chromatin state (“R”). We note that some distal looping fragments contain elements classified as “TSS” or “PF”, even though they do not contain TSSs as defined by the GENCODE v7 annotation21. Possibly, these are yet to be annotated TSSs.
Next, we used the 7-way segmentation data to categorize looping interactions into four broader functional groups (Figure 2c, Supplementary Figure 5, Supplementary Data File): those that involve a distal fragment that contains a putative enhancer (“E”: E or WE), a putative promoter (“P”: TSS or PF), or a CTCF-bound element (CTCF). The final class contains interactions with fragments that do not contain any of these three types of elements, although they do contain “T” and “R” states (“U”: unclassified). The last class is relatively large but is still significantly enriched in features that are characteristic for active functional elements such as H3K4me1 and over 60% of the unclassified fragments contain chromatin features found at active chromatin elements (Supplementary Figure 7). Thus, these are not simply noise or false-positives, but are likely the result of the conservative segmentation approach.
We find that TSS-E and TSS-P interactions are more cell type specific than TSS-CTCF interactions: in case of the TSS-E and TSS-P categories the ratio of interactions that is seen in only one cell line vs more than one cell line is ~4:1, whereas it is close to ~1:1 for TSS-CTCF category (Supplementary figure 5). The cell type specific activity of some of these E-elements was confirmed using transient reporter assays (Supplementary Figure 10). Next, we determined whether looping of a TSS to any of the four categories of chromatin states is correlated with transcription. We used CAGE expression data22 to assign an expression level to each TSS. We find that looping interactions with elements containing enhancer-like E elements are significantly enriched for those that involve expressed TSSs. (Figure 2d, Supplementary Figure 6). In addition, the subset of TSSs that interact with fragments containing E-elements were significantly more highly expressed compared to TSSs that do not interact with E-elements. Interactions with other classes of elements (CTCF, P, and Unclassified) are in some cell lines, but not all, significantly enriched for actively expressed genes (Supplementary Figure 6).
Active enhancers often express enhancer RNAs23. We used a comprehensive enhancer RNA dataset generated by the ENCODE consortium to determine whether TSSs preferentially interact with active enhancer-like elements24. We find that E-elements that are looping to TSSs are significantly more likely to express enhancer RNAs than E-elements that are not looping (P<5×10⁻⁵, hypergeometric test, Supplementary Figure 10). We conclude that looping interactions preferentially involve active enhancer-like elements.
Next we analyzed the distribution of long-range interactions up- and downstream of TSSs. To generate this landscape of looping interactions we aligned all TSSs and calculated the average number of interactions that a TSS has with each class of distal element at increasing genomic distances up- and downstream of the TSS. Figure 3a shows the resulting average long-range interaction profile across all 3 cell lines (similar results were obtained when each of the cell lines was analyzed separately, Supplementary Figure 8). Strikingly, we find that the long-range interaction landscape is asymmetric with interactions of E, P, and CTCF classes peaking around 120 Kb upstream of the TSS. This asymmetry of interactions reveals an unanticipated directionality in long-range interactions with TSSs. This may indicate the presence of topological constraints imposed by the mechanism by which such interactions regulate target promoters. No such bias was observed for the set of unclassified elements, or for the complete set of interrogated interactions (Figure 3a). Interestingly, previous analyses showed that conserved non-coding elements are also often found within similar distances of target genes25. Third, when we analyzed expressed TSSs and non-expressed TSSs separately we find that both have a similar interaction landscape but that expressed TSSs tend to have more interactions, especially with the E, P and CTCF classes. We cannot rule out the possibility that some TSSs classified as non-expressed based on the absence of CAGE tags are actually expressed at low levels.
Figure 3. Looping landscape of TSSs to distal fragments.
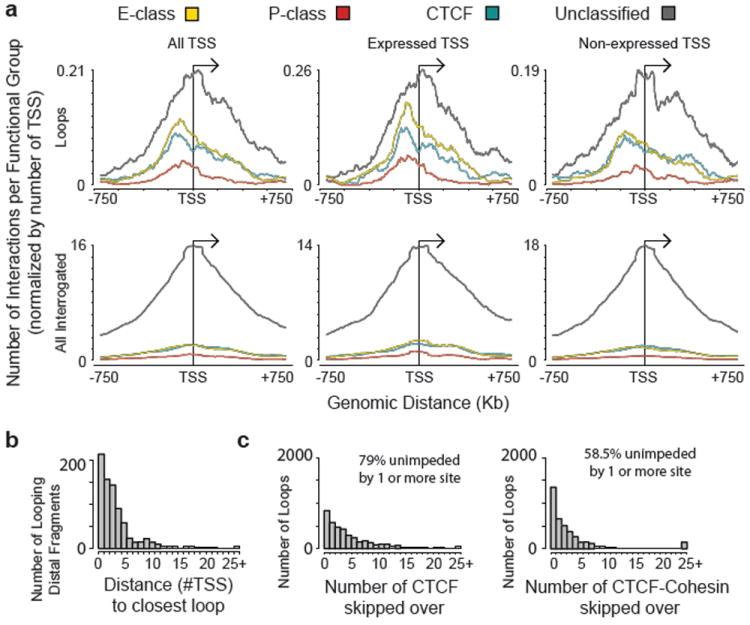
a, Composite profile of average number of group-specific looping interactions upstream and downstream of TSSs based on combined 5C interaction data from the 3 cell lines. The top panel shows the average looping profiles of all TSSs (left), of expressed TSSs (middle) and of non-expressed TSSs (right). The bottom set of plots shows the corresponding profiles of all interrogated TSS-distal element interactions (left), of expressed TSSs (middle) and of non-expressed TSSs (right). All the interaction data for a particular group for all 3 cell lines are binned with a sliding window of 150 Kb (step size of 5 Kb) and normalized for the number of TSSs. b, Histogram showing the number of distal fragments that are involved in looping with their target promoters skipping 0,1,2,…, 25 (and above) TSSs. c, Histogram showing the number of looping interactions that skip over 0, 1, 2,…, 25 (and above) restriction fragments bound by either CTCF (left) or by both CTCF and Rad21 (cohesin; right). In b and c combined results for all 3 cell lines are plotted and values above 24 on the x-axis are added and grouped as 25+. All the values above 24 in the x-axis are added and grouped as 25+. Percentage of looping interactions that skip ≥1 CTCF (left) or CTCF + cohesin (right) are indicated on top.
Next we explored whether the relative order of elements in the genome affects which long-range interactions occur. It is often assumed that distal elements such as enhancers target the nearest TSS. We find that only ~7% of the looping interactions are between an element and the nearest TSS (Figure 3b). This number goes up to 22% when only active TSSs are included. Similarly, 27% of the distal elements have an interaction with the nearest TSS, and 47% of elements have interactions with the nearest expressed TSS. Thus, when predicting TSS-distal element interactions, choosing the nearest (active) gene is often not correct.
It has been suggested that CTCF sites located between an enhancer and a TSS may prevent enhancer-promoter interactions 18,26, although in individual cases interactions over such sites have been observed14,27. To address this question we determined how frequently we identified long-range interactions between a TSS and a distal element that skip over a site bound by CTCF. We find that 79% of long-range interactions are unimpeded by the presence of one or more CTCF-bound sites (Figure 3c). Thus the mere presence of a CTCF-bound site does not block physical long-range interactions. It has been reported that CTCF acts in conjunction with the cohesin complex to block promoter-enhancer interactions28. We find that 58% of looping interactions skip sites co-bound by CTCF and cohesin (Figure 3c). Similar results were obtained when the different categories of long-range interactions (TSS-E, TSS-P, TSS-CTCF and TSS-U) were analyzed separately. Possibly, additional factors need to be recruited to CTCF-bound sites to acquire interaction-blocking activity.
The large numbers of long-range interactions we discovered suggest that distal elements and TSSs are each engaged in multiple long-range interactions. To characterize this phenomenon in more detail we determined the interaction degree of TSS and distal fragments. We find that ~50% of TSSs display one or more long-range interaction with some interacting with as many as 20 distal fragments (Figure 4a). Expressed TSSs interact with slightly more elements as compared to non-expressed TSSs (for GM12878 mean is 1.84 vs 1.35; or 3.79 vs 3.20 when including only those TSS with at least one interaction). Out of all distal fragments interrogated, ~10% interact with one or more TSSs, with some interacting with more than 10 (mean 2.14 (for GM12878) when including only those distal fragments with at least one interaction). The degree distribution of the four categories of distal elements was very similar (Supplementary Figure 9).
Figure 4. Networks of looping interactions.
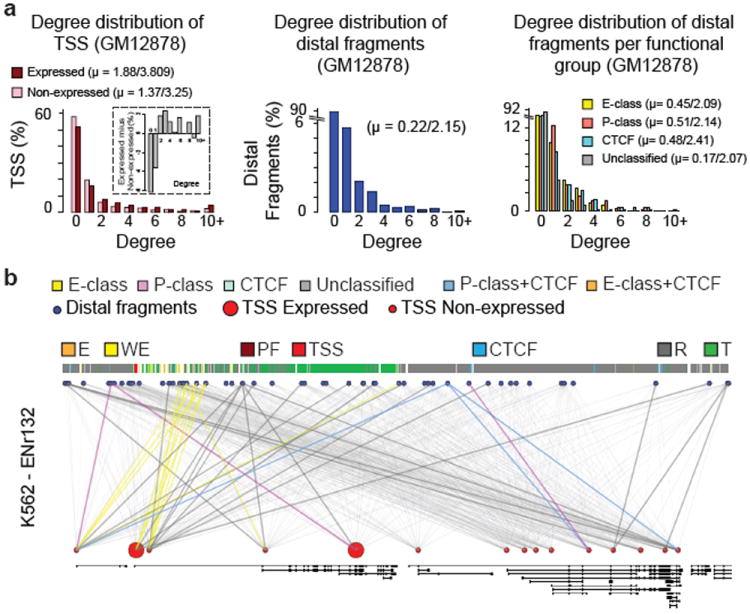
a, Histogram showing the number of TSSs (left, red) or distal fragments (middle, blue) in percentages that are involved in 0, 1, 2,…., 10 (and above) looping interactions (degree, x-axis) in GM12878 cells. All the values for degrees that are >9 are grouped under degree 10+. The dark red bars represent the percentages of looping TSSs that are expressed while light red bars represent the percentages of looping TSSs that are not expressed. Inset: the difference in percentages between looping TSSs that are expressed and not expressed for each degree is shown. The right panel: degree distribution for each functional group of distal fragments. The average degrees (mean, μ) for TSSs and distal fragments are indicated. The first value is the mean degree considering all the TSS/distal fragments (looping + non-looping) while the second value is the mean degree of looping TSS/distal fragments (excluding degree = 0). b, Webplot showing the long-range looping interactions in ENr132 region in K562 cells. The interrogated distal fragments (blue circle) and the TSS (red circle) are positioned according to genomic coordinates and the Gencode v7 gene annotation is indicated. The size of the red circles denotes if that TSS is expressed (big circle) or not expressed (small circle). The thin grey lines show all the interactions that were interrogated. The colored lines show significant looping interactions between TSSs and distal fragments of a particular group.
Figure 4b shows an example of the complex long-range interaction networks formed by TSSs and distal elements in the ENr132 region in K562 cells. It is unlikely that these interactions can all occur at the same time in the same cell, which implies significant cell-to-cell variation. The data imply that gene-element interactions are not exclusively one-to-one, and suggest that multiple genes and distal elements can come together in larger clusters, as proposed for the beta-globin locus14.
Overall, our data provide new insights into the landscape of chromatin looping that bring genes and distant elements in close spatial proximity. Besides generating a rich dataset reflecting specific gene-element interactions, the average interaction profile of TSSs with surrounding chromatin reveals several general principles regarding the asymmetric relationships between genomic distance, the order of elements, and the formation of looping interactions. The bias for upstream interactions may indicate that the protein complexes on many TSSs may be asymmetric and may preferentially interact on one side with enhancer-protein complexes. It is also possible that the asymmetry of the long-range interaction landscape reflects a potential preference of looping to elements that are located in intergenic non-transcribed regions. Furthermore, while these average long-range interaction landscapes may facilitate computational prediction of long-range interactions throughout the genome, the fact that interactions skip genes and CTCF/cohesin sites suggests that additional mechanisms for target selection and gene insulation exist.
Although conventional 3C may still be the method of choice to study the folding of individual loci, the 5C design strategy and data analysis methods applied here may provide a general approach for systematically mapping gene-element interactions for large gene sets. With further 3C technology development and increases in sequencing capacity, similar high-resolution studies should become feasible to map specific long-range interactions throughout the genome, which may uncover additional principles that guide chromatin looping. Such insights will also be critical for interpreting genome-wide association studies that often identify regions with regulatory elements but not their distally located target genes.
Supplemental Methods
Tissue culture
Cell growth conditions
GM12878 lymphoblastoid cells were procured from Coriell Cell Repositories and grown in RPMI 1640 medium supplemented with 2mM L-glutamine, 15% fetal bovine serum (FBS) and antibiotic (1% Pen-Strep). K562 (CCL-243), a CML cell line and HeLa-S3 (CCL2.2), a cervical carcinoma cell line were obtained from American Type Culture Collection (ATCC). K562 cells were cultured in similar media as GM12878 except with 10% FBS while HeLa-S3 cells were maintained in ATCC recommended F-12K Medium (Kaighn’s Modification of Ham’s F-12 Medium) with 10% FBS and 1% Pen-Strep. The culture densities and conditions were maintained as per recommendations of the repositories.
Formaldehyde crosslinking
For suspension cells (GM12878, K562) cells a total of 1×10ˆ8 freshly growing cells were centrifuged at 100Xg for 5 minutes. Cell pellets were resuspended in 45 mL of respective growth medium in a 50 mL Falcon tube. Cells were fixed by addition of 1.25 mL of 37% formaldehyde (final concentration of formaldehyde 1%). The cell suspension was gently mixed by inverting the tube up and down 4-6 times at room temperature and the tubes was rotated on an end-to-end shaker for exactly 10 minutes. Crosslinking was stopped by addition of 3M glycine (final concentration 125 mM) and cell suspensions were incubated at room temp for 15 minutes using an end-to-end shaker. The crosslinked cells were then pelleted at 100Xg for 5 minutes and the cell pellet was stored at -80°C. For HeLa-S3, the adherent cells were first trypsinized and then the crosslinking was performed as described above.
5C analysis
5C analysis was carried out as previously described 1,2 for the 44 ENCODE Pilot regions (ENCODE Manual – ENm and ENCODE Random – Enr). The chromosomal position and coordinates of the regions as per the Feb 2009 GRCh37/hg19 human genome assembly are enlisted in (supplemental table S1). The 5C experiment is designed to interrogate looping interactions between _Hin_dIII fragments containing transcription start sites (TSS) and any other _Hin_dIII restriction fragment (“distal fragments”) in the ENCODE Pilot regions.
5C primer design
5C primers were designed at _Hin_dIII restriction sites (AAGCTT) using 5C primer design tools previously developed and made available online at My5C website (http://my5C.umassmed.edu) 3. Reverse 5C primers were designed for _Hin_dIII restriction fragments overlapping a known TSS from GENCODE transcripts, or overlapping a start site as experimentally determined by CAGE Tag data of the ENCODE pilot project (Supplemental Table ST2). Forward 5C primers were designed for remaining of the _Hin_dIII restriction fragments (Supplemental Table ST3). For ENCODE regions that do not contain any TSS according to gene annotation in 2008 (ENr112, ENr113, ENr311 and ENr313) we employed an alternative primer design. For these regions an alternating design of forward and reverse 5C primers was used in which forward and reverse primers are designed for alternating restriction fragments1. Note that ENr311 contains genes according to 2011 GencodeV7 annotation4. Primers were excluded for highly repetitive sequences that prevented the design of a sufficiently unique 5C primer. Primers settings were as described before2: U-BLAST: 3; S-BLAST: 130: 15-MER: 1320; MIN_FSIZE: 40; MAX_FSIZE: 50000; OPT_TM: 65; OPT_PSIZE: 40. The 5C primers contained up to 40 bases that were specific for the corresponding restriction fragment. If a shorter sequence was sufficient to obtain a predicted annealing temperature of 65°C, that shorter sequence was used, and random sequence was added to make a total of 40 bases. All the 5C primers have an extension of universal tail sequences, at the 5’ end for Forward 5C primers, and at the 3’ end of Reverse 5C primers. DNA sequence of the universal tails of forward primers was 5′-CCTCTCTATGGGCAGTCGGTGAT-3′; DNA sequence for the universal tails of reverse primers was 5′-AGAGAATGAGGAACCCGGGGCAG-3′. A six base barcode was included between the specific sequence of the primers and the universal tail to aid in mapping of the high throughput short sequencing reads. The length of each primer was 69 bases. In total, 981 reverse primers and 5,321 forward primers were designed (corresponding to ~77.1% (6,302/8,174) of all _Hin_dIII fragments in the 44 ENCODE regions).
Generation of 5C libraries
3C was performed with _Hin_dIII restriction enzyme as previously described 2,5 for GM12878, K562 and HeLa-S3 cells separately with two biological replicates for each cell line. The 3C libraries were then interrogated by 5C. The 44 ENCODE regions were analyzed in two groups using two separate 5C primer pools. The first group (ENm) contained the manually picked ENCODE regions ENm001-014, and ENr313. The second group (ENr) contained the 30 randomly picked ENCODE regions. The two 5C primer pools were made by pooling 5C primers for interrogating long-range interactions in the two groups of ENCODE regions. In these pools each primer was present at a final concentration of 0.5fmol/μL.
The primer pool for the ENm group contained a total of 3,150 primers (476 reverse 5C primers and 2674 forward 5C primers). This primer pool allows interrogation of a total of 1,272,824 interactions. Of these, 83,427 interactions were between fragments that were both located in the same ENCODE region. The primer pool for the ENr group contained a total of 3,152 primers (505 reverse 5C primers and 2647 forward 5C primers). This primer pool allows interrogation of a total of 1,336,735 interactions. Of these, 34,859 interactions were between fragments that were both located in the same ENCODE region.
5C was performed in 10-15 reactions each containing an amount of 3C library that represents 200,000 genome equivalents and 0.5 fmol of each primer. The multiplex annealing reaction was performed overnight at 55 °C. Pairs of annealed 5C primers were ligated at the same temperature using Taq DNA ligase for 1 hour. Ligated 5C primer pairs, which represent a specific ligation junction in the 3C library and thus a long-range interaction between the two corresponding loci, were then amplified using 28 cycles of PCR with universal tail primers that recognize the common tails of the 5C forward and reverse primers. At least four separate amplification reactions were carried out for each 10-15 annealing reactions described above and all the PCR products were pooled together. This pool constitutes the 5C library. The libraries were concentrated using Qiaquick PCR purification kit and 3′-A tailing reaction was done using dATP and Taq DNA polymerase in presence of 1X standard Taq buffer (NEB) at 72°C for 30 minutes.
To facilitate Illumina paired end DNA sequence analysis of 5C libraries, Illumina paired end adapter oligos (Illumina, San Diego, CA) were ligated to the 5C library using the Illumina PE protocol. The linkered 5C library was then amplified by PCR (17 or 18 cycles, with Phusion High Fidelity DNA polymerase) using Illumina PCR primer PE 1.0 and 2.0. The 5C library gel purified and sequenced on the Illumina GA2 platform generating 36 base paired end reads.
5C read mapping
Sequencing data was obtained from an Illumina GAIIx machine and was processed through a custom pipeline to map and assemble 5C interactions. We used thirty six (36) base-pair paired end reads to sequence all 5C libraries. Due to sequencing efficiency some 5C libraries were re-sequenced as many as 10 times to obtain the required read depth for our analysis.
The fastQ files were taken directly from the Illumina GAIIx and fed into our in-house 5C mapping pipeline. Each side of the paired end read was independently mapped to a pseudo-genome of all possible 5C primer sequences using the novoalign mapping algorithm (V2.05 http://novocraft.com). The default alignment settings for novoalign were used. After mapping, if both of the paired end reads could be uniquely mapped to a 5C primer, a 5C interaction was assembled. Invalid interactions between the same primer or between primers of the same type were removed as these would represent a mapping artifact or an issue with the 5C technique. The number of invalid interactions detected across all libraries was < 0.01%, which would be expected if solely due to random mapping errors.
Statistics regarding the 5C library quality, mapping efficiency etc. can be found in supplemental table ST4. Since it is only necessary to map the paired end reads to the list of all possible 5C primers rather than to the entire genome, a higher percentage of mapped/usable reads can be achieved. We find that > 90% of all paired reads (after Illumina chastity filtering) can be uniquely mapped to a single 5C interaction. For libraries where more than one lane was used to achieve adequate sequence depth, the interactions from each lane were summed to produce the complete 5C interaction dataset. A table summarizing the read depth of each 5C library can be found in supplemental table ST5. Pearson correlation coefficients between the biological replicates can be found in supplemental table ST6.
Detection bias correction
5C experiments involve a number of steps that can locally differ in efficiency, thereby introducing biases in efficiency of detection of pairs of interactions. These biases could affect the efficiency of cross-linking, the efficiency of restriction digestion (related to cross-linking efficiency), the efficiency of ligation (related to fragment size), the efficiency of 5C primers (related to annealing and PCR amplification) and finally the efficiency of DNA sequencing (related to base composition). All these potential biases, several of which are common to other approaches such as chromatin immunoprecipitation (e.g. cross-linking efficiency, PCR amplification, base-composition dependent sequencing efficiency), will impact the overall efficiency with which long-range interactions for a given locus (restriction fragment) can be detected. To determine this overall efficiency of interaction detection we have developed the following general strategy. To determine overall interaction detection efficiency for a given restriction fragment we analyzed the large set of inter-chromosomal interactions that are detected for each fragment. We then defined the overall efficiency of inter-chromosomal interaction detection for a given fragment as the ratio of the average inter-chromosomal signal obtained with that fragment and the average inter-chromosomal signal of all fragments. We then corrected the frequency of each interrogated long-range intra-chromosomal interaction using a correction factor that is the product of the overall efficiency of inter-chromosomal interaction detection for the two interacting fragments.
This procedure will correct for any of the biases in detectability of interactions for a given locus, as listed above, and will also adjust for copy number variation of a locus, which can vary in transformed cell lines such as K562 and HeLa S3 cells, as these factors will also affect the level of inter-chromosomal interactions.
Detailed Primer Filtering
To approximate the relative 5C signal of each restriction fragment interrogated in the experiment we first calculated the average 5C signal for all trans interactions (interactions between different chromosomes). To remove any extreme outliers from the mean calculation, e.g. due to primer failure, we first filtered down the distribution of 5C signals in trans for each restriction fragment by removing all signals beyond the mean +/- three (3) standard deviations. After calculating the filtered mean for each restriction fragment in trans, we calculated the global mean of all inter-chromosomal interaction frequencies. We then calculated a correction factor for each restriction fragment that would normalize its set of trans interactions to the entire set. Once the correction factors were calculated, we then calculated the mean and standard deviation correction factor and flagged any restriction fragments requiring a correction value beyond the mean +/- 1.654 standard deviations. Fragments with a correction factor outside of this limit were flagged for removal since their trans signal is too above/below the expected signal by chance. Here, we assume that any variation in 5C signals detected within the trans space is due to experimentalfactors, differing primer efficiencies, ligation efficiencies etc.
Detailed Primer Correction
Once the outlier fragments are removed from the 5C dataset, we repeat the above described steps to calculate the primer correction values required to normalize the 5C signals for the remaining restriction fragments. Then, for each 5C interaction within an ENCODE region in the dataset, we use the product of the correction factors from the two restrictions fragments involved in the interaction as the final correction factor to apply to the 5C signal. 5C signals are then either increased or decreased by the correction factor to correct for varying signals from the fragments visibility in the trans interaction space.
Peak calling
To detect significant looping interactions from background looping interactions we developed an in-house “5C peak calling” algorithm. We chose to call peaks in each 5C biological replicate separately and then take only the peaks that intersect across replicates as our final list of significant looping interactions.
5C signals represent the three-dimensional contact probabilities between pairs of loci. This relationship inversely scaled with genomic distance. To properly control for the varying genomic distances tested in the 5C dataset, we first determined the relationship of 5C signals over genomic distance. Using a LOWESS smoothing algorithm we find the weighted average and weighted standard deviation of all 5C signals across the range of all interrogated genomic distances. We used the traditional tri-cubic weighting function and an alpha parameter of (0.01) to average the closest 1% of the 5C signals around each genomic distance. We assume the large majority of interactions are not significant looping interactions and thus we interpret this weighted average as the expected 5C signal for any given genomic distance. The 5C signals are then transformed into a z-score by calculating the (obs-exp/stdev). Where the (obs) value is the detected 5C signal for a specific interaction, (exp) is the calculated weighted average of 5C signals for a specific genomic distance and (stdev) is the calculated weighted standard deviation of 5C signals for a specific genomic distance. Once the z-scores have been calculated, the distribution of z-scores are fit to a Weibull distribution. We find that the distribution of z-scores fits to the Weibull distribution with a R2 value of > 0.939 for all cell-lines. P-values can then be mapped to each z-score and then also transformed into q-values for FDR analysis. The ‘qvalue’ package from R (qvalue.cal [siggenes]) was used to compute the q-values for the given set of p-values determined from the fit to the Weibull distribution. Using an FDR cutoff of 1%, we select all 5C interactions with a q-value <= 0.01. We then take the intersection of all significant looping interactions across the two biological replicates as our final list of 5C looping interactions.
Estimation of frequency of false positive looping interactions
We define a false-positive 5C looping interaction as an interaction that is identified in the peak calling approach described above but is due to technical biases or noise and thus does not reflect a biologically meaningful long-range interaction. To estimate the frequency by which our approach detects significant looping interactions by chance we analyzed 5C data obtained for the 3 ENCODE regions that are devoid of genes and are almost devoid of active regulatory elements (according the ENCODE 7-way segmentation6. As described above, we employed an alternating 5C primer design for these regions. As a result long-range interaction profiles are not specifically anchored on any type of genomic element. Combined with the fact that these regions are largely devoid of any functional elements we do not expect to detect any significant looping interactions. Thus, assessment of the number of looping interactions detected for these regions using our peak-calling pipeline provides an empirical approach to estimate the frequency by which significant looping interactions are detected by chance and thus represent false-positives.
Supplementary Figure 1a shows the number of peaks detected in the 3 gene desert ENCODE regions (ENr112, 113 and 313). We used these numbers to estimate the frequency with which we detect significant looping interactions by chance. For GM12878 cells we identified 17 significant looping interactions in both replicates. For these three ENCODE regions we interrogated 7,819 5C interactions. Thus, we estimate that the fraction of interrogated interactions that by chance scores as a significant long-range interaction: (17/7,819)*100 = 0.217%. Assuming that this fraction is the same for the set of 82,545 interrogated TSS-distal element interactions throughout the ENCODE regions we expect to detect (0.217*82,545)/100 = 179 false positive looping interactions. We detected 1,011 significant looping interactions between TSSs and distal sites in GM12878, which leads us to estimate that the false positive detection rate is around 18% [(179/1011)*100]. Similar analyses of 5C data from K562 and HeLa-S3 cells lead to estimates of false positive detection rates of 10% and 12% respectively, corresponding to 147 out 1,434 and 190 out of 1,620 looping interactions possibly being false-positives. We note that these represent upper limit estimates, as some of the significant looping interaction detected in the gene desert regions may be real.
The false positive detection rate for single replicates can be calculated in exactly the same way. We find that the fraction of significant looping interactions detected in one replicate that might be false positives ranges from 20% to 47%. Thus, by requiring interactions to be significant in both replicates we greatly reduce the fraction of false-positive significant interactions (from 20%-47% to 10-18% of the significant interactions). At the same time, many of significant interactions detected in only one replicate are not false-positives, and by excluding this subset of interactions from our analysis we introduce false-negatives. Consistent with our interpretation that many of the peaks seen in only one replicate represent false-negatives, we find that when we take the union of the peaks found in replicate 1 and 2, or analyze the set of peaks obtained with individual replicates separately all the results we presented remain the same: 1) enrichment for distal elements that resemble active gene regulatory elements (Supplementary Figure 1e); 2) Asymmetry of the long-range interaction landscape with a peak around 120 Kb upstream of the TSS (Supplementary Figure 8); 3) Skipping over CTCF sites and 4) Formation of interwoven interaction networks. The fact that all our results can be obtained using different peak sets (e.g. the union of two replicates, or the intersection of the replicates) indicates that our basic findings are robust and not very sensitive to where the threshold for peaks is placed. By focusing exclusively on the set of peaks independently detected in both replicates we are being conservative, only report the strongest signals that display the strongest enrichments for active chromatin features (Supplementary Figure 1) and reduce the false-positive rate. In general we prefer false-negatives over false-positives.
Fragment Annotation
To annotate the interrogated restriction fragments, a variety of ENCODE datasets were used to check for overlap with our list of restriction fragments. A list of all utilized ENCODE datasets can be found in (supplemental table ST7).
Supplementary Material
1
2
Acknowledgments
We thank the University of Massachusetts Medical School Deep Sequencing core for sequencing 5C libraries, and Robert Thurman and John Stamatoyannopoulos for discussion and help with peak calling analysis. We thank Marian Walhout and members of the Dekker lab for discussions. This work was supported by grants from the National Institutes of Health, National Human Genome Research Institute (HG003143 and HG003143-06S1) and a W.M Keck Foundation Distinguished Young scholar in Medical Research award to JD.
Footnotes
Author Contributions
JD conceived the project. AS performed all experiments. BRL designed 5C experiments, and built the data analysis and visualization pipelines. BRL, AS, GJ and JD analyzed the data and wrote the paper.
Supplemental Data
A zip archive containing all supplementary data can be found as (supplementary_data.zip).
The authors declare no competing financial interests.
References
- 1.Dekker J. Gene regulation in the third dimension. Science. 2008;319:1793–1794. doi: 10.1126/science.1152850. [DOI] [PMC free article] [PubMed] [Google Scholar]
- 2.Dostie J, et al. Chromosome Conformation Capture Carbon Copy (5C): A Massively Parallel Solution for Mapping Interactions between Genomic Elements. Genome Res. 2006;16:1299–1309. doi: 10.1101/gr.5571506. [DOI] [PMC free article] [PubMed] [Google Scholar]
- 3.ENCODE-Project-Consortium. A user’s guide to the encyclopedia of DNA elements (ENCODE) PLoS Biol. 2011;9:e1001046. doi: 10.1371/journal.pbio.1001046. [DOI] [PMC free article] [PubMed] [Google Scholar]
- 4.NCP000. An integrated Encyclopedia of DNA elements in the human genome. The ENCODE Project Consortium. Nature. 2012 doi: 10.1038/nature11247. Submitted. [DOI] [PMC free article] [PubMed] [Google Scholar]
- 5.Dekker J, Rippe K, Dekker M, Kleckner N. Capturing Chromosome Conformation. Science. 2002;295:1306–1311. doi: 10.1126/science.1067799. [DOI] [PubMed] [Google Scholar]
- 6.Simonis M, et al. Nuclear organization of active and inactive chromatin domains uncovered by chromosome conformation capture-on-chip (4C) Nat Genet. 2006;38:1348–1354. doi: 10.1038/ng1896. [DOI] [PubMed] [Google Scholar]
- 7.Zhao Z, et al. Circular chromosome conformation capture (4C) uncovers extensive networks of epigenetically regulated intra- and interchromosomal interactions. Nat Genet. 2006;38:1341–1347. doi: 10.1038/ng1891. [DOI] [PubMed] [Google Scholar]
- 8.Miele A, Dekker J. Long-range chromosomal interactions and gene regulation. Mol BioSyst. 2008;4:1046–1057. doi: 10.1039/b803580f. [DOI] [PMC free article] [PubMed] [Google Scholar]
- 9.Fullwood MJ, et al. An oestrogen-receptor-alpha-bound human chromatin interactome. Nature. 2009;462:58–64. doi: 10.1038/nature08497. [DOI] [PMC free article] [PubMed] [Google Scholar]
- 10.Lieberman-Aiden E, et al. Comprehensive mapping of long-range interactions reveals folding principles of the human genome. Science. 2009;326:289–293. doi: 10.1126/science.1181369. [DOI] [PMC free article] [PubMed] [Google Scholar]
- 11.ENCODE-Project-Consortium. Identification and analysis of functional elements in 1% of the human genome by the ENCODE pilot project. Nature. 2007;447:799–816. doi: 10.1038/nature05874. [DOI] [PMC free article] [PubMed] [Google Scholar]
- 12.Gheldof N, Tabuchi TM, Dekker J. The active FMR1 promoter is associated with a large domain of altered chromatin conformation with embedded local histone modifications. Proc Natl Acad Sci U S A. 2006;103:12463–12468. doi: 10.1073/pnas.0605343103. [DOI] [PMC free article] [PubMed] [Google Scholar]
- 13.Palstra RJ, et al. The beta-globin nuclear compartment in development and erythroid differentiation. Nat Genet. 2003;35:190–194. doi: 10.1038/ng1244. [DOI] [PubMed] [Google Scholar]
- 14.Tolhuis B, Palstra RJ, Splinter E, Grosveld F, de Laat W. Looping and Interaction between Hypersensitive Sites in the Active beta-globin Locus. Mol Cell. 2002;10:1453–1465. doi: 10.1016/s1097-2765(02)00781-5. [DOI] [PubMed] [Google Scholar]
- 15.Baù D, et al. The three-dimensional folding of the alpha-globin gene domain reveals formation of chromatin globules. Nat Struct Mol Biol. 2011;18:107–114. doi: 10.1038/nsmb.1936. [DOI] [PMC free article] [PubMed] [Google Scholar]
- 16.Vernimmen D, De Gobbi M, Sloane-Stanley JA, Wood WG, Higgs DR. Long-range chromosomal interactions regulate the timing of the transition between poised and active gene expression. EMBO J. 2007;26:2041–2051. doi: 10.1038/sj.emboj.7601654. [DOI] [PMC free article] [PubMed] [Google Scholar]
- 17.NCP007. The accessible chromatin landscape of the human genome. Stamatoyannopoulos, Crawford and Lieb. Nature. 2012 doi: 10.1038/nature11232. Submitted. [DOI] [PMC free article] [PubMed] [Google Scholar]
- 18.Phillips JE, Corces VG. CTCF: master weaver of the genome. Cell. 2009;137:1194–1211. doi: 10.1016/j.cell.2009.06.001. [DOI] [PMC free article] [PubMed] [Google Scholar]
- 19.Song L, et al. Open chromatin defined by DNaseI and FAIRE identifies regulatory elements that shape cell-type identity. Genome Res. 2011;21:1757–1767. doi: 10.1101/gr.121541.111. [DOI] [PMC free article] [PubMed] [Google Scholar]
- 20.GRCP011. Integrative annotation of chromatin elements from ENCODE data. Hoffman, et al. Genome Research. 2012 doi: 10.1093/nar/gks1284. Submitted. [DOI] [PMC free article] [PubMed] [Google Scholar]
- 21.GRCP001. GENCODE: The reference human genome annotation for the ENCODE project. Harrow, et al. Genome Research. 2012 doi: 10.1101/gr.135350.111. Submitted. [DOI] [PMC free article] [PubMed] [Google Scholar]
- 22.GRCP039. Correlating histone modifications and gene expression. Dong, et al. Genome Research. 2012 Submitted. [Google Scholar]
- 23.Kim TK, et al. Widespread transcription at neuronal activity-regulated enhancers. Nature. 2010;465:182–187. doi: 10.1038/nature09033. [DOI] [PMC free article] [PubMed] [Google Scholar]
- 24.NCP005. Landscape of transcription in human cell lines. Nature. 2012 doi: 10.1038/nature11233. Submitted. [DOI] [PMC free article] [PubMed] [Google Scholar]
- 25.Vavouri T, McEwen GK, Woolfe A, Gilks WR, Elgar G. Defining a genomic radius for long-range enhancer action: duplicated conserved non-coding elements hold the key. Trends Genet. 2006;22:5–10. doi: 10.1016/j.tig.2005.10.005. [DOI] [PubMed] [Google Scholar]
- 26.Wallace JA, Felsenfeld G. We gather together: insulators and genome organization. Curr Opin Genet Dev. 2007;17:400–407. doi: 10.1016/j.gde.2007.08.005. [DOI] [PMC free article] [PubMed] [Google Scholar]
- 27.Kurukuti S, et al. CTCF binding at the H19 imprinting control region mediates maternally inherited higher-order chromatin conformation to restrict enhancer access to Igf2. Proc Natl Acad Sci U S A. 2006;103:10684–10689. doi: 10.1073/pnas.0600326103. [DOI] [PMC free article] [PubMed] [Google Scholar]
- 28.Wendt KS, et al. Cohesin mediates transcriptional insulation by CCCTC-binding factor. Nature. 2008;451:796–801. doi: 10.1038/nature06634. [DOI] [PubMed] [Google Scholar]
- 29.Lajoie BR, van Berkum NL, Sanyal A, Dekker J. My5C: web tools for chromosome conformation capture studies. Nat Methods. 2009;6:690–691. doi: 10.1038/nmeth1009-690. [DOI] [PMC free article] [PubMed] [Google Scholar]
- 5.Dostie J, Dekker J. Mapping networks of physical interactions between genomic elements using 5C technology. Nat Protoc. 2007;2:988–1002. doi: 10.1038/nprot.2007.116. [DOI] [PubMed] [Google Scholar]
Associated Data
This section collects any data citations, data availability statements, or supplementary materials included in this article.
Supplementary Materials
1
2