FoxO3a Directs a Protective Autophagy Program in Hematopoietic Stem Cells (original) (raw)
. Author manuscript; available in PMC: 2013 Aug 21.
Published in final edited form as: Nature. 2013 Feb 6;494(7437):323–327. doi: 10.1038/nature11895
Abstract
Blood production is ensured by rare self-renewing hematopoietic stem cells (HSCs). How HSCs accommodate the diverse cellular stresses associated with their life-long activity remains elusive. Here, we identify autophagy as an essential mechanism protecting HSCs from metabolic stress. We show that HSCs, in contrast to their short-lived myeloid progeny, robustly induce autophagy following ex vivo cytokine withdrawal and in vivo caloric restriction. We demonstrate that FoxO3a is critical to maintain a gene expression program that poise HSCs for rapid induction of autophagy upon starvation. Notably, we find that old HSCs retain an intact FoxO3a-driven pro-autophagy gene program, and that ongoing autophagy is needed to mitigate an energy crisis and allow their survival. Our results demonstrate that autophagy is essential for the life-long maintenance of the HSC compartment and for supporting an old, failing blood system.
Understanding how tissue homeostasis is maintained throughout life is a fundamental question in biology, with critical implications for aging and disease development1. Every cell of the organism must contend with an array of intrinsic and extrinsic stresses, which are exacerbated with age and place enormous functional demands on each tissue. Self-renewing stem cells must constantly counterbalance the deleterious effects of chronic stress by generating new cells to replace those that become damaged or destroyed. This is particularly critical for the maintenance of tissues with high cellular turnover such as the blood system2. While hematopoietic stem cells (HSCs) efficiently give rise to all mature blood cells in young individuals, they often fail or accumulate damage with age, resulting in the development of serious and often fatal diseases including bone marrow (BM) failure syndromes and leukemias3. Whereas much is known about the mechanisms controlling HSC self-renewal and differentiation activities2,4, less is understood about the pathways used by HSCs to combat cellular stress.
Autophagy and apoptosis are two major stress-response pathways that are often co-regulated but elicit opposite cellular outcomes5. Autophagy is a self-catabolic process by which cellular components are sequestered into double-membrane vacuoles, called autophagosomes, and degraded through the lysosomal machinery6. In addition to this “housekeeping” function, autophagy also plays an essential “adaptive” survival role by maintaining nutrient and energy levels during periods of metabolic starvation or stress. In contrast, apoptosis results in the self-elimination of excessively damaged or non-functional cells, which safeguards the overall health of the organism7. Common upstream signaling components regulate both apoptosis and autophagy8,9, and numerous experiments reveal that stresses may trigger either process depending on the cellular context. Inhibition of either pathway by both genetic and chemical means can also result in the activation of the other; that is, blocking apoptosis in cells that normally would die can trigger autophagy and survival, whereas blocking autophagy induction in cells that normally would survive rapidly induces apoptosis.
HSCs, like other cells in the body, have the capacity to commit “suicide” through apoptosis when they become superfluous or irreversibly damaged10. Autophagy has also been shown to control essential processes within the blood system, including immune regulation11, lymphocyte survival12,13, erythroid cell maturation14,15 and maintenance of fetal HSCs16,17. However, as there are major differences between fetal and adult HSCs, particularly with respect to cell cycle status18, it remains to be established whether autophagy plays a specific role in protecting quiescent adult HSCs.
Autophagy induction in HSCs
To determine whether hematopoietic stem and progenitor cells can induce autophagy, we isolated HSCs (Lin−/cKit+/Sca1+/Flk2−/CD48−/CD150+) and granulocyte/macrophage progenitors (GMPs: Lin−/cKit+/Sca1−/CD34+/FcγR+) from the BM of Gfp-Lc3 transgenic mice19 (Suppl. Fig. 1a). We monitored autophagy induction ex vivo upon culture with or without cytokines by assaying the formation and turnover of punctate GFP-LC3, indicative of autophagosome formation and autolysosome degradation, respectively20. We first confirmed that cytokine withdrawal induced a metabolic stress as evidenced by decreased glucose uptake in HSCs and GMPs cultured without cytokines (Suppl. Fig. 1b,c). We also treated HSCs and GMPs with the lysosomal inhibitor bafilomycin A (BafA) to block autolysosome destruction and trap the resulting punctate GFP-LC3. While GFP-LC3 punctate were found in GMPs upon culture with cytokines, autophagosome formation was not further enhanced by cytokine withdrawal (Fig. 1a). In contrast, HSCs displayed no detectable punctate GFP-LC3 when cultured in the presence of cytokines, but exhibited robust puncta formation following cytokine withdrawal (Fig. 1b). We independently validated these observations using transmission electron microscopy20. While freshly isolated GMPs readily displayed autophagic vacuoles (Suppl. Fig. 2a), we found no signs of autophagy in freshly isolated HSCs and observed autophagic vacuoles only upon starvation (Fig. 1c, Suppl. Fig. 2b). We then used flow cytometry21 to measure GFP-LC3 fluorescence levels with or without BafA, which allows for the quantification of autophagy flux in HSCs and GMPs (Suppl. Fig. 3a). As expected, HSCs showed a clear loss in GFP-LC3 levels when cultured without cytokines, with minimal changes upon culture with cytokines (Fig. 1d). In contrast, GMPs had a similar level of GFP-LC3 loss when cultured with or without cytokines (Suppl. Fig. 3b). Consistent with these analyses, we also found that only starved HSCs, and not starved GMPs, had decreased intracellular p62 protein levels20 (Suppl. Fig. 3c). Finally, we deprived Gfp-Lc3 mice of food for 24h as caloric restriction has been shown to potently induce autophagy19. As expected, we observed a significant decrease in GFP-LC3 levels in HSCs, but not myeloid progenitors, hence confirming autophagy induction in the HSC compartment following in vivo starvation (Fig. 1e, Suppl. Fig. 3d). Collectively, these results demonstrate that only long-lived HSCs, in contrast to their short-lived myeloid progeny, are able to mount a robust autophagic response upon metabolic stress.
Figure 1. HSCs induce autophagy following metabolic stress.
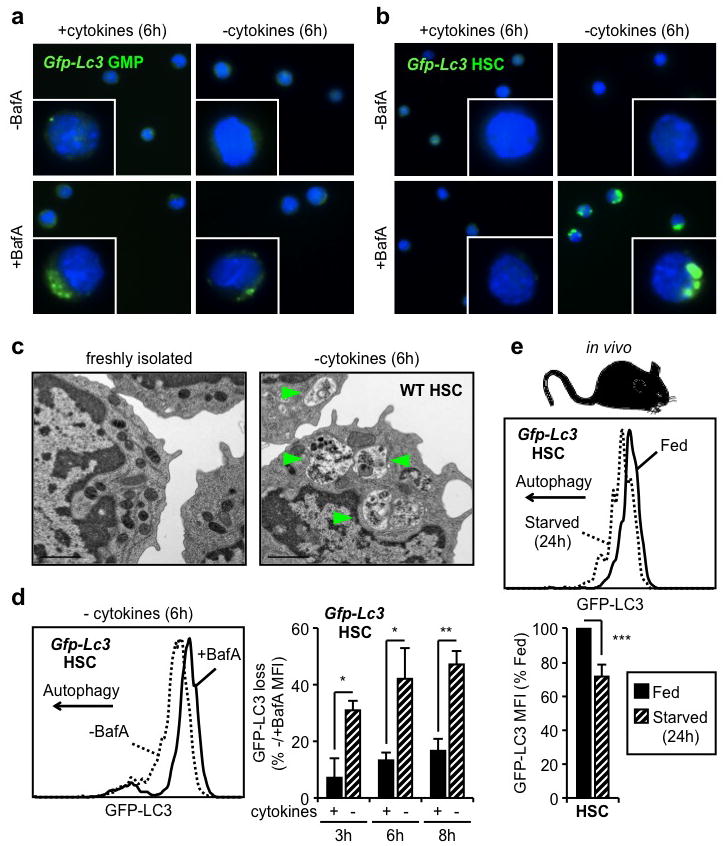
a, b, Fluorescent microscopy of cultured Gfp-Lc3 GMPs (a) and HSCs (b). c, Electron microscopy images of WT HSCs. Arrowheads indicate autophagic vesicles. d, GFP-LC3 loss in cultured Gfp-Lc3 HSCs (n = 3). Results are expressed as percentage of GFP-LC3 MFI in -BafA compared to +BafA conditions. e, GFP-LC3 levels in HSCs of fed and starved Gfp-Lc3 mice (n = 3). Results are expressed as percent of GFP-LC3 MFI in fed mice. Data are means ± s.d. *P ≤ 0.05, **P ≤ 0.01, ***P ≤ 0.001.
Protective function of autophagy
Tissue culture studies indicate that autophagy provides starved cells with a window of survival, particularly when apoptosis is blocked8. To assess whether autophagy allows HSCs to survive conditions of metabolic stress, we cultured HSCs ex vivo with or without cytokines and BafA, and monitored apoptosis levels using a cleaved-caspase 3/7 based luminescence assay. Although cytokines withdrawal was sufficient to promote low-level caspase activation, inhibiting autophagy with BafA both accelerated the onset and increased the level of apoptosis in starved HSCs (Fig. 2a). We functionally confirmed these results by transplanting HSCs that were cultured for 12h with or without cytokines and BafA (Suppl. Fig. 4a). As expected, starved HSCs had significantly diminished reconstitution capability and BafA-mediated blockade of autophagy resulted in a further reduction in the number of engrafting HSCs. To demonstrate that autophagy is directly involved in protecting HSCs, we generated mice with hematopoietic-specific deletion of the essential autophagy machinery component, Atg12 (Atg12flox/flox::Mx1-Cre, Atg12cKO)22 (Suppl. Fig. 4b,c). As expected, we observed a significant increase in caspase activation in starved Atg12cKO HSCs, which was comparable to that elicited by BafA (Fig. 2b). In contrast, we found no evidence of a protective autophagic response in the apoptosis-prone GMPs23 as neither _Atg12_-deletion nor BafA treatment led to an additional increase in caspase activation above their already elevated basal levels (Fig. 2b). To further confirm that autophagy protects starved HSCs from undergoing apoptosis, we generated mice with hematopoietic-specific deletion of the apoptotic mediators Bak and Bax (Bak−/−::Baxflox/flox::Mx1-Cre, BakBaxcKO)24 (Suppl. Fig. 4d). We found that BakBaxcKO HSCs had no caspase activation in any of the tested culture conditions (Suppl. Fig. 4e), hence validating our ex vivo apoptosis assay and demonstrating that the mitochondrial apoptotic pathway is responsible for the death of starved HSCs. We also deprived Atg12cKO mice of food for 24h and observed a significant loss of phenotypic HSCs, which was not observed in control mice (Fig. 2d). Although we were unable to formally document increased apoptosis in starved Atg12cKO HSCs (data not shown), our results support an essential role for autophagy in protecting HSCs during caloric restriction in vivo. Finally, we confirmed that HSCs, which underwent robust autophagy induction upon either ex vivo cytokine withdrawal or in vivo caloric restriction, were unchanged in their differentiation properties as measured by CFU-assays or lineage reconstitution upon transplantation (Suppl. Fig 5). Collectively, these data demonstrate that HSCs utilize autophagy to prevent starvation-induced apoptosis and maintain their functionality.
Figure 2. Autophagy protects HSCs from starvation-induced apoptosis.
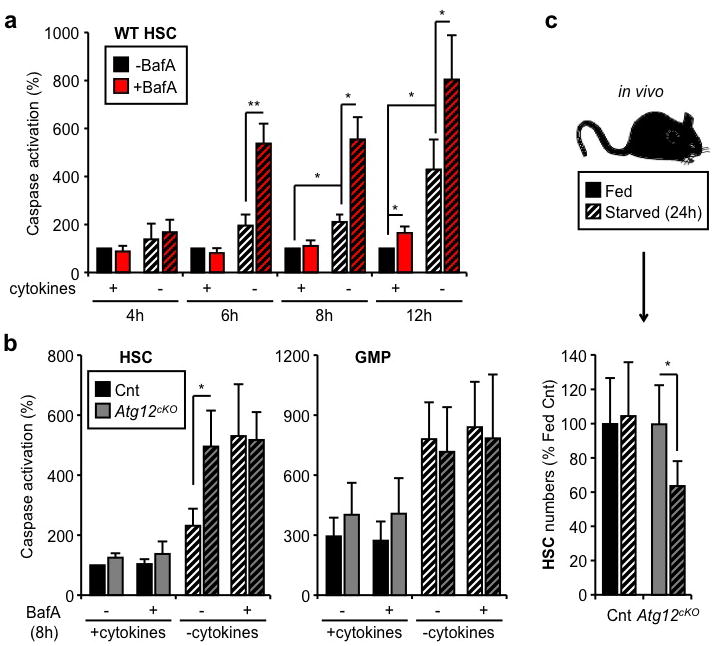
a, Apoptosis levels in cultured WT HSCs (n = 3–5). Results are expressed as percent caspase activation compared to +cytokines conditions. b, Apoptosis levels in cultured control (Cnt) and Atg12cKO HSCs and GMPs (n = 3). Results are expressed as percent caspase activation compared to +cytokines Cnt HSCs (100%). c, Absolute number of HSCs in fed and starved Cnt and Atg12cKO mice (n = 4–8 mice per group). Results are expressed as percent of HSCs in fed mice. Data are means ± s.d. Hatching indicates starved conditions. *P ≤ 0.05, **P ≤ 0.01.
Regulation of autophagy
To delineate why HSCs are competent for autophagy induction, while GMPs are not, we first measured the activation status of mammalian target of rapamycin complex 1 (mTORC1), the principal pathway restricting autophagy induction6. However, we did not observe differences in mTORC1 activation levels between HSCs and myeloid progenitors using intracellular flow cytometry staining for either phospho-mTOR, or its direct target phospho-S6 (Suppl. Fig. 6a). We also did not find any major differences in phospho-S6 levels in HSCs and GMPs cultured for 6h with cytokines, and confirmed that both were sensitive to rapamycin-mediated mTORC1 inhibition (Suppl. Fig 6b). These results indicate that the inability of GMPs to induce autophagy upon metabolic stress is not secondary to elevated basal levels of mTORC1 activation. We then used a commercial autophagy PCR array to interrogate the status of the autophagy machinery in HSCs, GMPs and terminally differentiated granulocytes (Gr1+/Mac1+) (Suppl. Fig. 7a). Interestingly, granulocytes had a clear decrease in the expression of nearly all autophagy genes when compared to GMPs, suggesting that mature myeloid cells lack the autophagy machinery needed to induce autophagic flux (Suppl. Fig. 7b, Suppl. Table 1). Moreover, we found that expression of the core autophagy machinery components was largely unchanged between HSCs and GMPs; nevertheless, many key upstream regulators and all the Atg8 homologs, which are turned over during autophagic proteolysis6, were specifically upregulated in HSCs (Fig. 3a, Suppl. Table 2). We extracted a pro-autophagic gene expression signature, and directly confirmed by qRT-PCR their higher expression in HSCs compared to GMPs (Fig. 3b). Collectively, these results support the idea that long-lived HSCs are molecularly wired to mount a protective survival autophagy response upon metabolic stress, while their short-lived myeloid progeny are not.
Figure 3. FoxO3a poises HSCs for rapid autophagy induction.
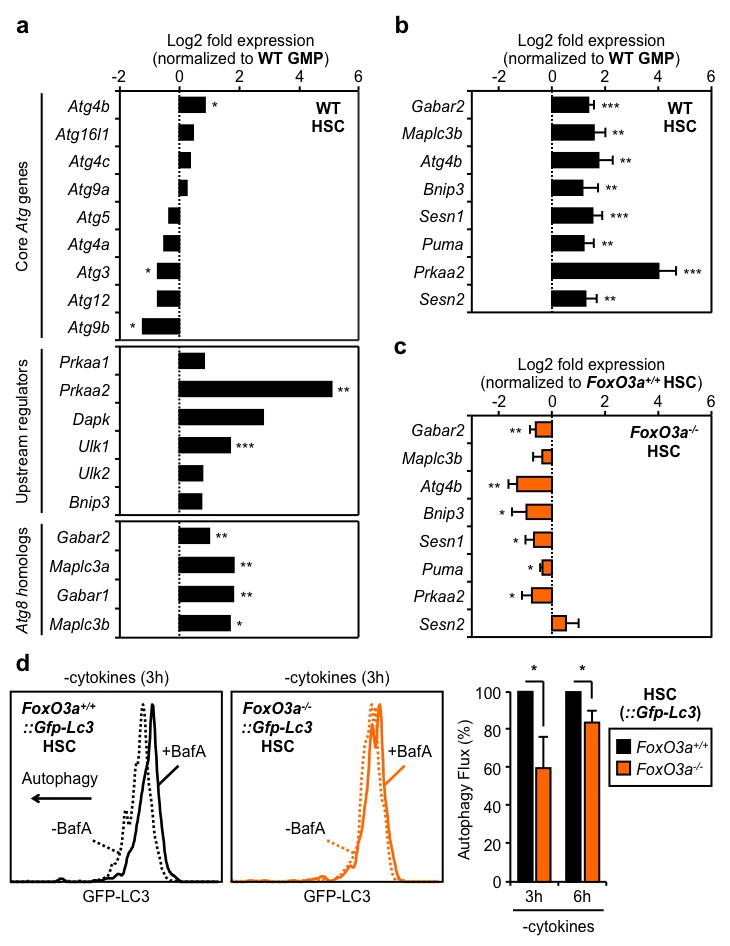
a, Status of the autophagy machinery in WT HSCs (n = 3). Results are expressed as log2 fold expression compared to WT GMPs (set to 0). b, c, qRT-PCR analyses of pro-autophagic genes in WT (b) and FoxO3a−/− (c) HSCs (n = 3). Results are expressed as log2 fold expression compared to WT GMPs (b) or FoxO3a+/+ HSCs (c) (set to 0). d, Autophagy flux in cultured FoxO3a−/−::Gfp-Lc3 HSCs (n = 3). Results are expressed as percent GFP-LC3 MFI in -BafA vs. +BafA conditions, and normalized to FoxO3a+/+−::Gfp-Lc3 HSCs. Data are means ± s.d. *P ≤ 0.05, **P ≤ 0.01, ***P ≤ 0.001.
FoxO3a-driven pro-autophagy gene program
We next searched for specific transcriptional regulators that could maintain high expression of pro-autophagy genes in HSCs. We identified FoxO3a and p53 as two putative candidates (Suppl. Fig. 8), which can trigger both autophagy and apoptosis through induction of a largely overlapping set of targets25,26. We already showed that HSCs and GMPs expressed p53 at similar levels23, and confirmed here that only HSCs had transcriptionally active nuclear FoxO3a (Suppl. Fig. 9a). In addition, we found higher expression levels of FoxO3a, and other family members, in HSCs compared to GMPs (Suppl. Fig. 9b). Remarkably, FoxO3a deletion led to a striking downregulation of the pro-autophagic program, with 6 of our identified targets showing significantly reduced expression in FoxO3a−/− HSCs (Fig. 3c). We then crossed FoxO3a−/− mice with Gfp-Lc3 transgenic mice to assess how the lack of FoxO3a affected the ability of HSCs to mount an adaptive autophagy response. We observed a nearly two-fold increase in the basal levels of GFP-LC3 in FoxO3a−/−::Gfp-Lc3 HSCs, consistent with constitutively lower levels of autophagic flux compared to control HSCs (Suppl. Fig. 9c). Moreover, we found a striking reduction in autophagy induction in FoxO3a−/−::Gfp-Lc3 HSCs, as evidenced by the delayed loss of GFP-LC3 compared to control HSCs following 3h and 6h culture without cytokines (Fig. 3d, Suppl. Fig. 9d). In contrast, we did not find any significant changes in the expression level of pro-autophagic genes in Trp53−/− HSCs (Suppl. Fig. 10a), nor in the basal GFP-LC3 levels or loss of GFP-LC3 upon cytokine withdrawal in Trp53−/−::Gfp-Lc3 HSCs (Suppl. Fig. 10b,c). Furthermore, we generated double knockout FoxO3a−/−::p53−/−::Gfp-Lc3 (DKO::Gfp-Lc3) mice and did not observe any additional increase in the basal GFP-LC3 levels or further delay in autophagy induction following cytokine withdrawal compared to FoxO3a−/−::Gfp-Lc3 HSCs (Suppl. Fig. 11a,b). These results rule out a major role for the p53 pathway for autophagy induction in HSCs, and suggest that functional compensation by other FoxO family members27 may account for the delayed autophagic response occurring in the absence of FoxO3a. Collectively, these experiments demonstrate that FoxO3a maintains a pro-autophagy gene expression program that specifically poises HSCs to rapidly mount a protective autophagic response upon metabolic stress.
Autophagy in old HSCs
Decreased capacity to undergo autophagy has been proposed to be associated with aging1,28, and functional deficiencies in old HSCs underlie many of the blood pathologies associated with old age3. Thus, we investigated whether HSCs isolated from old mice (24 months of age) displayed reduced autophagic potential compared to HSCs isolated from young mice (6–12 weeks of age) (Suppl. Fig. 12a). Unexpectedly, electron microscopy analyses of freshly isolated old wild type HSCs revealed the presence of numerous autophagic vacuoles, which were absent in young HSCs (Fig. 4). In addition, old Gfp-Lc3 HSCs, but not myeloid progenitors, had decreased basal levels of GFP-LC3 and punctate GFP-LC3 were detectable even in the presence of cytokines in BafA-treated old Gfp-Lc3 HSCs (Suppl. Fig. 12b, 13a). Furthermore, like young Gfp-Lc3 HSCs, old Gfp-Lc3 HSCs still underwent robust autophagic flux upon 6h cytokine withdrawal ex vivo (Suppl. Fig. 13b). It was previously shown that old HSCs had elevated levels of activated mTORC129 that should, in principle, prevent such induction of autophagy. However, our analyses of phospho-mTOR and phospho-S6 levels revealed no significant differences in mTORC1 activity between young and old HSCs (Suppl. Fig. 14a). Collectively, these results indicate that old HSCs have higher basal autophagic flux than young HSCs, but retain their ability to induce autophagy upon metabolic stress.
Figure 4. Ongoing autophagy in old HSCs.
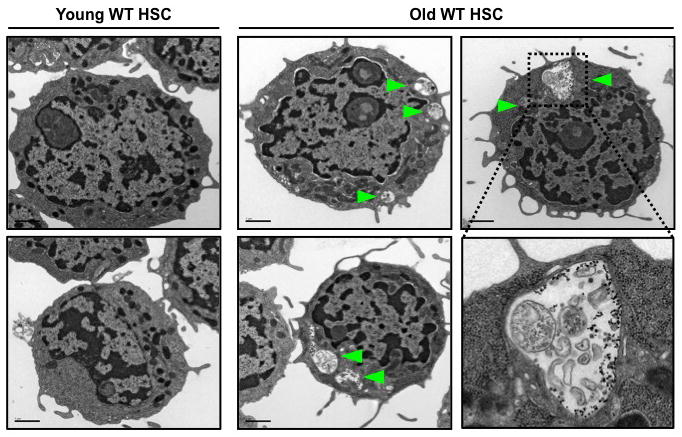
Electron microscopy images of young and old HSCs. Arrowheads indicate autophagic vesicles.
To determine whether old HSCs are similarly poised to induce autophagy as their younger counterparts, we next investigated the expression status of their autophagy machinery (Suppl. Fig. 14b, Table 3). We found that old HSCs had unchanged expression of all major components of the core autophagy machinery, upstream regulators, and Atg8 homologs compared to young HSCs. We also confirmed that old HSCs still had nuclear FoxO3a (Suppl. Fig. 14c) and maintained expression of direct FoxO3a pro-autophagy targets (Fig. 5a). Although expression of the p53 co-regulated Puma, Prkaa2 and Sesn2 targets was significantly reduced in old HSCs, it did not reflect a global decrease in p53 activity since expression of other known p53 targets were either unchanged or even increased (Suppl. Fig. 14d). Although old HSCs displayed overall lower levels of apoptosis, treatment with BafA significantly increased caspase activation to a level that eventually reached the apoptotic response elicited in starved young HSCs, albeit at a later time point (Fig. 5b, Suppl. Fig. 15a). Altogether, these results demonstrate that autophagy induction provides a similar survival benefit to young and old HSCs. To determine the function of basal autophagy flux in old HSCs, we then plated young and old HSCs in methylcellulose containing BafA (Suppl. Fig. 15b). Remarkably, BafA-mediated blockade of autophagy resulted in the specific loss of old HSCs cloning efficiency, with no effect on young HSCs, which indicate that ongoing autophagy is actually required for the survival of old HSCs. Since a major function of autophagy is to mitigate oxidative stress via the removal of toxic proteins and damaged mitochondria6, we used the fluorescence-based DCFDA probe to measure reactive oxygen species (ROS) levels. However, we found similar ROS levels at steady state and an equivalent increase upon BafA-mediated blockade of autophagy in both young and old HSCs (Suppl. Fig. 15c). We next used the fluorescently labeled deoxyglucose analog (2-NBD glucose) to directly compare the ability of young and old HSCs to uptake glucose in culture conditions with cytokines (Fig. 5c, Suppl. Fig. 15d). Strikingly, we found that old HSCs had significantly attenuated 2-NBD glucose uptake compared to young HSCs, suggesting that impaired nutrient uptake could be a major driver for the heightened autophagy flux in old HSCs. This would be consistent with the recently reported decrease in cytokine availability in the old BM microenvironment30. To assess whether old HSCs need autophagy to maintain energy levels, we then co-cultured old and young HSCs for 32h with or without BafA and methylpyruvate (M-Pyr), a cell permeable form of pyruvate that alleviates the need for nutrient uptake to maintain ATP production31. Remarkably, incubation with M-Pyr significantly rescued the decreased plating efficiency of old HSCs observed upon BafA-mediated blockade of autophagy (Fig. 5d). Collectively, these results demonstrate that old HSCs do not have reduced autophagy potential but, in fact, rely upon autophagy for their continued survival in response to reduced nutrient uptake and energy production.
Figure 5. Ongoing autophagy is essential for the continued survival of old HSCs.
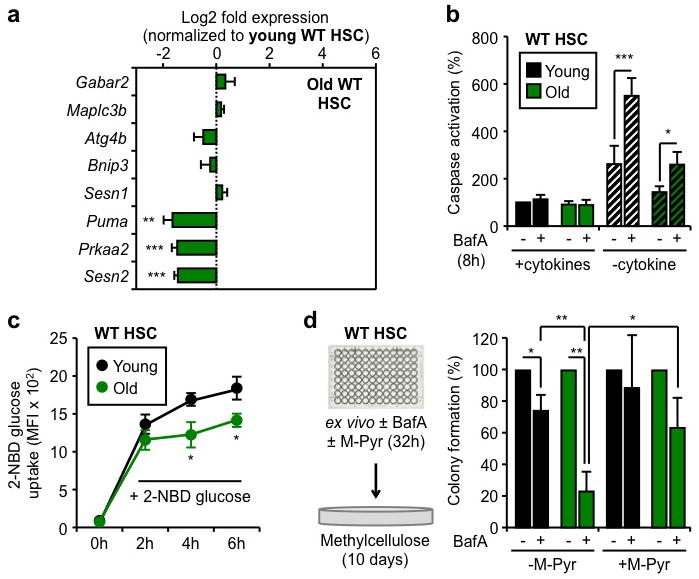
a, qRT-PCR analyses of pro-autophagic genes in old HSCs (n = 3–5). Results are expressed as log2 fold expression compared to young HSCs (set to 0). b, Apoptosis levels in cultured young and old HSCs (n = 3). Results are expressed as percent caspase activation compared to +cytokines young HSCs. Hatching indicates –cytokines conditions. c, 2-NBD glucose uptake in cultured young and old HSCs (n = 3). d, Percent colony formation in young and old WT HSCs cultured for 32h ± BafA and methylpyruvate (M-Pyr) (n = 3). Colonies were counted at day 10 and normalized to -BafA conditions. Data are means ± s.d. *P ≤ 0.05, **P ≤ 0.01, ***P ≤ 0.001.
Discussion
Here, we show that autophagy is essential to protect adult HSCs from metabolic stress and, likely, permits the HSC compartment to withstand the growth factor fluctuations and nutrient deprivations that naturally occur in the BM microenvironment, especially following hematopoietic injury32. We establish that HSCs are uniquely wired to mount an autophagy-mediated cytoprotective response due to the expression of a FoxO3a-driven pro-autophagy gene expression program that poises them for rapid induction of autophagy following metabolic stress. Our results are consistent with the hematopoietic phenotype of FoxO3a−/− mice33, which have a diminished HSC pool size later in life, and indicate that in the absence of robust autophagic capacity, HSCs are no longer fully protected in vivo.
Our work also challenges the prevailing view in the aging field that impaired autophagy is one of the principal determinants of cellular aging28. Instead, we found that the regulatory pathways that poise HSCs for rapid induction of autophagy remain intact during physiological aging, and that ongoing autophagy is essential for the continued survival of old HSCs. In fact, old HSCs have been shown to accumulate DNA damage and to often lose their functionality, which are believed to be at the root of the elevated incidence of blood disorders in the elderly3. Here, we show that old HSCs also have decreased capacity for nutrient uptake, potentially due to the untoward effects of an aged BM environment30, and thus rely on ongoing autophagy to maintain their energy levels and survive in these cytokine-poor conditions. This finding demonstrates that autophagy directly protects the old, albeit inefficient, blood system. It will now be interesting to determine whether autophagy also indirectly contributes to the development of age-related blood diseases by allowing the survival of damaged, dysfunctional or transformed old HSCs that would routinely be eliminated via apoptosis in younger animals.
Online Methods
Mice
Young (6–12 weeks of age) and old (20–24 months of age) wild type (WT) C57Bl/6 mice were either bred and aged in house, or purchased from the NIA aged rodent colonies. FoxO3a−/−(FVB/N)34, Trp53−/− (FVB/N)35, Bak−/−::Baxflox/flox (C57Bl/6)36, Mx1-Cre (C57Bl/6)37 and Gfp-Lc3 (C57Bl/6)19 mice have been described previously. Trp53−/−::Gfp-Lc3 and FoxO3a−/−::Gfp-Lc3 mice were generated on a mixed FVB/N and C57Bl/6 background. The description of Atg12flox/flox mice will be provided in a separate publication (R.M. and J.D., in preparation). For _Mx1-Cre-_mediated deletion, 4 week old Mx1-Cre::Atg12flox/flox and Mx1-Cre::Bak−/−::Baxflox/flox mice were injected intraperitoneal 3x at two-day intervals with 250μg of polyI/C (GE Healthcare) in 200μl PBS. PolyI/C-injected Atg12flox/flox and Bak−/−::Baxflox/flox mice were used as controls. For transplantations experiments, 8–12 week old CD45.1 C57Bl/6 recipient mice were lethally irradiated (11Gy, delivered in split dose 3h apart) and injected retro-orbitally with 500 purified CD45.2 HSCs (with or without ex vivo culture) delivered with 300,000 Sca-1-depleted helper CD45.1 BM cells. Transplanted mice were given antibiotic-containing water for at least 4 weeks post-irradiation. For in vivo starvation experiments, mice were deprived from food for 24h while keeping free access to water. All animal experiments were performed in accordance with UCSF IACUC approved protocols.
Flow cytometry
Granulocytes (Mac-1+/Gr-1+) were isolated from unfractionated BM using Mac-1-PE-Cy7 (eBioscience, 25-0112-82) and Gr-1-PB (eBioscience, 57-5931-82) antibodies. Enrichment and cell staining procedures for isolating HSCs (Lin−/cKit+/Sca1+/Flk2−/CD48−/CD150+) and GMPs (Lin−/cKit+/Sca1−/CD34+/FcγR+) from c-Kit-enriched BM (BM) were performed as described23,38. For wild type mice, HSC and GMPs were stained together using un-conjugated lineage antibodies (Gr-1, Mac1, B220, CD3, CD4, CD5, CD8, Ter-119, all prepared by the UCSF Hybridoma Core Facility) and goat anti-rat-PE-Cy5 (Invitrogen, A10691), c-Kit-APC-eFluor 780 (eBioscience, 47-1171-82), Sca-1-PB (BioLegend, 108120), Flk2-Bio (eBioscience, 13-1351-82), CD48-Alexa Fluor 647 (BioLegend, 103416), CD150-PE (BioLegend, 115904), FcγR-PerCP-eFluor 710 (eBioscience, 46-0161-82), CD34-FITC (eBioscience, 11-0341-85) and SA-PE-Cy7 (eBioscience, 25-4317-82) antibodies. For Gfp-Lc3 mice, HSCs and GMPs were stained separately omitting FcγR and CD34 for HSC isolation, and using CD34-Bio (BioLegend, 119304) and omitting Flk2 for GMP isolation. For monitoring autophagy induction in Gfp-Lc3 mice, directly conjugated lineage CD3-PE-Cy5 (eBioscience, 15-0031), CD4-PE-Cy5 (eBioscience, 15-0041-82), CD5-PE-Cy5 (BioLegend, 100610), CD8-PE-Cy5 (eBiosciences,15-0081-82), Mac1-PE-Cy5 (eBiosciences,15-0112-82), Gr1-PE-Cy5 (eBioscience, 15-5931-82), B220-PE-Cy5 (eBioscience, 15-0452-82), Terr119-PE-Cy5 (eBioscience, 15-5921-82) and Sca1-PE-Cy7 (BioLegend, 108113) antibodies were used while Flk2 was omitted from the staining. Stained cells were re-suspended for final analysis in Hanks Buffered Salt Solution (HBSS) with 2% heat-inactivated fetal calf serum (FCS) and 1 μg/ml propidium iodide for dead cell exclusion. For intracellular staining29, Sca1-PE-Cy7 was used and Flk2, FcγR and CD34 were omitted from the staining. Stained cells were washed in PBS, fixed in Cytofix/Cytoperm buffer (BD Biosciences) for 2h at 4°C, washed in PermWash (BD Biosciences), permeabilized with CytoPerm Plus (BD Biosciences) for 10 min at room temperature (RT), re-fixed in Cytofix/Cytoperm buffer for 10 min at 4°C, washed in PermWash and incubated in PermWash for overnight at 4°C with the following primary antibodies: rabbit anti-phospho-mTOR (Cell Signaling, 5536), rabbit anti-phospho-S6-A488 (Cell Signaling, 4854), guinea pig anti-p62 (Progen, GP62-C), rabbit IgG control isotype (Cell Signaling, 3900S) or rabbit IgG-A488 conjugate (Cell Signaling, 2975). Cells were then washed in PermWash and eventually incubated with anti-rabbit A488 (Invitrogen, A21206) or anti-guinea pig A488 (Invitrogen, A11073) secondary antibodies in PermWash for 2h at 4°C and finally re-suspended in PBS/2% FCS for analysis. Peripheral blood was obtained from retro-orbital bleeding and collected in 4 ml of ACK (150 mM NH4Cl/10 mM KHCO3) containing 10 mM EDTA. Donor and recipient cells were distinguished by expression of different allelic forms of CD45 (CD45.1-FITC, eBioscience, 11-0454-85 vs. CD45.2-PE, eBioscience, 12-0453) and multilineage reconstitution was assessed by expression of myeloid (Mac-1-PE-cy7, eBioscience, 25-0112-82; Gr-1-eFluor450, eBioscience, 48-5931-82), B cells (B220-APC-eFluor780, eBioscience, 47-0452-82) and T cells (CD3-A647, eBioscience, 51-0032-82). Cell isolation was performed on a FACS ARIAII (Becton Dickinson), using double sorting to ensure maximum purity, and cell analysis on a FACS LSRII (Becton Dickinson).
Cell culture
Cells were cultured ex vivo in StemPro-34 medium (Invitrogen) supplemented with L-Glutamine (2 mM), Penicillin (50 U/ml)/Streptomycin (50 μg/ml), and containing or not the following cytokines (all from PeproTech): IL-3 (10 ng/ml), GM-CSF (10 ng/ml), SCF (25 ng/ml), IL-11 (25 ng/ml), Flt-3L (25 ng/ml), Tpo (25 ng/ml) and Epo (4 U/ml). Bafilomycin A (BafA, 5 nM, Sigma), methylpyruvate (M-Pyr, 10 mM, Sigma), rapamycin (Rapa, 20 μM, EMD Millipore) or appropriate vehicles (DMSO for BafA and Rapa) were added to the media as indicated. All cultures were performed at 37°C in a 5%CO2 water jacket incubator (Themo Scientific). For apoptosis assays, HSCs and GMPs were sorted directly into 384-well solid white luminescence plates (400 cells per well, triplicate wells per conditions) containing 40μl of media (± cytokine and BafA). At given time points, 40μl of Caspase-Glo 3/7 (Promega) was added to each well and the plates were shaken at 300 rpm for 30 sec, incubated for 45 min at RT and read on a luminometer (Synergy2, BioTek) to obtain relative luciferase units (RLU). For each experimental condition, the percent caspase activation was calculated as follow using the average RLU obtained from triplicate measurements: [test sample RLU]/([HSC +cytokines control sample RLU] × 100). For colony formation assays, HSCs (100 cells/ml per 3 cm dish, 1 cell/100 μl per well of 96-well plates) were cultured in methylcellulose (Stem Cell Technologies, M3231) supplemented with L-Glutamine, Penicillin/Streptomycin and all the cytokines described above (± BafA when indicated). Colonies (> 30 cells) were counted after 10 days of culture. For M-Pyr rescue experiments, HSCs (100 cells per well, triplicate wells per conditions) were cultured for 32h in media containing cytokines (± BafA and M-Pyr) and then each well was plated in one 3 cm dish of methylcellulose devoid of BafA and M-Pyr. For measurement of ROS levels27, HSCs (2000 cells per well, triplicate wells per conditions) were cultured for 24h in media (± cytokines and BafA). Cells were then washed with HBSS, incubated 15 min at 37°C with dichlorofluorescin diacetate (DCFDA, 10 μM, Invitrogen) or anhydrous DMSO vehicle, washed with HBSS and directly analyzed by flow cytometry for DCFDA fluorescence in the FITC channel. For measurement of nutrient uptake39, HSCs (2000 cells per well, triplicate wells per conditions) were cultured for the indicated times in cytokine-containing media ± 2-(n-(7-nitrobenz-2-oxa-1,3-diazol-4-yl)amino)-2-deoxyglucose (2-NBD glucose, 100 μM, Invitrogen). Cells were than washed once in HBSS and analyzed by flow cytometry for 2-NBD glucose fluorescence in the FITC channel.
Gene expression analyses
Specific pre-tested qRT-PCR primers (Gabar2, Maplc3b, Atg4b, Bnip3, Sesn1, Prkaa2, Sesn2, Dram) and mouse Autophagy RT2 Profiler PCR Arrays were purchased from SABiosciences. Other qRT-PCR primer sequences are available upon request. Total RNA was isolated from 10,000–20,000 cells sorted into directly TRIzol-LS (Invitrogen) according to the manufacturer’s protocol. For qRT-PCR, RNA was treated with DNAseI and reverse-transcribed using SuperScript III kit (Invitrogen). Runs were performed on a 7900HT Fast Real-Time PCR System (Applied Biosystems) using the SYBR Green reagents (Applied Biosystems) and the cDNA equivalent of 200 cells per reaction. Values were normalized to β-actin expression. For PCR array, RNA was further purified using Arcturus PicoPure RNA Isolation Kit (Applied Biosystems), which included an on-column DNAseI digestion. RNA concentration was measured on a bioanalyzer chip and 5 ng of starting RNA was used per sample. Arrays were performed according to the manufacturer’s protocol (SABiosciences), with all cDNA samples undergoing pre-amplification (12 cycles) for pathway specific genes. Runs were performed on the same 7900HT Fast Real-Time PCR System and data were analyzed using the SABiosciences software. Values were normalized to β-actin expression.
Punctate GFP-LC3 and immunofluorescence staining
Cells were sorted directly onto poly-lysine coated slides (500–2,000 cells per slide), and fixed in PBS/4% PFA for 10 min at RT and treated as follow. For imaging punctate GFP-LC3, slides were directly mounted using ProLong Gold antifade reagent containing 1μg/ml DAPI (Life Technologies) and imaged on a Zeiss Axiovert 200 microscope (63x, 1.4NA objective) driven by Metamorph (v6.0) software (Molecular Devices). For FoxO3a immunofluorescence staining, slides were permeabilized in PBS/0.15% Triton-X100 for 2 min at RT and blocked in PBS/1% BSA for overnight at 4°C. Slides were then incubated in PBS/1% BSA with a rabbit anti-FoxO3a (Millipore, 07-1719) for 1h at 37°C, washed 3x in PBS and incubated in PBS/1% BSA with an A594-conjugated goat anti-rabbit secondary antibody (Life Technologies, A-11037) for 1h at 37°C. Slides were then washed 3x in PBS and mounted using VectaShield (Vector Laboratories) containing 1μg/ml DAPI. Cells were imaged on a SP5 Leica Upright Confocal Microscope (100x objective) and images were processed using Velocity software (v.4.4, Improvision, Waltham, MA, USA).
Electron Microscopy
Cells (50,000–100,000 per condition) were pelleted for 5 min at 4°C at 600-x g, fixed on ice for 30 min in 0.1M NaCacodylate, pH 7.4, containing 2% Glutaraldehyde and 1% PFA, and pelleted at 3000 g for 10 min at 4°C. Samples were then submitted to the Gladstone Institute (UCSF) Electron Microscopy Core Facility for standard transmission electron microscopy ultrastructural analyses.
Statistics
All data were expressed as mean ± standard deviation (s.d.). P values were generated using two-tailed student’s t-test (*P ≤ 0.05, **P ≤ 0.01, ***P ≤ 0.001).
Supplementary Material
1
Acknowledgments
We thank Dr. A. Brunet (Stanford) for FoxO3a−/− mice, Dr. S. Oakes (UCSF) for Bak−/−::Baxflox/flox mice, Dr. N. Mizushima (Tokyo Medical and Dental University) for Gfp-Lc3 transgenic mice, Jinny Wong (Gladstone Institute at UCSF) for electron microscopy analyses, Michael Kissner for management of our Flow Cytometry Core Facility, and all members of the Passegué, particularly Dr. E. Pietras, and Debnath laboratories for critical insights and suggestions. M.R.W. is an LLS Special Fellow. This work was supported by a Culpepper Scholar Award (Partnership for Cures) and NIH grant CA126792 to J.D., and a CIRM New Faculty Award and NIH grant HL092471 to E.P.
Footnotes
Authors Contributions. M.R.W., M.B., J.F., D.R and T.G. performed all of the experiments. R.M. and J.D. generated the Atg12flox/flox mice. M.R.W., M.B., J.D. and E.P. designed the experiments and interpreted the results. M.R.W. and E.P. wrote the manuscript.
Authors Information. The authors declare no competing financial interests. Correspondence and requests for materials should be addressed to E.P. (PassegueE@stemcell.ucsf.edu).
Supplementary Information. See accompanying document
References
- 1.Rando TA. Stem cells, ageing and the quest for immortality. Nature. 2006;441:1080–1086. doi: 10.1038/nature04958. [DOI] [PubMed] [Google Scholar]
- 2.Orkin SH, Zon LI. Hematopoiesis: an evolving paradigm for stem cell biology. Cell. 2008;132:631–644. doi: 10.1016/j.cell.2008.01.025. [DOI] [PMC free article] [PubMed] [Google Scholar]
- 3.Rossi DJ, Jamieson CHM, Weissman IL. Stems cells and the pathways to aging and cancer. Cell. 2008;132:681–696. doi: 10.1016/j.cell.2008.01.036. [DOI] [PubMed] [Google Scholar]
- 4.Warr MR, Pietras EM, Passegué E. Mechanisms controlling hematopoietic stem cell functions during normal hematopoiesis and hematological malignancies. Wiley Interdiscip Rev Syst Biol Med. 2011;3:681–701. doi: 10.1002/wsbm.145. [DOI] [PubMed] [Google Scholar]
- 5.Ferraro E, Cecconi F. Autophagic and apoptotic response to stress signals in mammalian cells. Arch Biochem Biophys. 2007;462:210–219. doi: 10.1016/j.abb.2007.02.006. [DOI] [PubMed] [Google Scholar]
- 6.He C, Klionsky DJ. Regulation mechanisms and signaling pathways of autophagy. Annu Rev Genet. 2009;43:67–93. doi: 10.1146/annurev-genet-102808-114910. [DOI] [PMC free article] [PubMed] [Google Scholar]
- 7.Danial NN, Korsmeyer SJ. Cell death: critical control points. Cell. 2004;116:205–219. doi: 10.1016/s0092-8674(04)00046-7. [DOI] [PubMed] [Google Scholar]
- 8.Maiuri MC, Zalckvar E, Kimchi A, Kroemer G. Self-eating and self-killing: crosstalk between autophagy and apoptosis. Nat Rev Mol Cell Biol. 2007;8:741–752. doi: 10.1038/nrm2239. [DOI] [PubMed] [Google Scholar]
- 9.Debnath J, Baehrecke EH, Kroemer G. Does autophagy contribute to cell death? Autophagy. 2005;1:66–74. doi: 10.4161/auto.1.2.1738. [DOI] [PubMed] [Google Scholar]
- 10.Oguro H, Iwana A. Life and death in hematopoietic stem cells. Curr Opin Immunol. 2007;19:503–509. doi: 10.1016/j.coi.2007.05.001. [DOI] [PubMed] [Google Scholar]
- 11.Levine B, Mizushima N, Virgin HW. Autophagy in immunity and inflammation. Nature. 2011;469:323–335. doi: 10.1038/nature09782. [DOI] [PMC free article] [PubMed] [Google Scholar]
- 12.Pua HH, Dzhagalov I, Chuck M, Mizushima N, He YW. A critical role for the autophagy gene Atg5 in T cell survival and proliferation. J Exp Med. 2007;204:25–31. doi: 10.1084/jem.20061303. [DOI] [PMC free article] [PubMed] [Google Scholar]
- 13.Miller BC, et al. The autophagy gene ATG5 plays an essential role in B lymphocyte development. Autophagy. 2008;4:309–314. doi: 10.4161/auto.5474. [DOI] [PubMed] [Google Scholar]
- 14.Kundu M, et al. Ulk1 plays a critical role in the autophagic clearance of mitochondria and ribosomes during reticulocyte maturation. Blood. 2008;112:1493–1502. doi: 10.1182/blood-2008-02-137398. [DOI] [PMC free article] [PubMed] [Google Scholar]
- 15.Mortensen M, et al. Loss of autophagy in erythroid cells leads to defective removal of mitochondria and severe anemia in vivo. Proc Natl Acad Sci USA. 2010;107:832–837. doi: 10.1073/pnas.0913170107. [DOI] [PMC free article] [PubMed] [Google Scholar]
- 16.Liu F, et al. FIP200 is required for the cell-autonomous maintenance of fetal hematopoietic stem cells. Blood. 2010;116:4806–4814. doi: 10.1182/blood-2010-06-288589. [DOI] [PMC free article] [PubMed] [Google Scholar]
- 17.Mortensen M, et al. The autophagy protein Atg7 is essential for hematopoietic stem cell maintenance. J Exp Med. 2011;208:455–467. doi: 10.1084/jem.20101145. [DOI] [PMC free article] [PubMed] [Google Scholar]
- 18.Pietras EM, Warr MR, Passegué E. Cell cycle regulation in hematopoietic stem cells. J Cell Biol. 2011;195:709–720. doi: 10.1083/jcb.201102131. [DOI] [PMC free article] [PubMed] [Google Scholar]
- 19.Mizushima N, Yamamoto A, Matsui M, Yoshimori T, Ohsumi Y. In vivo analysis of autophagy in response to nutrient starvation using transgenic mice expressing a fluorescent autophagosome marker. Mol Biol Cell. 2004;15:1101–1111. doi: 10.1091/mbc.E03-09-0704. [DOI] [PMC free article] [PubMed] [Google Scholar]
- 20.Mizushima N, Yoshimori T, Levine B. Methods in mammalian autophagy research. Cell. 2010;140:313–326. doi: 10.1016/j.cell.2010.01.028. [DOI] [PMC free article] [PubMed] [Google Scholar]
- 21.Shvets E, Fass E, Elazar Z. Utilizing flow cytometry to monitor autophagy in living mammalian cells. Autophagy. 2008;4:621–628. doi: 10.4161/auto.5939. [DOI] [PubMed] [Google Scholar]
- 22.Radoshevich L, et al. ATG12 conjugation to ATG3 regulates mitochondrial homeostasis and cell death. Cell. 2010;142:590–600. doi: 10.1016/j.cell.2010.07.018. [DOI] [PMC free article] [PubMed] [Google Scholar]
- 23.Mohrin M, et al. Hematopoietic stem cell quiescence promotes error prone DNA repair and mutagenesis. Cell Stem Cell. 2010;7:174–185. doi: 10.1016/j.stem.2010.06.014. [DOI] [PMC free article] [PubMed] [Google Scholar]
- 24.Lindsten T, et al. The combined functions of proapoptotic Bcl-2 family members bak and bax are essential for normal development of multiple tissues. Mol Cell. 2000;6:1389–1399. doi: 10.1016/s1097-2765(00)00136-2. [DOI] [PMC free article] [PubMed] [Google Scholar]
- 25.Mammucari C, et al. FoxO3 controls autophagy in skeletal muscle in vivo. Cell Metab. 2007;6:458–471. doi: 10.1016/j.cmet.2007.11.001. [DOI] [PubMed] [Google Scholar]
- 26.Maiuri MC, et al. Autophagy regulation by p53. Curr Opin Cell Biol. 2010;22:181–185. doi: 10.1016/j.ceb.2009.12.001. [DOI] [PubMed] [Google Scholar]
- 27.Tothova Z, et al. FoxOs are critical mediators of hematopoietic stem cell resistance to physiologic oxidative stress. Cell. 2007;128:325–339. doi: 10.1016/j.cell.2007.01.003. [DOI] [PubMed] [Google Scholar]
- 28.Rubinsztein DC, Marino G, Kroemer G. Autophagy and aging. Cell. 2011;146:682–695. doi: 10.1016/j.cell.2011.07.030. [DOI] [PubMed] [Google Scholar]
- 29.Chen C, Liu Y, Zheng P. mTOR regulation and therapeutic rejuvenation of aging hematopoietic stem cells. Sci Signal. 2009;2:ra75. doi: 10.1126/scisignal.2000559. [DOI] [PMC free article] [PubMed] [Google Scholar]
- 30.Ergen AV, Boles NC, Goodell MA. Rantes/Ccl5 influences hematopoietic stem cell subtypes and causes myeloid skewing. Blood. 2012;119:2500–2509. doi: 10.1182/blood-2011-11-391730. [DOI] [PMC free article] [PubMed] [Google Scholar]
- 31.Lum JJ, et al. Growth factor regulation of autophagy and cell survival in the absence of apoptosis. Cell. 2005;120:237–248. doi: 10.1016/j.cell.2004.11.046. [DOI] [PubMed] [Google Scholar]
- 32.Wilson A, Laurenti E, Trumpp A. Balancing dormant and self-renewing hematopoietic stem cells. Curr Opin Genet Dev. 2009;19:461–468. doi: 10.1016/j.gde.2009.08.005. [DOI] [PubMed] [Google Scholar]
- 33.Miyamoto K, et al. Foxo3a is essential for maintenance of the hematopoietic stem cell pool. Cell Stem Cell. 2007;1:101–112. doi: 10.1016/j.stem.2007.02.001. [DOI] [PubMed] [Google Scholar]
- 34.Castrillon DH, Miao L, Kollipara R, Horner JW, DePinho RA. Suppression of ovarian follicle activation in mice by the transcription factor FoxO3a. Science. 2003;301:215–218. doi: 10.1126/science.1086336. [DOI] [PubMed] [Google Scholar]
- 35.Donehower LA, et al. Mice deficient for p53 are developmentally normal but susceptible to spontaneous tumours. Nature. 1992;356:215–221. doi: 10.1038/356215a0. [DOI] [PubMed] [Google Scholar]
- 36.Takeuchi O, et al. Essential role of BAX, BAK in B cell homeostasis and prevention of autoimmune disease. Proc Natl Acad Sci U S A. 2005;102:11272–11277. doi: 10.1073/pnas.0504783102. [DOI] [PMC free article] [PubMed] [Google Scholar]
- 37.Kuhn R, Schwenk F, Aguet M, Rajewsky K. Inducible gene targeting in mice. Science. 1995;269:1427–1429. doi: 10.1126/science.7660125. [DOI] [PubMed] [Google Scholar]
- 38.Santaguida M, et al. JunB protects against myeloid malignancies by limiting hematopoietic stem cell proliferation and differentiation without affecting self-renewal. Cancer Cell. 2009;15:341–352. doi: 10.1016/j.ccr.2009.02.016. [DOI] [PMC free article] [PubMed] [Google Scholar]
- 39.Lock R, et al. Autophagy facilitates glycolysis during Ras-mediated oncogenictransformation. Mol Biol Cell. 2011;22:165–178. doi: 10.1091/mbc.E10-06-0500. [DOI] [PMC free article] [PubMed] [Google Scholar]
Associated Data
This section collects any data citations, data availability statements, or supplementary materials included in this article.
Supplementary Materials
1