NMR-based metabolomics of urine in a mouse model of Alzheimer’s disease: identification of oxidative stress biomarkers (original) (raw)
Abstract
Alzheimer’s disease (AD) is the most common cause of neurodegenerative dementia among elderly patients. A biomarker for the disease could make diagnosis easier and more accurate, and accelerate drug discovery. In this study, NMR-based metabolomics analysis in conjunction with multivariate statistics was applied to examine changes in urinary metabolites in transgenic AD mice expressing mutant tau and β-amyloid precursor protein. These mice showed significant changes in urinary metabolites throughout the progress of the disease. Levels of 3-hydroxykynurenine, homogentisate and allantoin were significantly higher compared to control mice in 4 months (prior to onset of AD symptoms) and reverted to control values by 10 months of age (early/middle stage of AD), which highlights the relevance of oxidative stress to this neurodegenerative disorder even prior the onset of dementia. The level of these changed metabolites at very early period may provide an indication of disease risk at asymptomatic stage.
Keywords: Alzheimer’s disease, metabolomics, NMR, oxidative stress, biomarker
Introduction
Alzheimer’s disease (AD) is a severe neurodegenerative disorder characterized by loss of memory and cognitive decline.(1) Although the cause is not known, the pathological hallmarks of AD are neurofibrillary tangles consisting of hyperphosphorylated tau and senile plaques, composed mainly of amyloid-β peptides formed after sequential cleavage of the amyloid precursor protein (APP) by β and γ secretases.(2) Current diagnosis of AD relies largely on the documentation of mental decline, by which time the disease has already caused severe brain damage in individuals who meet the criteria for such decline.(3) A simple and accurate method for detecting AD prior to the onset of these devastating symptoms is urgently needed.
Biomarkers are reliable predictors and indicators of a disease process. The absence of viable biomarkers to detect and track AD progression has hindered the discovery of new treatments. Therefore, identification of an effective biomarker for early detection of AD would facilitate diagnosis and therapeutic trials.
1H NMR spectroscopy of biological fluids followed by multivariate analysis of the spectroscopic data is a systems biological approach that has been used to identify important changes in metabolism.(4,5) The unbiased profile of all metabolites provided by 1H NMR spectra has allowed its application in many areas relevant to pharmaceutical research and development, including drug safety assessment, characterization of genetically modified animal models of disease, diagnosis of human disease, understanding physiological variations and drug therapy monitoring.(6–11) In this study, we performed a metabolomic analysis of urine from double transgenic mice, referred to here as TAPP mice, that independently express mutations in amyloid precursor protein (APP) and tau.(12) The experiments using urine samples were used to non-invasively track these mice during disease progression with data acquired at 4, 10, and 15 months of age, which represented prior to onset, early/middle, and late stages of AD, respectively. All spectra were analyzed using Principal Component Analysis (PCA) and Orthogonal Partial Least Square-Discriminant Analysis (OPLS-DA) algorithms to determine the integrity of metabolites that change with disease progression. The results of these experiments clearly demonstrated that the urine metabolic profiles differ between AD and control animals, even during ”prior to onset” stage. The metabolites corresponding to these differences would be expected to arise due to increased levels of oxidative stress that are implicated in AD progression. These results would contribute to the determination of typical biomarkers that could aid in earlier AD diagnosis, or predict which individuals may go on to develop AD.
Materials and Methods
Animal studies
We used female transgenic mice hemizygous for transgenes coding both human mutated APP and tau (APP/tau mice) as an AD model mice. They were generated by crossing Tg2576 male transgenic mice hemizygously expressing the human APP with Sweden-type mutations (Lys670Asn, Met671Leu) with JNPL3 female transgenic mice homozygously expressing mutant P301L four-repeat tau proteins. Control was the mice crossed with wild-type tau females with wild-type APP male mice controls (no transgenes). These mice at 2 months old were purchased from Taconic Farms, Inc. and raised up to 4 months old (presymptomatic), 10 months old (early stage of symptom), and 15 months old (late stage). At those time points, urine of each mouse (n = 3–5 for each group) was collected for 12 h (from 10:00 pm to 8:00 am) in a stainless steel metabolic cage and stored at −80°C until analysis. All animal experiments were performed in accordance with the Guidelines for Animal Experimentation and under the control of the Ethics Committee of Animal Care and Experimentation of the National Center for Geriatrics and Gerontology, Japan.
1H NMR spectroscopic analysis of urine
Urine samples for NMR spectroscopy were centrifuged at 600 g for 10 min at 4°C, and the supernatants (534 µL) were dissolved in 60 µl 5 mM trimethylsilyl propanoic acid (TSP)/D2O and 6 µl 1 M imidazole/D2O to yield a 600 µl solution for NMR measurements. The samples were placed in 5 mm NMR tubes, and 1H NMR spectra were recorded at 294 K using a Varian 600 MHz NMR spectrometer equipped with a cold probe. Water resonance was suppressed by presaturation during the first increment of the NOESY pulse sequence, with irradiation occurring during the 2.0 s relaxation delay and also during the 100 ms mixing time. Thirty-two free induction decays (FIDs) with 77K data points per FID were collected using a spectral width of 9615.4 Hz, an acquisition time of 4.00 s, and a total pulse recycle delay of 2.02 s. After Fourier transformation with 0.5 Hz line broadening and a single zero-filling, 1H spectra were phased and baseline corrected, and the chemical shift scale was set by assigning a value of δ = 0 ppm to the signal for the internal standard TSP. Endogenous metabolites in the spectra were assigned using the NMR Suite 6.0 software (Chenomx Inc., Calgary, Canada).
Multivariate data analysis
PCA and OPLS-DA were performed with unit variance as the data pretreatment. OPLS-DA optimizes the model complexity by removing the systematic variations in the X data that are not related to Y. This classification method is well-suited to maximize separations among different predefined gruoups of samples and has an intrinsic prediction power. For multivariate analysis, all 1H NMR spectra were phased and baseline corrected by the NMR Suite 6.0 software. Each 1H NMR spectrum was then subdivided into regions having an equal bin size of 0.04 ppm over a chemical shift range of 0.04–11.5 ppm, and the regions within each bin were integrated. The regions of the spectrum that included water (δ4.76–5.12) and imidazole (δ7.29–7.38) were removed from the analysis for all groups to eliminate variation in water suppression efficiency. The integrated intensities were then normalized to the total spectral area, and the data were converted from the NMR Suite software format into a Microsoft Excel format (*.xls). The resulting data sets were imported into SIMCA-P ver. 12.0 software (Umetrics, Umea, Sweden) for multivariate statistical analysis, and PCA and OPLS-DA were then performed to examine the intrinsic variation in the data set. The obtained Q2 and R2 values described the predictive ability and the reliability of the fitting, respectively.
Results
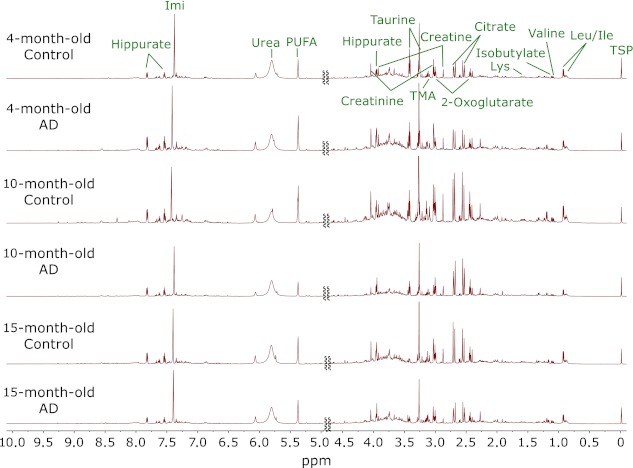
1H NMR spectra of urine samples from 4-, 10- and 15-month-old TAPP and age-matched control mice were recorded followed by multivariate statistical analyses. Representative spectra are shown in Fig. 1. Resonances assigned to metabolites such as leucine, valine, lysine, citrate, 2-oxoglutarate, taurine, hippurate, and allantoin are visible.
Fig. 1.
Representative 1H NMR spectra profile of urine samples collected from 4-, 10- and 15-month-old TAPP and age-matched control mice.
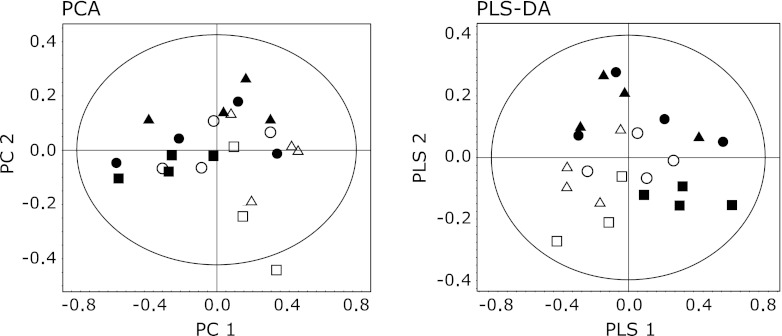
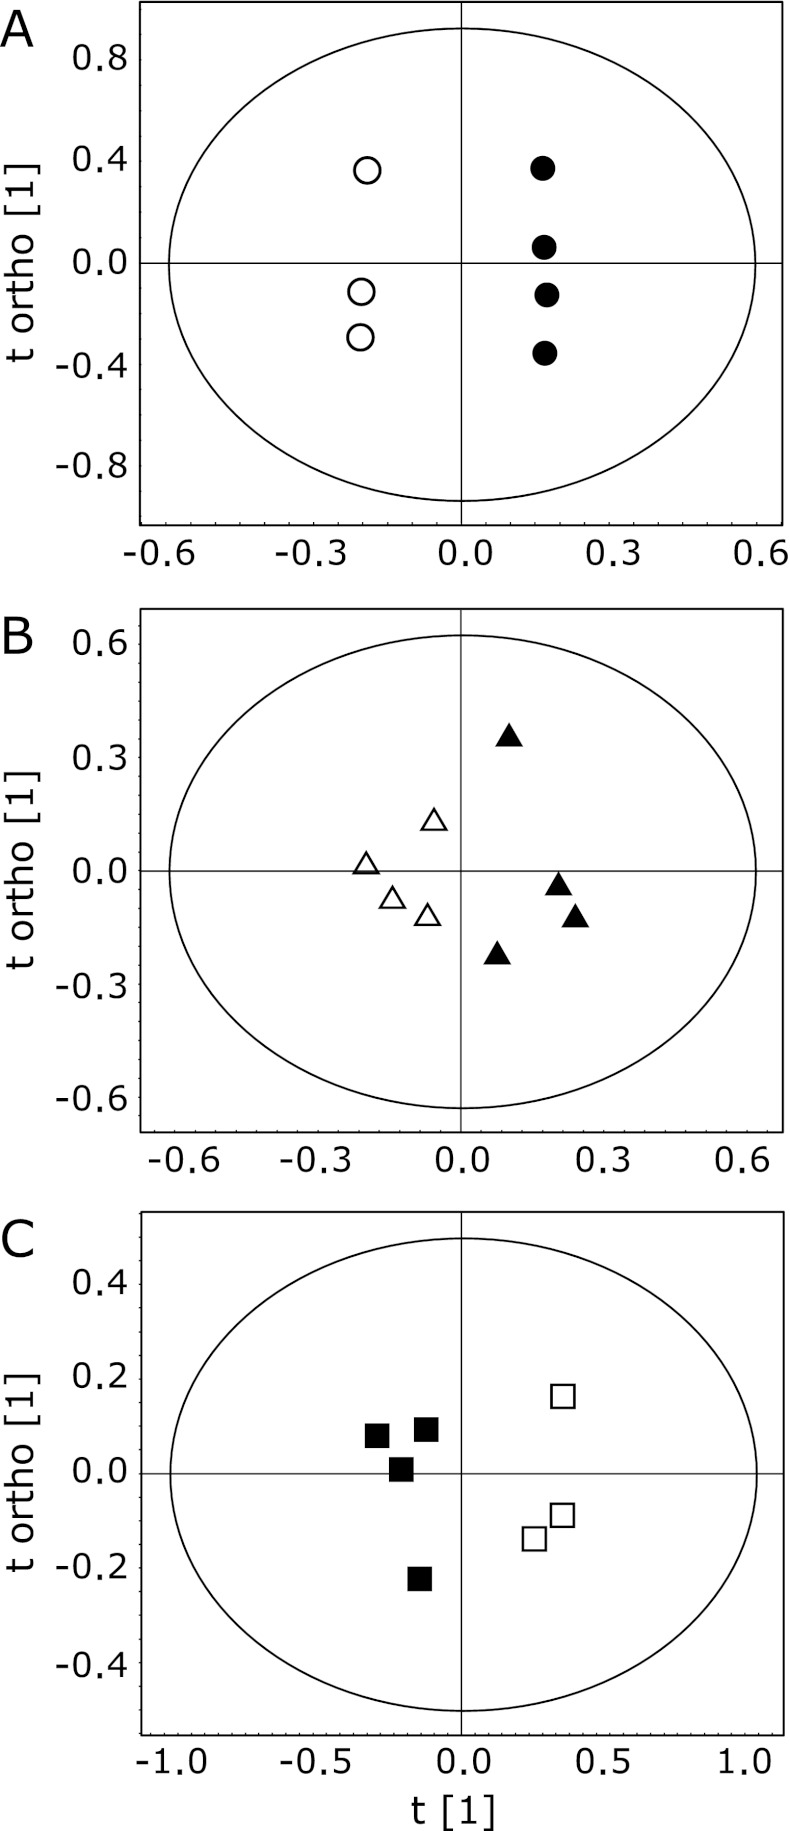
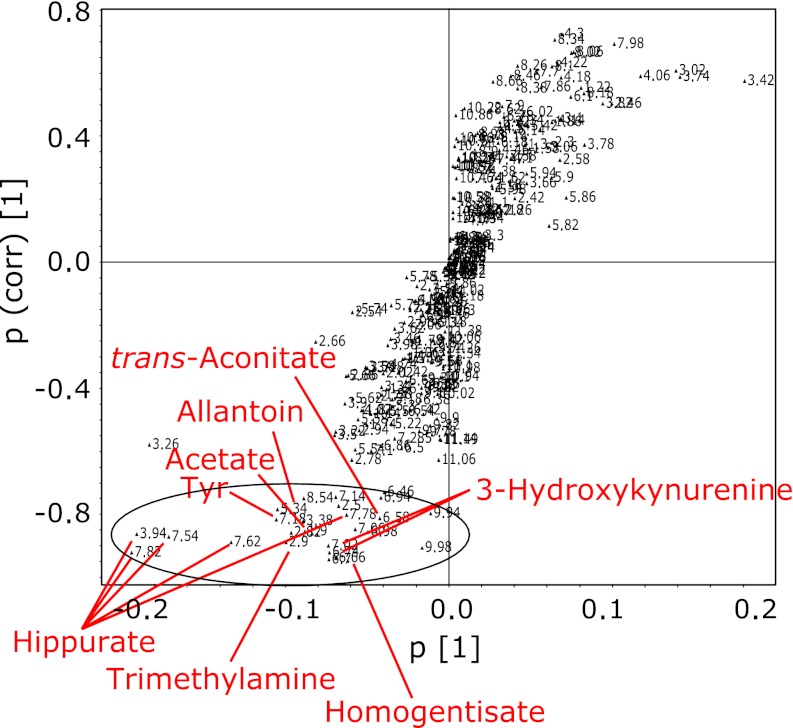
For an overview of the data set obtained from the 1H NMR spectra of urine samples, a multivariate analysis for all groups was first performed by PCA. However, the metabolic profile of AD mice for each group was not separated in the score plot, suggesting that changes in total metabolite levels were not large among the 6 groups (Fig. 2A). When data for all groups were combined in PLS-DA scores, the separation of the control from TAPP groups can be ameliorated, but still no separation between the different ages was apparent (Fig. 2B). All subsequent analyses were then carried out by separate comparisons of control and disease animals of the same age using OPLS-DA. The OPLS-DA score plot from the urinary NMR metabolic profile of 4-month-old TAPP mice and control mice is shown in Fig. 3A. This model also showed segregation of the mice groups with _Q_2 (cum) = 0.937 and R_2_X = 0.974. For mice before the onset of AD, the significantly high _Q_2 indicated a considerable difference in the urinary metabolic profile of TAPP mice compared to control individuals. In order to identify the spectral bins that varied significantly between the groups, the loadings S-plot from the model was investigated. Fig. 4 shows a representative S-plot (correlation of spectral bins with TAPP-control group separation) corresponding to the score plot of Fig. 3A. These bins were further analyzed to identify the significant metabolites that contributed to the separation of the mice groups seen in the OPLS-DA model. The resonances responsible for the differences could be attributed to allantoin, _trans_-aconitate, 3-hydroxykynurenine, homogentisate, tyrosine and hippurate, the levels of which were increased in 4-month-old TAPP mice compared to control mice. Similar OPLS-DA plots were obtained for 10- and 15-month-old TAPP mice. The early/mid stage of AD in 10-month-old mice showed insufficient variation with quality factors of _Q_2 (cum) = 0.025 and R_2_X = 0.590 (Fig. 3B). In fact, only a few metabolites were revealed when the loadings S-plot from the model was applied (data not shown). Comparing 15-month-old TAPP mice and control animals, the OPLS-DA clearly discriminated between the two groups, showing that quality factors for those models were _Q_2 (cum) = 0.619 and R_2_X = 0.689 (Fig. 3C). The relative contributions of bins to clustering of AD and control mice could then be easily extracted from the corresponding loadings S-plot (data not shown). Table 1 summarizes the variation of the normalized spectral region integrals (bins) accounting for different urine metabolites and lists the results from the statistical analysis for comparison. Among the increased metabolites in 4-month-old TAPP mice, the levels of 3-hydroxykynurenine, homogentisate and tyrosine did not present significant changes in 10- and 15-month-old animals, indicating that the alterations of these metabolites are characteristic of AD prior to the onset of dementia. The allantoin level was significantly increased in both 4- and 15-month-old TAPP mice compared to controls. While some metabolite levels were altered in 10-month-old TAPP mice, no statistically significant differences were noted between the TAPP mice and controls. On the other hand, there were significant alterations in the urinary levels of several metabolites at 15 months of age, including increased levels of citrate and urea and decreased levels of 2-oxoglutarate, dimethylamine, trimethylamine, trigonelline and 1-methylnicotinamide. These metabolites may characterize the late stage of AD as suggested by these statistically significant alterations.
Fig. 2.
PCA and PLS-DA analysis based on 1H NMR spectra of urine from TAPP and control mice. Each symbol represents one sample 1H NMR spectra. Circles = 4 months, triangles = 10 months, squares = 15 months. Closed and open symbols represent control and TAPP mice, respectively.
Fig. 3.
Representative 1H NMR spectra OPLS-DA scores of mouse urine showing temporal changes in AD progress. A: 4-month, B: 10-month, C: 15-month-old mice. Each symbol in the plot represents one sample 1H NMR spectra. Closed and open symbols represent control and TAPP mice, respectively. The t [1] axis represents the predictive variation among the mice groups and the t ortho [1] axis represents the variation orthogonal to the group of the specific variation. Quality factors for these models were R_2_X = 0.974 and _Q_2 = 0.937 for 4 months, R_2_X = 0.590 and _Q_2 = 0.025 for 10 months, and R_2_X = 0.689 and _Q_2 = 0.616 for 15 months.
Fig. 4.
Representative OPLS-DA loadings S-plot showing relative contribution of bins/spectral variables to clustering of 4-month-old TAPP and control mice. This plot corresponds to the scores plot shown in Fig. 3A. Bins from the circled region represent those that were increased in TAPP mice. Bins with high correlation (>0.75 for increased) were selected for further analysis.
Table 1.
Variation of the normalized spectral region (bins) integrals accounting for different urine metabolites
| Chemical shift | Metabolites | 4-month | 10-month | 15-month |
|---|---|---|---|---|
| 1.9 | Acetate | ↑** | — | ↑ |
| 2.46 | 2-oxoglutarate | — | — | ↓* |
| 2.66 | Citrate | — | — | ↑*** |
| 2.7 | Dimethylamine | — | — | ↓** |
| 2.86 | Trimethylamine | — | ↓ | ↓** |
| 3.42 | Taurine | — | ↓ | ↑ |
| 4.22 | Threonine | — | — | ↓** |
| 5.34 | Allantoin | ↑* | — | ↑* |
| 5.78 | Urea | — | ↑ | ↑* |
| 6.58 | _trans_-aconitate | ↑* | ↑ | ↓ |
| 6.7 | 3-hydroxykynurenine | ↑*** | — | — |
| 6.74 | Homogentisate | ↑*** | — | — |
| 7.18 | Tyrosine | ↑* | — | — |
| 7.82 | Hippurate | ↑*** | ↑ | — |
| 8.1 | Trigonelline | ↓ | ↓ | ↓*** |
| 8.94 | 1-methylnicotinamide | — | — | ↓* |
Among the metabolites that varied significantly between control and TAPP mice, 3-hydroxykynurenine,(13) homogentisate(14) and allantoin(15) are known markers for oxidative stress, while trimethyl amine and dimethyl amine are choline metabolites.(16) The levels of these metabolites were then compared with those of controls throughout disease progression. As shown in Fig. 5, the levels of 3-hydroxykynurenine, homogentisate and allantoin, which were significantly increased in 4-month-old TAPP mice, were found to revert to control values by 10 months of age. These results show that oxidative stress is spontaneously enhanced in TAPP mice prior to the onset of AD symptoms, and could provide a typical biomarker to aid in earlier AD diagnosis. In TAPP mice, trimethylamine decreased with age and dimethylamine was constant across all ages tested, whereas these levels in control mice tended to increase gradually, resulting in significant differences in the metabolite levels between control and TAPP mice in 15 months. This result implies that trimethylamine and dimethylamine may be useful for monitoring the progress of AD.
Fig. 5.
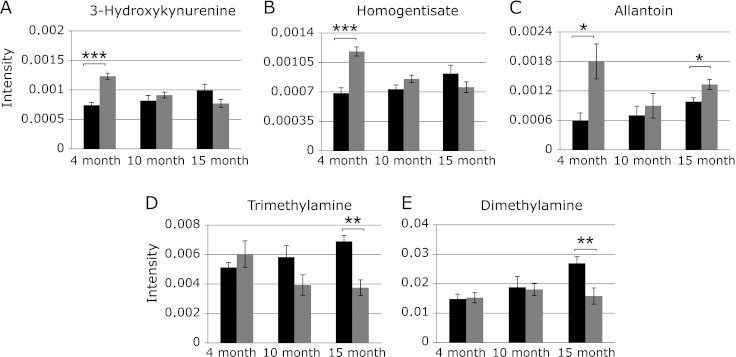
The levels of the representative metabolites in urine contributing segregation between TAPP and control mice. All peak intensities were calculated in terms of actual integrated value of individual NMR spectral peaks normalized to total spectral intensity. Black bar; control mice, gray bar; TAPP mice. Data are expressed as mean ± SEM. *p<0.05, **p<0.01, ***p<0.001, compared to control as determined by Student’s t test.
Discussion
Recent research in AD demonstrated compelling evidence for the importance of oxidative stress in its pathogenesis.(17,18) Small molecules indicating the generation of oxidative stress may provide viable AD biomarkers. Tryptophan metabolism by the kynurenine pathway produces neurotoxic intermediates that are implicated in AD pathogenesis.(19,20) In particular, 3-hydroxykynurenine can produce reactive oxygen species (ROS) and induce oxidative stress that significantly damages neuronal tissue.(21) Alkaptonuria is a genetic disorder of phenylalanine and tyrosine metabolism and the main symptoms of the disease are due to homogentisic acid accumulation in tissues.(22) Auto-oxidation of homogentisic acid produces ROS that act as molecular agents of alkaptonuric arthritis.(23) In our results, the urinary levels of 3-hydroxykynurenine and homogentisate were significantly higher in 4-month-old TAPP mice than in control mice, suggesting that oxidative stress is a contributing factor to the early onset of dementia and evolution of AD. Uric acid is the final product of purine metabolism in human and may be oxidized to allantoin by various ROS that are the hallmark of oxidative stress and can damage proteins, lipids and DNA. It has been reported that allantoin level is increased in model rat of ischemia-reperfusion injury(24) and model mouse of atherosclerosis,(25) which are closely related to the occurrence of oxidative stress. Therefore, measurement of allantoin levels may be useful for quantifying the amount of oxidative stress.(26) In fact, the high level of allantoin simultaneously observed in 4-month-old TAPP mice supports that oxidative stress conditions are present prior to the onset of AD.
There are strong indications that oxidative stress occurs prior to the onset of symptoms in AD(27) and oxidative damage is found both in the regions of the brain affected by disease(28) and peripheral brain tissue.(29) Moreover, oxidative damage has been shown to occur before Aβ plaque formation.(30) Indeed, in the present study a significant increase in oxidative stress markers was shown in the urine of TAPP mice before AD-like pathological symptoms were present. Interestingly, these levels reverted to those of control mice after the onset of dementia. There is also evidence that brain tissue in AD is exposed to oxidative stress through alterations caused by oxidized proteins,(31) advanced glycation end products,(32) lipid peroxidation end products,(33) and the formation of toxic species.(34) However, the levels of such molecules do not always increase throughout the progress of diseases. The modified nucleoside 8-hydroxy-2'-deoxyguanosine is considered to be a good indicator of oxidative DNA damage. The level of this compound is quantitatively greatest early in AD, which indicates the occurrence of oxidative stress, but decreases with disease progression.(30) As the oxidative stress-related metabolites found in this study are water-soluble to cross the blood-brain barrier, the alterations in these metabolites in the urine can be attributed to progressive pathological changes in the brain. Therefore, the metabolite signature also demonstrated the important role of oxidative stress in the onset of AD, and especially the observed significant increases support the use of these metabolites as effective biomarkers to predict the onset of AD.
In conclusion, we used NMR metabolomics of transgenic AD mice model to identify and characterize small molecules that are changed in the urine levels during the AD development. Levels of 3-hydroxykynurenine, homogentisate and allantoin were significantly higher compared to control mice in the stage prior to AD symptoms and reverted to control values by early/middle stage of AD, which highlights the relevance of oxidative stress even prior the onset of dementia. The level of these changed metabolites at very early period may provide an indication of disease risk at asymptomatic stage.
Acknowledgments
This work was supported by the Advanced Research for Products Mining Programme [grant number 10-45] from the National Institute of Biomedical Innovation of Japan.
Conflict of Interest
No potential conflicts of interest were disclosed.
References
- 1.Ballard C, Gauthier S, Corbett A, Brayne C, Aarsland D, Jones E. Alzheimer’s disease. Lancet. 2011;377:1019–1031. doi: 10.1016/S0140-6736(10)61349-9. [DOI] [PubMed] [Google Scholar]
- 2.LaFerla FM, Green KN, Oddo S. Intracellular amyloid-beta in Alzheimer’s disease. Nature reviews Neuroscience. 2007;8:499–509. doi: 10.1038/nrn2168. [DOI] [PubMed] [Google Scholar]
- 3.Amieva H, Le Goff M, Millet X, et al. Prodromal Alzheimer’s disease: successive emergence of the clinical symptoms. Ann Neurol. 2008;64:492–498. doi: 10.1002/ana.21509. [DOI] [PubMed] [Google Scholar]
- 4.Bollard ME, Stanley EG, Lindon JC, Nicholson JK, Holmes E. NMR-based metabonomic approaches for evaluating physiological influences on biofluid composition. NMR Biomed. 2005;18:143–162. doi: 10.1002/nbm.935. [DOI] [PubMed] [Google Scholar]
- 5.Serkova NJ, Spratlin JL, Eckhardt SG. NMR-based metabolomics: translational application and treatment of cancer. Curr Opin Mol Ther. 2007;9:572–585. [PubMed] [Google Scholar]
- 6.De Meyer T, Sinnaeve D, Van Gasse B, et al. NMR-based characterization of metabolic alterations in hypertension using an adaptive, intelligent binning algorithm. Anal Chem. 2008;80:3783–3790. doi: 10.1021/ac7025964. [DOI] [PubMed] [Google Scholar]
- 7.Fukuhara K, Ohno A, Ando Y, Yamoto T, Okuda H. A 1H NMR-based metabolomics approach for mechanistic insight into acetaminophen-induced hepatotoxicity. Drug Metab Pharmacokinet. 2011;26:399–406. doi: 10.2133/dmpk.dmpk-11-rg-005. [DOI] [PubMed] [Google Scholar]
- 8.Lindon JC, Holmes E, Nicholson JK. Metabonomics in pharmaceutical R&D. FEBS J. 2007;274:1140–1151. doi: 10.1111/j.1742-4658.2007.05673.x. [DOI] [PubMed] [Google Scholar]
- 9.Maher AD, Lindon JC, Nicholson JK. 1H NMR-based metabonomics for investigating diabetes. Future Med Chem. 2009;1:737–747. doi: 10.4155/fmc.09.54. [DOI] [PubMed] [Google Scholar]
- 10.O’Connell TM. Recent advances in metabolomics in oncology. Bioanalysis. 2012;4:431–451. doi: 10.4155/bio.11.326. [DOI] [PubMed] [Google Scholar]
- 11.Powers R. NMR metabolomics and drug discovery. Magn Reson Chem. 2009;47 (Suppl 1):S2–S11. doi: 10.1002/mrc.2461. [DOI] [PubMed] [Google Scholar]
- 12.Lewis J, Dickson DW, Lin WL, et al. Enhanced neurofibrillary degeneration in transgenic mice expressing mutant tau and APP. Science. 2001;293:1487–1491. doi: 10.1126/science.1058189. [DOI] [PubMed] [Google Scholar]
- 13.Pawlak K, Domaniewski T, Mysliwiec M, Pawlak D. The kynurenines are associated with oxidative stress, inflammation and the prevalence of cardiovascular disease in patients with end-stage renal disease. Atherosclerosis. 2009;204:309–314. doi: 10.1016/j.atherosclerosis.2008.08.014. [DOI] [PubMed] [Google Scholar]
- 14.Martin JP, Jr., Batkoff B. Homogentisic acid autoxidation and oxygen radical generation: implications for the etiology of alkaptonuric arthritis. Free Radic Biol Med. 1987;3:241–250. doi: 10.1016/s0891-5849(87)80031-x. [DOI] [PubMed] [Google Scholar]
- 15.Il’yasova D, Scarbrough P, Spasojevic I. Urinary biomarkers of oxidative status. Clin Chim Acta. 2012;413:1446–1453. doi: 10.1016/j.cca.2012.06.012. [DOI] [PMC free article] [PubMed] [Google Scholar]
- 16.Zeisel SH, daCosta KA, Youssef M, Hensey S. Conversion of dietary choline to trimethylamine and dimethylamine in rats: dose-response relationship. J Nutr. 1989;119:800–804. doi: 10.1093/jn/119.5.800. [DOI] [PubMed] [Google Scholar]
- 17.Verri M, Pastoris O, Dossena M, et al. Mitochondrial alterations, oxidative stress and neuroinflammation in Alzheimer’s disease. Int J Immunopathol Pharmacol. 2012;25:345–353. doi: 10.1177/039463201202500204. [DOI] [PubMed] [Google Scholar]
- 18.von Bernhardi R, Eugenin J. Alzheimer’s disease: redox dysregulation as a common denominator for diverse pathogenic mechanisms. Antioxid Redox Signal. 2012;16:974–1031. doi: 10.1089/ars.2011.4082. [DOI] [PubMed] [Google Scholar]
- 19.Bonda DJ, Mailankot M, Stone JG, et al. Indoleamine 2,3-dioxygenase and 3-hydroxykynurenine modifications are found in the neuropathology of Alzheimer’s disease. Redox Rep. 2010;15:161–168. doi: 10.1179/174329210X12650506623645. [DOI] [PMC free article] [PubMed] [Google Scholar]
- 20.Takikawa O. Biochemical and medical aspects of the indoleamine 2,3-dioxygenase-initiated L-tryptophan metabolism. Biochem Biophys Res Commun. 2005;338:12–19. doi: 10.1016/j.bbrc.2005.09.032. [DOI] [PubMed] [Google Scholar]
- 21.Okuda S, Nishiyama N, Saito H, Katsuki H. Hydrogen peroxide-mediated neuronal cell death induced by an endogenous neurotoxin, 3-hydroxykynurenine. Proc Natl Acad Sci USA. 1996;93:12553–12558. doi: 10.1073/pnas.93.22.12553. [DOI] [PMC free article] [PubMed] [Google Scholar]
- 22.Fernández-Cañón JM, Granadino B, Beltrán-Valero de Bernabé D, et al. The molecular basis of alkaptonuria. Nat Genet. 1996;14:19–24. doi: 10.1038/ng0996-19. [DOI] [PubMed] [Google Scholar]
- 23.Braconi D, Bianchini C, Bernardini G, et al. Redox-proteomics of the effects of homogentisic acid in an in vitro human serum model of alkaptonuric ochronosis. J Inherit Metab Dis. 2011;34:1163–1176. doi: 10.1007/s10545-011-9377-6. [DOI] [PubMed] [Google Scholar]
- 24.Serkova N, Fuller TF, Klawitter J, Freise CE, Niemann CU. H-NMR-based metabolic signatures of mild and severe ischemia/reperfusion injury in rat kidney transplants. Kidney Int. 2005;67:1142–1151. doi: 10.1111/j.1523-1755.2005.00181.x. [DOI] [PubMed] [Google Scholar]
- 25.Leo GC, Darrow AL. NMR-based metabolomics of urine for the atherosclerotic mouse model using apolipoprotein-E deficient mice. Magn Reson Chem. 2009;47 (Suppl 1):S20–S25. doi: 10.1002/mrc.2470. [DOI] [PMC free article] [PubMed] [Google Scholar]
- 26.Benzie IF, Chung WY, Tomlinson B. Simultaneous measurement of allantoin and urate in plasma: analytical evaluation and potential clinical application in oxidant:antioxidant balance studies. Clin Chem. 1999;45:901–904. [PubMed] [Google Scholar]
- 27.Moreira PI, Duarte AI, Santos MS, Rego AC, Oliveira CR. An integrative view of the role of oxidative stress, mitochondria and insulin in Alzheimer’s disease. J Alzheimers Dis. 2009;16:741–761. doi: 10.3233/JAD-2009-0972. [DOI] [PubMed] [Google Scholar]
- 28.Honda K, Smith MA, Zhu X, et al. Ribosomal RNA in Alzheimer disease is oxidized by bound redox-active iron. J Biol Chem. 2005;280:20978–20986. doi: 10.1074/jbc.M500526200. [DOI] [PubMed] [Google Scholar]
- 29.Moreira PI, Harris PL, Zhu X, et al. Lipoic acid and N-acetyl cysteine decrease mitochondrial-related oxidative stress in Alzheimer disease patient fibroblasts. J Alzheimers Dis. 2007;12:195–206. doi: 10.3233/jad-2007-12210. [DOI] [PubMed] [Google Scholar]
- 30.Nunomura A, Perry G, Aliev G, et al. Oxidative damage is the earliest event in Alzheimer disease. J Neuropathol Exp Neurol. 2001;60:759–767. doi: 10.1093/jnen/60.8.759. [DOI] [PubMed] [Google Scholar]
- 31.Sultana R, Butterfield DA. Role of oxidative stress in the progression of Alzheimer’s disease. J Alzheimers Dis. 2010;19:341–353. doi: 10.3233/JAD-2010-1222. [DOI] [PubMed] [Google Scholar]
- 32.Rahmadi A, Steiner N, Münch G. Advanced glycation endproducts as gerontotoxins and biomarkers for carbonyl-based degenerative processes in Alzheimer’s disease. Clin Chem Lab Med. 2011;49:385–391. doi: 10.1515/CCLM.2011.079. [DOI] [PubMed] [Google Scholar]
- 33.Butterfield DA, Bader Lange ML, Sultana R. Involvements of the lipid peroxidation product, HNE, in the pathogenesis and progression of Alzheimer’s disease. Biochim Biophys Acta. 2010;1801:924–929. doi: 10.1016/j.bbalip.2010.02.005. [DOI] [PMC free article] [PubMed] [Google Scholar]
- 34.Gella A, Durany N. Oxidative stress in Alzheimer disease. Cell Adh Migr. 2009;3:88–93. doi: 10.4161/cam.3.1.7402. [DOI] [PMC free article] [PubMed] [Google Scholar]
