Activation of the sonic hedgehog signaling pathway occurs in the CD133 positive cells of mouse liver cancer Hepa 1–6 cells (original) (raw)
Abstract
Background
The important role of cancer stem cells in carcinogenesis has been emphasized in research. CD133+ cells have been mentioned as liver cancer stem cells in hepatocellular carcinoma (HCC). Some researchers have proposed that the sonic hedgehog (Shh) pathway contributes to hepatocarcinogenesis and that the pathway activation occurs mainly in cancer stem cells. We investigated whether the activation of the Shh pathway occurs in CD133+ cells from liver cancer.
Materials and methods
We used magnetic sorting to isolate CD133+ cells from mouse cancer Hepa 1–6 cells. To examine the clonogenicity, cell culture and soft agar colony formation assay were performed between CD133+ and CD133− cells. To study the activation of the Shh pathway, we examined the mRNA expressions of Shh, patched homolog 1 (Ptch-1), glioma-associated oncogene homolog 1 (Gli-1), and smoothened homolog (Smoh) by real-time polymerase chain reaction of both CD133+ and CD133− cells.
Results
The number (mean ± standard deviation) of colonies of CD133+ cells and CD133− cells was 1,031.0 ± 104.7 and 119.7 ± 17.6 respectively. This difference was statistically significant (P < 0.001). Their clonogenicity was 13.7% ± 1.4% and 1.6% ± 0.2% respectively with a statistically significant difference found (P < 0.001). CD133+ cells and CD133− cells were found to have statistically significant differences in Shh mRNA and Smoh mRNA (P = 0.005 and P = 0.043 respectively).
Conclusion
CD133+ Hepa 1–6 cells have a significantly higher colony proliferation and clonogenicity. The Shh pathway is activated in these cells that harbor stem cell features, with an underexpression of Shh mRNA and an overexpression of Smoh mRNA. Blockade of the Shh signaling pathway may be a potential therapeutic strategy for hepatocarcinogenesis.
Keywords: sonic hedgehog, hepatocellular carcinoma, stem cells, CD133+ cells, liver cancer, Hepa 1–6
Introduction
Hepatocellular carcinoma (HCC) is a leading cause of death in many Asian countries. Its prevalence has also been increasing in the West in recent years.13 The prognosis for those who are not candidates for resection or transplantation is poor.1 To create new treatment strategies, research on some pathways of hepatocarcinogenesis is required.
Stem cells in healthy tissues have an ability to perpetuate themselves through self-renewal and to generate mature cells through differentiation.4 According to some hypotheses, similar to normal stem cells, a small number of tumor cells, defined as “cancer stem cells”, are capable of initiating and sustaining tumors.5–10 CD133+ has been suggested as a marker of stem cells of various cancers including HCC though some controversy exists.11–17 The important role of cancer stem cells in carcinogenesis has been emphasized. To inhibit cancer stem cells, blockade of the contributing pathway may be an effective strategy.18–19
Hepa 1–6 cells are a well-known mouse liver cancer cell line. We hypothesize that CD133+ cells are the cancer stem cells of Hepa 1–6 cells. The aim of this study was to investigate whether CD133+ cells of mouse liver cancer Hepa 1–6 cells are clonogenic, and to elucidate which part of the sonic hedgehog (Shh) pathway participates in affecting these cells.
The Shh signaling pathway plays an important role in organizing cell growth and differentiation during embryonic tissue patterning.20,21 The contribution of the Shh pathway in hepatocarcinogenesis has been proposed.22–24 Recently, some research has suggested that activation of this pathway occurs mainly in cancer stem cells.25
Materials and methods
Sorting of CD133+ Hepa 1–6 cells
Cell culture
Mouse liver cancer Hepa 1–6 cell lines were cultured in Dulbecco’s Modified Eagle’s Medium (DMEM) (Hyclone Laboratories, Logan, Utah, USA). The medium contained 10% fetal bovine serum (FBS) (Biological Industries, Kibbutz Beit Haemek, Israel) and 100 unit/mL penicillin and 100 g/mL streptomycin (Gibco®, Life Technologies, Carlsbad, CA, USA) in a humidified atmosphere that contained 5% CO2.
Magnetic sorting and culture of CD133+ Hepa 1–6 cells
Cells were labeled with anti-prominin-1 microbeads of mouse (Miltenyi Biotec, Bergisch Gladbach, Germany) (1 μL per million cells) and separated on a MACS LS column (Miltenyi Biotec). All procedures were carried out according to the manufacturer’s instructions. The purity of sorted cells was evaluated by flow cytometry and western blot. The flow cytometry was carried out with a BD FACS Calibur Flow Cytometer, using anti-prominin-1 PE conjugate (Miltenyi Biotec). The isolated CD133+ cells were cultured before assay in DMEM/10% FBS (Thermo Fisher Scientific, Waltham, MA, USA), supplemented with 200 mM L-glutamine (Life Technologies), 25 mM HEPES (4-[2-hydroxyethyl]-1-piperazineethanesulfonic acid) (Sigma-Aldrich, St Louis, MO, USA), 10 mM nonessential amino acids (Life Technologies), 10 ng/mL leukemia inhibitory factor (Bioscience Research Reagents, Temecula, CA, USA), 2% (v/v) 2-mercaptoethanol (Sigma-Aldrich) and antibiotics.
Soft agar colony formation (proliferation) assay and clonogenicity
Purified CD133+ and CD133− cells were suspended in 0.4% low melting point (LMP) agarose (SeaPlaque® Agarose, Lonza, Allendale, NJ, USA) in RPMI (Roswell Park Memorial Institute) 1640 media with 10% FBS and overlaid onto 0.8% LMP-agarose/RPMI 1640 (Hyclone Laboratories, Boston, MA, USA) in 6 cm culture plates at a density of 7,500 cells/well respectively. After 4 weeks, the cultures were fixed in methanol containing 0.5% crystal violet and colonies (≥10 cells) were counted under a microscope in 10 fields per well and photographed. For clonogenicity experiments, freshly isolated CD133− and CD133+ Hepa 1–6 cells were plated at a density of 7,500 cells/well in 6 cm culture plates and cultured for 4 weeks. Finally, the cells were stained crystal violet, photographed and analyzed for their proliferation efficiency. Each experiment was performed three times.
Expression of messenger RNA (mRNA) of Shh signaling pathway genes between CD133+ Hepa 1–6 cells and CD133− Hepa 1–6 cells
Total RNA isolation, reverse transcription, and real-time polymerase chain reaction
Total RNA was isolated from CD133+ cells and CD133− cells using the REzol™ C&T reagent, according to the manufacturer’s protocol (PROtech Technology, Taipei, Taiwan). Two micrograms of total RNA were reverse transcribed (RT) to cDNA templates using a high capacity cDNA RT kit (Applied Biosystems, Foster City, CA, USA).
The mRNA expression was analyzed using real-time polymerase chain reaction (PCR) (Roche LightCycler, Roche, Mannheim, Germany). Primer sequences used for real-time analysis were: sonic hedgehog (Shh) (forward), 5′-GGA AAA CAC TGG AGC AGA CC-3′; and (reverse), 5′-CCA CGG AGT TCT CTG CTT TC-3′; patched homolog 1 (Ptch-1) (forward), 5′-CCG TTC AGC TCC GCA CAG A-3′; and (reverse), 5′-CTC ACT CGG GTG GTC CCA TAA A-3′; glioma-associated oncogene homolog 1 (Gli-1) (forward), 5′-ATC ACC TGT TGG GGA TGC TGG AT-3′; and (reverse), 5′-GGC GTG AAT AGG ACT TCC GAC AG-3′; smoothened homolog (Smoh) (forward), 5′-GCC TGG TGC TTA TTG TGG-3′; and (reverse), 5′-GGT GGT TGC TCT TGA TGG-3′; GAPDH (glyceraldehyde-3-phosphate dehydrogenase) (forward), 5′-CCA CCC ATG GCA AAT TCC-3′; and GAPDH (reverse), 5′-TGG GAT TTC CAT TGA TGA CAA-3′. Primers for Shh, Gli-1, Ptch-1, Smoh and GAPDH were used at temperature of 58°C, and gave expected band sizes of 308 bp, procedures for Shh, 333 bp for Ptch-1, 317 bp for Gli-1, 519 bp for Smoh and 69 bp for GAPDH. For real-time PCR, parameters were as follows: hot start at 95°C for 1 minute, followed by 45 cycles of denaturing at 95°C for 10 seconds, annealing at 58°C for 5 seconds, and extension at 72°C for 20 seconds. PCR products were detected using 2% agarose gel to confirm the expected sizes.
Triplicate crossing point values were analyzed in Microsoft Excel (Microsoft Corporation, Redmond WA, USA) using the comparative quantitative method. The amount of target was obtained by normalization to an endogenous gene (GAPDH) and relative to a calibrator. Both CD133+ cells and CD133− cells of Hepa 1–6 cells were undertaken using the procedure guide. We repeated the procedure three times on independent samples.
Protein extraction and immunoblotting
Extracts equivalent to 5 micrograms of total protein were separated by sodium dodecyl sulfate-polyacrylamide gel electrophoresis (12% acrylamide) and transferred onto a polyvinylidene difluoride membrane. The primary antibodies employed were as follows: rat-anti-prominin-1 (MAB4310; 1:200; Millipore Corporation, Billerica, MA, USA), rabbit anti-Shh (sc-9024; 1:400; Santa Cruz Biotechnology, Santa Cruz, CA, USA), rabbit anti-Smoh (sc-13943; 1:500; Santa Cruz Biotechnology), rabbit anti-human Gli-1 (sc20687; 1:400; Santa Cruz Biotechnology) and goat anti-Ptch-1 (sc-6149; 1:400; Santa Cruz Biotechnology) used in Tris-buffered saline Tween-20 (TBST) containing 5% bovine serum albumin. The membranes were then incubated with goat anti-mouse or anti-rabbit IgG (Jackson ImmunoResearch Laboratories, West Grove, PA, USA) in TBST containing 5% non-fat dry milk. Bound antibodies were detected with an enhanced chemiluminescence detection system (Millipore Corporation). After the 3,3′-Diaminobenzidine reaction, the specimens were counterstained with hematoxylin. For each antibody, negative controls were performed by omitting the primary. These controls revealed no or minimal background staining.
Nuclear localization of Gli-1 between CD133+ cells and CD133− cells
To compare the Gli-1 expression of the nucleus and cytoplasm between CD133+ cells and CD133− cells, we performed this study. Cell lysate was separated into nuclear part and cytoplasmic part according to the manufacturer’s instructions (Thermo Fisher Scientific, Pittsburgh, PA, USA). Cells were added 10 × volume of lysis buffer, vortexed on ice, and centrifuged at 500_g_, 4°C, for 7 minutes. We collected the supernatants and centrifuged at 20,000_g_, 4°C, for 15 minutes, then collected and stored the supernatants at −70°C (ie, the cytoplasmic part). The nuclear pellets were washed by nuclear washing buffer twice and centrifuged at 500_g_, 4°C, for 7 minutes. We removed the supernatants and add nuclear storage buffer, then pipetted 5–10 times. We added 1/10 volume of nuclei lysis reagent and vortexed at 4°C for 15 minutes. We centrifuged at 20,000_g_, 4°C for 5 minutes and collected supernatants (nuclear part). Then we used supernatants of both cytoplasm and nucleus to perform the western blot respectively.
Statistical analysis
Biostatistical analyses were performed using SPSS software (IBM Corporation, Armonk, NY, USA). The nonparametric Kruskal-Wallis rank test was used to detect differences among different experimental groups. Some findings were statistically significant and compared using Fisher’s exact test for evaluation in a two-group experiment. P < 0.05 was regarded as statistically significant.
Results
The mean purity of CD133+ cells sorted from Hepa 1–6 cells (sample size n = 10) was 41.05% ± 15.33% (mean ± standard deviation [SD]) with a range of 17.89% to 62.87%.
From our experiment, the mean ± SD of the number of colonies of CD133+ cells and CD133− cells were 1031.0 ± 104.7 and 119.7 ± 17.6, respectively (Figure 1A and B). The difference was found to be statistically significant (P < 0.001).
Figure 1.

Colony proliferation experiments (colony numbers). (A) For clonogenicity experiments, freshly isolated CD133+ Hepa 1–6 cells and CD133− Hepa 1–6 cells were plated at a density of 7,500 cells/well in 6 cm culture plates and cultured for 4 weeks. At the end, cells were stained with crystal violet, photographed, and analyzed for their proliferation efficiency. Each experiment was performed three times. The left shows the result of CD133+ Hepa 1–6 cells and the right shows the result of CD133− Hepa 1–6 cells. (B) The comparison of the number of colonies (mean ± SD) between CD133+ Hepa 1–6 cells and CD133− Hepa 1–6 cells is 1031.0 ± 104.7 and 119.7 ± 17.6. *The difference was found to be statistically significant (P < 0.001).
The comparison of clonogenicity between CD133+ Hepa 1–6 cells and CD133− Hepa 1–6 cells was made at the end of 20 days following the initial plating. The clonogenicity of CD133+ cells and CD133− cells was 13.7% ± 1.4% and 1.6% ± 0.2% respectively. The difference was also found to be statistically significant (P < 0.001) (Figure 2A and B).
Figure 2.

Clonogenicity between CD133+ Hepa 1–6 cells and CD133− Hepa 1–6 cells. (A) The results at the 20th day after initial plating are shown (50×). The smaller panels in (A) show representative examples of clonogenic assays magnified at 100× : the left shows the result of CD133+ Hepa 1–6 cells and the right shows that of CD133− Hepa 1–6 cells. Some blebs were present, probably the apoptic change. (B) The comparison of clonogenicity (%) (mean ± SD) between CD133+ Hepa 1–6 cells and CD133− Hepa 1–6 cells. The clonogenicity of CD133+ cells and CD133− cells is 13.7% ± 1.4% and 1.6% ± 0.2% respectively. The difference was found to be statistically significant (P < 0.001).
The values of means ± SD (range) of Shh mRNA, Ptch-1 mRNA, Gli-1 mRNA, and Smoh mRNA of CD133+ cells were 0.78 ± 0.24 (0.43–1.10), 1.13 ± 0.19 (0.88–1.43), 0.77 ± 0.28 (0.01–0.99) and 1.16 ± 0.29 (0.91–1.60) respectively. Those of CD133− cells were 1.41 ± 0.54 (0.86–2.58), 1.00 ± 0.13 (0.87–1.28), 1.05 ± 0.31 (0.71–1.73) and 0.94 ± 0.03 (0.90–0.98) respectively. Among the factors of the Shh pathway, there was a statistically significant difference between CD133+ and CD133− cells in Shh mRNA (P = 0.005) and Smoh mRNA (P = 0.043), whereas the difference of Ptch-1 mRNA and Gli-1 mRNA between CD133+ cells and CD133− cells had no or borderline statistical significance(P = 0.103, and 0.051 respectively) (Table 1).
Table 1.
Comparison of median and mean crossing point (CP) values from real-time PCR of target genes of Shh pathway between CD133+ and CD133− of Hepa 1–6 cells
| Shh/GAPDH | Ptch-1/GAPDH | Gli-1/GAPDH | Smoh/GAPDH | |||||
|---|---|---|---|---|---|---|---|---|
| CD133+ | CD133− | CD133+ | CD133− | CD133+ | CD133− | CD133+ | CD133− | |
| Median | 0.79 | 1.26 | 1.13 | 1.00 | 0.86 | 0.98 | 1.11 | 0.94 |
| Mean | 0.78 | 1.41 | 1.13 | 1.00 | 0.77 | 1.05 | 1.16 | 0.94 |
| ±SD | 0.24 | 0.54 | 0.19 | 0.13 | 0.28 | 0.31 | 0.29 | 0.03 |
| _P_-value | 0.005 | 0.103 | 0.051 | 0.043 | ||||
| 95% confidence interval | −1.023 to −0.237 | −0.023 to 0.283 | −0.558 to −0.002 | 0.026 to 0.414 |
From the western blot of the protein expression, the value of means ± SD of Shh protein expression of CD133+ cells was 0.64 ± 0.44, whereas that of CD133− cells is 0.89 ± 0.32. The difference was found to be statistically significant (P = 0.037). However, the difference of the expressions of Gli-1 protein, Ptch-1 protein, and Smoh protein between CD133+ cells and CD133− cells had no statistical significance (Table 2).
Table 2.
Comparison of median and mean protein values from western blot of target genes of Shh pathway between CD133+ and CD133− of Hepa 1–6 cells
| Shh/actin | Ptch-1/actin | Gli-1/actin | Smoh/actin | |||||
|---|---|---|---|---|---|---|---|---|
| CD133+ | CD133− | CD133+ | CD133− | CD133+ | CD133− | CD133+ | CD133− | |
| Median | 0.32 | 0.64 | 0.14 | 0.09 | 0.26 | 0.36 | 0.23 | 0.24 |
| Mean | 0.64 | 0.89 | 1.14 | 0.09 | 0.27 | 0.34 | 0.17 | 0.23 |
| ±SD | 0.32 | 0.44 | 0.15 | 0.02 | 0.10 | 0.11 | 0.12 | 0.13 |
| _P_-value | 0.037 | 0.675 | 0.45 | 0.586 | ||||
| 95% confidence interval | 0.21 to 3.81 | −0.031 to 0.264 | 0.196 to 0.408 | 0.080 to 0.321 |
Figure 3 demonstrates the RT-PCR expression of the four genes. The expressions of Shh and Smoh between these two kinds of cells has statistical significance. Figure 4 shows the expression of proteins with western blotting. Only the difference of Shh between CD133+ Hepa 1–6 cells and CD133− Hepa 1–6 cells was found to be statistically significant.
Figure 3.
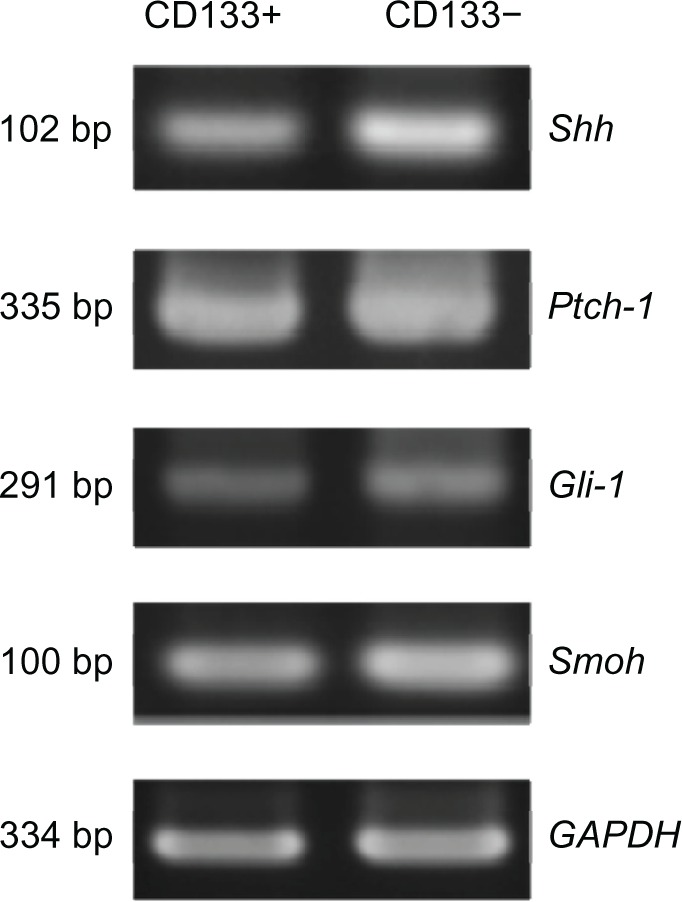
Semi quantitative reverse transcription polymerase chain reaction analysis of mRNA expression of Shh pathway of CD133+ and CD133− of Hepa 1–6 cells. The difference of Shh mRNA and Smoh mRNA expressions between CD133+ Hepa 1–6 cells and CD133− Hepa 1–6 cells is statistically significant.
Abbreviations: mRNA, messenger ribonucleic acid; Shh, sonic hedgehog; Ptch-1, patched homolog 1; Gli-1, glioma-associated oncogene homolog 1; Smoh, smoothened homolog; GAPDH, glyceraldehyde-3-phosphate dehydrogenase.
Figure 4.
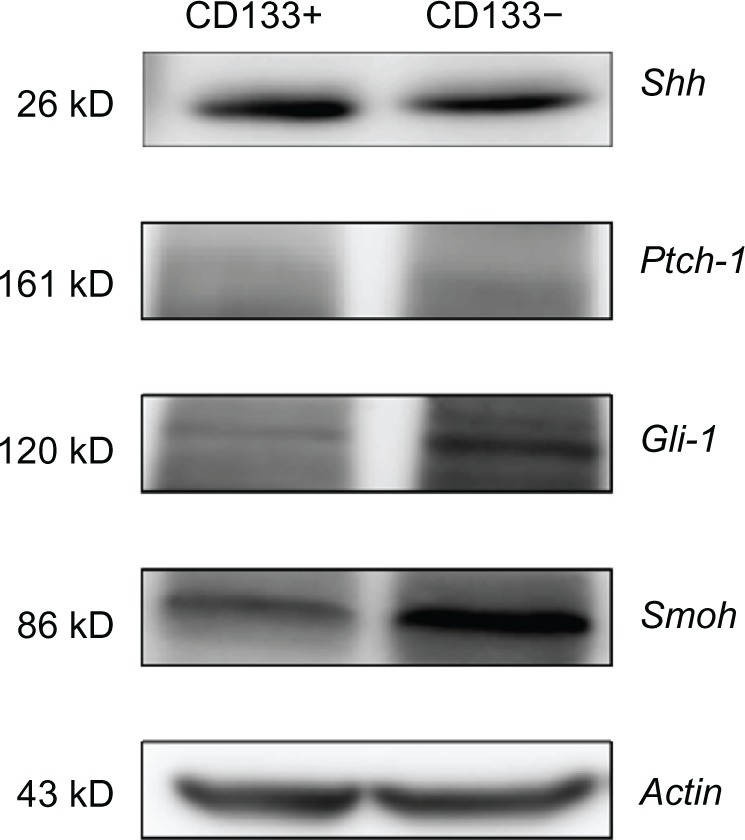
Western blot showing the Shh pathway related protein expression of CD133+ Hepa 1–6 cells and CD133− Hepa 1–6 cells. The difference of Shh protein expression between CD133+ Hepa 1–6 cells and CD133− Hepa 1–6 cells is statistically significant.
Abbreviations: Shh, sonic hedgehog; Ptch-1, patched homolog 1; Gli-1, glioma-associated oncogene homolog 1; Smoh, smoothened homolog.
Figure 5 demonstrates the Gli-1 protein expression of CD133+ cells and CD133− cells in the nucleus and the cytoplasm respectively. The Gli-1 expression was higher in the CD133− cells in both nucleus and cytoplasm, not similar to the result of the real-time PCR (Table 1) and that of the western blot of the whole cells (Table 2).
Figure 5.
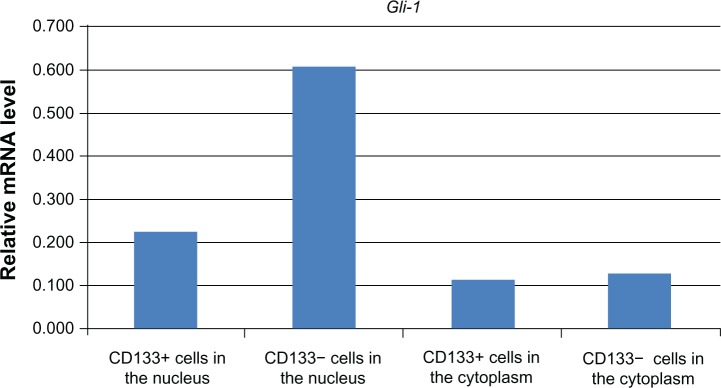
Comparison of Gli-1 mRNA expression of CD133+ and CD133− cells in the nucleus and the cytoplasm respectively. The Gli-1 expression was higher in CD133− cells than in CD133+ cells in both the nucleus and the cytoplasm.
Note: n = 4.
Abbreviation:Gli-1, glioma-associated oncogene homolog 1; mRNA, messenger ribonucleic acid.
Discussion
From this study, activation of the Shh pathway occurs in CD133+ Hepa 1–6 cells that harbor the stem cell feature. Among the factors of the pathway, Shh and Smoh play significant contributory roles in the activation.
In our study, the sorting rate of CD133+ cells from all Hepa 1–6 cells is not high (under 2%). From the amount perspective, it means that these “cancer stem cells” may be only a small population among all cancer cells. This finding is similar to some investigators’ findings.26–30
The existence of cancer stem cells has been demonstrated in various organ malignancies including breast, blood, brain, prostate, colon, and pancreatic.29–35 Some authors believe that cancer stem cells may be derived from normal stem cells through mutations.10 There are many various cancer stem cell markers such as CD133, Oct 4, EpCAM, etc.5,7,8,11–19 We established our hypothesis as CD133 which has been suggested as a marker for liver cancer stem cells.13–15,17 Ma et al, demonstrated that freshly isolated CD133+ cells possess characteristics similar to those of stem/progenitor cells.26 In addition, Piao et al, found that CD133+ liver cancer stem cells may modulate radio-resistance in human HCC.17 Suetsugu et al, found that only HuH7 cells with CD133+ could form tumors in SCID mice.13,14 Kim et al, reported that CD133+ cells sorted from either HuH7 or PLC5 cell lines showed increased tumorigenicity and clonogenicity when compared to CD133− cells.36 Similarly, from our soft agar study, CD133+ cells have significantly higher colony proliferation and the clonogenicity (Figures 1 and 2), which may suggest a higher tumorigenicity.
The Shh pathway implicating hepatocarcinogenesis has been reported.22–24 Some authors mentioned that the activation of the Shh pathway may occur in human HCC.1,22–24,37 Che et al found that Shh, Ptch-1, and Gli-1 are overexpressed in human HCC.22 The correlation between Shh pathway factors and the invasiveness of HCC has been variably reported.1,22,23,37 Some researchers found Shh signaling pathway activation correlated with tumor size, capsular invasion, and vascular invasion. The correlation of the Shh pathway factors (Shh, Ptch-1, and Gli-2) and portal venous invasion or poor differentiation has also been reported.37
From our study, the expressions of Shh mRNA and Smoh mRNA are significantly different between CD133+ and CD133− cells. According to the definition of Huang et al, activation of the shh pathway occurring in CD133+ Hepa 1–6 cells may be defined.24 These two factors of the pathway may participate in the activation. To explain the lower expression of Shh mRNA and the higher expression of Smoh mRNA in CD133+ cells, we proposed some possible mechanisms. The first is the complex interactions among the factors of the Shh pathways. Ptch-1 activation predisposes a cell to proliferative and expansive behavior.38,39 Some interactions between Smoh and Ptch-1 are not fully understood. In our study, expression of Ptch-1 mRNA of CD133+ cells is higher than CD133− cells without statistical significance. Smoh is an intracellular substrate that migrates to the cellular membrane where it becomes active after engagement of Ptch-1 by Shh. At the cellular membrane, the activated Smoh triggers the downstream transcription of Gli-1 proteins.38,39 Aberrant activation of the pathway leads Gli-1 into the nucleus to promote gene transcriptions and to maintain the biological behaviors of cancer cells. Gli-1 is a well-known target gene of the Shh pathway.1,22–24 The high expressions of Gli-1 mRNA in other cancers adversely affect recurrence.1,40 Whereas, from our study, a lower expression of Gli-1 of CD133− cells is noted (Table 1 and 2). Nuclear Gli-1 activity of CD133+ cells is significantly lower than that of CD133− cells (Figure 5). Gli-1 plays a role in proliferation, survival, and migration of some cancers.41 However, the Shh expression varied not only among different cancers but also between mouse hepatoma and human hepatoma.40–44 To analyze the activation of Smoh, hyperphosphorylation study may be another option.
The second possibility is that the changes of the mRNA expression may be dynamic. The timing of tumor cell sorting study may affect the sorted cell varieties. Huang suggested that the activation occurs in the early stage of HCC.24 The degree of the Shh pathway activation may differ among different stages of the same cancer and among different malignancies at the same stage.22–24,42,44–47 This idea remains controversial. Kim et al reported that the expression of Shh and Gli-1 was independent of tumor stage and cell differentiation in extrahepatic biliary tract cancer cells.46 Thayer et al, considered that the activation of the Shh pathway occurs as both an early and late mediator in pancreatic carcinogenesis.44 Whereas, the Shh pathway activates in advanced stages of gastric cancer or prostate cancer, etc.42,44–47
The third possibility affecting our expression of the Shh pathway is the hypothesis that the Shh pathway activation occurs only in “cancer stem cells”. The lung cancer study of Tian et al, showed that the Shh pathway is activated mainly in the “cancer stem cells” and not in every cancer cell.25 Shackleton et al emphasized the heterogeneity of cancer cells.28
According to the study by Che et al, in HCC tissues, protein expressions are compatible with mRNA.22 Our protein study showed a significantly lower expression of Shh of CD133+ Hepa 1–6 cells. In our study, the protein expressions of Ptch-1, Gli-1, and Smoh were too small to compare. Ptch-1 is a membrane protein. Western blot is not sensitive in detecting the membrane protein. Therefore, the real-time PCR may measure a greater amount than western blot, which results in a discrepancy between the mRNA expression (realtime PCR) and protein expression (western blot). Probably, the real-time PCR is more sensitive than western blot in detecting the small amount of protein. Further experiments on cell growth of CD133+ and CD133− cells using siRNA of Smoh should be studied in the future.
Conclusion
From our study, CD133+ Hepa 1–6 cells have a significantly higher clonogenicity, and are probably more tumorigenic. The Shh pathway is activated in these cells, which harbor stem cell features, with an underexpression of Shh mRNA and an overexpression of Smoh mRNA. Blockade of the Shh signaling pathway has been tried in various previous in vitro studies.48–51 It may be a potential clinical therapeutic strategy for hepatocarcinogenesis.
Acknowledgments
The authors would like to acknowledge support, including a research grant, from the Far Eastern Memorial Hospital (New Taipei City, Taiwan) (FEMH-98-SCRM-A-004).
Author contributions
Conception and design, KS Jeng, IS Sheen, WJ Jeng; provision of study materials, MC Yu, HI Hsiau, FY Chang, HH Tsai; acquisition of data, MC Yu, HI Hsiau, FY Chang, HH Tsai; analysis and interpretation of data, MC Yu, HI Hsiau, IS Sheen, WJ Jeng; manuscript writing, KS Jeng; critical revision of manuscript, IS Sheen, WJ Jeng, MC Yu, HI Hsiau, FY Chang, HH Tsai; final approval of manuscript, all authors.
Disclosure
The authors declare that they have no conflicts of interest in this work.
References
- 1.Jeng KS, Sheen IS, Jeng WJ, et al. High expression of patched homolog-1 messenger RNA and glioma-associated oncogene-1 messenger RNA of sonic hedgehog signaling pathway indicate a risk of postresection recurrence of hepatocellular carcinoma. Ann Surg Oncol. 2013;20:464–473. doi: 10.1245/s10434-012-2593-y. [DOI] [PubMed] [Google Scholar]
- 2.Venook AP, Papandreou C, Furuse J, de Guevara LL. The incidence and epidemiology of hepatocellular carcinoma: a global and regional perspective. Oncologist. 2010;15:5–13. doi: 10.1634/theoncologist.2010-S4-05. [DOI] [PubMed] [Google Scholar]
- 3.Parkin DM, Bray F, Ferlay J, Pisani P. Estimating the world cancer burden: Globocan 2000. Int J Cancer. 2001;94:153–156. doi: 10.1002/ijc.1440. [DOI] [PubMed] [Google Scholar]
- 4.Zhao R, Duncan SA. Embryonic development of the liver. Hepatology. 2005;41:956–967. doi: 10.1002/hep.20691. [DOI] [PubMed] [Google Scholar]
- 5.Tsai RY. A molecular view of stem cell and cancer cell self-renewal. Int J Biochem Cell Biol. 2004;36:684–694. doi: 10.1016/j.biocel.2003.10.016. [DOI] [PubMed] [Google Scholar]
- 6.Pardal R, Clarke MF, Morrison SJ. Applying the principles of stem-cell biology to cancer. Nat Rev Cancer. 2003;3:895–902. doi: 10.1038/nrc1232. [DOI] [PubMed] [Google Scholar]
- 7.Reya T, Morrison SJ, Clarke MF, Weissman IL. Stem cells, cancer and cancer stem cells. Nature. 2001;414:105–111. doi: 10.1038/35102167. [DOI] [PubMed] [Google Scholar]
- 8.Tai MH, Chang CC, Kiupel M, Webster JD, Olson LK, Trosko JE. Oct 4 expression in adult human stem cells: evidence in support of the stem cell theory of carcinogenesis. Carcinogenesis. 2005;26:495–502. doi: 10.1093/carcin/bgh321. [DOI] [PubMed] [Google Scholar]
- 9.Mishra L, Banker T, Murray J, et al. Liver stem cells and hepatocellular carcinoma. Hepatology. 2009;49(1):318–329. doi: 10.1002/hep.22704. [DOI] [PMC free article] [PubMed] [Google Scholar]
- 10.Alison MR. Liver stem cells: implications for hepatocarcinogenesis. Stem Cell Rev. 2005;1:253–260. doi: 10.1385/SCR:1:3:253. [DOI] [PubMed] [Google Scholar]
- 11.Grey BR, Oates JE, Brown MD, Clarke NW. CD133: a marker of transit amplification rather than stem cell phenotype in the prostate? BJU Int. 2009;103:856–858. doi: 10.1111/j.1464-410X.2008.08250.x. [DOI] [PubMed] [Google Scholar]
- 12.Beier D, Hau P, Proescholdt M, et al. CD133(+) and CD133(−) glioblastoma-derived cancer stem cells show differential growth characteristics and molecular profiles. Cancer Res. 2007;67:4010–4015. doi: 10.1158/0008-5472.CAN-06-4180. [DOI] [PubMed] [Google Scholar]
- 13.Suetsugu A, Nagaki M, Aoki H, Motohashi T, Kunisada T, Moriwaki H. Characterization of CD133+ hepatocellular carcinoma cells as cancer stem/progenitor cells. Biochem Biophys Res Commun. 2006;351:820–824. doi: 10.1016/j.bbrc.2006.10.128. [DOI] [PubMed] [Google Scholar]
- 14.Suetsugu A, Nagaki M, Aoki H, et al. CD133 positive hepatocellular carcinoma cells possess high capacity for tumorigenicity. Int J Cancer. 2007;120:1444–1450. doi: 10.1002/ijc.22476. [DOI] [PubMed] [Google Scholar]
- 15.Ma S, Chan KW, Lee TK, et al. Aldehyde dehydrogenase discriminates the CD133 liver cancer stem cell populations. Mol Cancer Res. 2008;6:1146–1153. doi: 10.1158/1541-7786.MCR-08-0035. [DOI] [PubMed] [Google Scholar]
- 16.Shmelkov SV, Butler JM, Hooper AT, et al. CD133 expression is not restricted to stem cells, and both CD133+ and CD133− metastatic colon cancer cells initiate tumors. J Clin Invest. 2008;118:2111–2120. doi: 10.1172/JCI34401. [DOI] [PMC free article] [PubMed] [Google Scholar]
- 17.Piao LS, Hur W, Kim TK, et al. CD133+ liver cancer stem cells modulate radioresistance in human hepatocellular carcinoma. Cancer Lett. 2012;28315:129–137. doi: 10.1016/j.canlet.2011.10.012. [DOI] [PubMed] [Google Scholar]
- 18.Clayton S, Mousa SA. Therapeutics formulated to target cancer stem cells: Is it in our future? Cancer Cell Int. 2011;11:7. doi: 10.1186/1475-2867-11-7. [DOI] [PMC free article] [PubMed] [Google Scholar]
- 19.Gilbert CA, Ross AH. Cancer stem cells: cell culture, markers, and targets for new therapies. J Cell Biochem. 2009;108:1031–1038. doi: 10.1002/jcb.22350. [DOI] [PMC free article] [PubMed] [Google Scholar]
- 20.Ingham PW. Transducing Hedgehog: the story so far. EMBO J. 1998;17:3505–3511. doi: 10.1093/emboj/17.13.3505. [DOI] [PMC free article] [PubMed] [Google Scholar]
- 21.Harmon EB, Ko AH, Kim SK. Hedgehog signaling in gastrointestinal development and disease. Curr Mol Med. 2002;2:67–82. doi: 10.2174/1566524023363130. [DOI] [PubMed] [Google Scholar]
- 22.Che L, Ren J, Yuan YH, et al. Expression of genes related to sonic hedgehog signaling in human hepatocellular carcinomas. [Article in Chinese] Beijing Da Xue Xue Bao. 2008;40:616–623. [PubMed] [Google Scholar]
- 23.Sicklick JK, Li YX, Jayaraman A, et al. Dysregulation of the hedgehog pathway in human hepatocarcinogenesis. Carcinogenesis. 2006;27:748–757. doi: 10.1093/carcin/bgi292. [DOI] [PubMed] [Google Scholar]
- 24.Huang S, He J, Zhang X, et al. Activation of the hedgehog pathway in human hepatocellular carcinomas. Carcinogenesis. 2006;27:1334–1340. doi: 10.1093/carcin/bgi378. [DOI] [PubMed] [Google Scholar]
- 25.Tian F, Mysliwietz J, Ellwart J, Gamarra F, Huber RM, Bergner A. Effects of the Hedgehog pathway inhibitor GDC-0449 on lung cancer cell lines are mediated by side populations. Clin Exp Med. 2012;12:25–30. doi: 10.1007/s10238-011-0135-8. [DOI] [PubMed] [Google Scholar]
- 26.Ma S, Chan KW, Hu L, et al. Identification and characterization of tumorigenic liver cancer stem/progenitor cells. Gastroenterology. 2007;132:2542–2556. doi: 10.1053/j.gastro.2007.04.025. [DOI] [PubMed] [Google Scholar]
- 27.Yang Z F, Ngai P, Ho DW, et al. Identification of local and circulating cancer stem cells in human liver. Hepatology. 2008;47:919–928. doi: 10.1002/hep.22082. [DOI] [PubMed] [Google Scholar]
- 28.Shackleton M, Quintana E, Fearon ER, Morrison SJ. Heterogeneity in cancer: cancer stem cells versus clonal evolution. Cell. 2009;138:822–829. doi: 10.1016/j.cell.2009.08.017. [DOI] [PubMed] [Google Scholar]
- 29.Singh SK, Hawkins C, Clarke ID, et al. Identification of human brain tumor initiating cells. Nature. 2004;432:396–401. doi: 10.1038/nature03128. [DOI] [PubMed] [Google Scholar]
- 30.Abdul Khalek FJ, Gallicano GI, Mishra L. Colon cancer stem cells. Gastrointest Cancer Res. 2010;(Suppl 1):S16–S23. [PMC free article] [PubMed] [Google Scholar]
- 31.Li Z, Liu Y, Tuve, et al. Toward a stem cell gene therapy for breast cancer. Blood. 2009;113:5423–5433. doi: 10.1182/blood-2008-10-187237. [DOI] [PMC free article] [PubMed] [Google Scholar]
- 32.Lam BS, Adams GB. Blocking HIF1α activity eliminates hematological cancer stem cells. Cell Stem Cell. 2011;8:354–356. doi: 10.1016/j.stem.2011.03.006. [DOI] [PubMed] [Google Scholar]
- 33.Tafani M, Di Vito M, Frati A, et al. Pro-inflammatory gene expression in solid glioblastoma microenvironment and in hypoxic stem cells from human glioblastoma. J Neuroinflammation. 2011;8:32. doi: 10.1186/1742-2094-8-32. [DOI] [PMC free article] [PubMed] [Google Scholar]
- 34.Li H, Tang DG. Prostate cancer stem cells and their potential roles in metastasis. J Surg Oncol. 2011;103:558–562. doi: 10.1002/jso.21806. [DOI] [PubMed] [Google Scholar]
- 35.Zhang SN, Huang FT, Huang YJ, Zhong W, Yu Z. Characterization of a cancer stem cell-like side population derived from human pancreatic adenocarcinoma cells. Tumori. 2010;96:985–992. [PubMed] [Google Scholar]
- 36.Yin S, Li J, Hu C, et al. CD133 positive hepatocellular carcinoma cells possess high capacity for tumorigenicity. Int J Cancer. 2007;120:1444–1450. doi: 10.1002/ijc.22476. [DOI] [PubMed] [Google Scholar]
- 37.Cheng WT, Xu K, Tian DY, Zhang ZG, Liu LJ, Chen Y. Role of hedgehog signaling pathway in proliferation and invasiveness of hepatocellular carcinoma cells. Int J Oncol. 2009;34:829–836. doi: 10.3892/ijo_00000209. [DOI] [PubMed] [Google Scholar]
- 38.Bale AE, Yu KP. The hedgehog pathway and basal cell carcinomas. Hum Mol Genet. 2001;10:757–762. doi: 10.1093/hmg/10.7.757. [DOI] [PubMed] [Google Scholar]
- 39.Taipale J, Beachy PA. The Hedgehog and Wnt signalling pathways in cancer. Nature. 2001;411:349–354. doi: 10.1038/35077219. [DOI] [PubMed] [Google Scholar]
- 40.Ten Haaf A, Bektas N, von Serenyi S, et al. Expression of the glioma-associated oncogene homolog (GLI) 1 in human breast cancer is associated with unfavourable overall survival. BMC Cancer. 2009;9:298. doi: 10.1186/1471-2407-9-298. [DOI] [PMC free article] [PubMed] [Google Scholar]
- 41.Thomas ZI, Gibson W, Sexton JZ, et al. Targeting GLI1 expression in human inflammatory breast cancer cells enhances apoptosis and attenuates migration. Br J Cancer. 2011;104:1575–1586. doi: 10.1038/bjc.2011.133. [DOI] [PMC free article] [PubMed] [Google Scholar]
- 42.Bailey JM, Mohr AM, Hollingsworth MA. Sonic hedgehog paracrine signaling regulates metastasis and lymphangiogenesis in pancreatic cancer. Oncogene. 2009;28:3513–3525. doi: 10.1038/onc.2009.220. [DOI] [PMC free article] [PubMed] [Google Scholar]
- 43.Jeng KS, Sheen IS, Jeng WJ, et al. Blockade of sonic hedgehog pathway effectively inhibits the growth of hepatoma in mice: An in vivo study. Oncol Lett. 2012;4:1158–1162. doi: 10.3892/ol.2012.935. [DOI] [PMC free article] [PubMed] [Google Scholar]
- 44.Thayer SP, di Magliano MP, Heiser PW, et al. Hedgehog is an early and late mediator of pancreatic cancer tumorigenesis. Nature. 2003;425:851–856. doi: 10.1038/nature02009. [DOI] [PMC free article] [PubMed] [Google Scholar]
- 45.Karhadkar SS, Bova GS, Abdallah N, et al. Hedgehog signalling in prostate regeneration, neoplasia and metastasis. Nature. 2004;431:707–712. doi: 10.1038/nature02962. [DOI] [PubMed] [Google Scholar]
- 46.Kim YJ, Park SB, Park JY, et al. The sonic hedgehog pathway as a treatment target for extrahepatic biliary tract cancer. Mol Med Rep. 2012;5:12–16. doi: 10.3892/mmr.2011.598. [DOI] [PubMed] [Google Scholar]
- 47.Ma X, Chen K, Huang S, et al. Frequent activation of the hedgehog pathway in advanced gastric adenocarcinomas. Carcinogenesis. 2005;26:1698–1705. doi: 10.1093/carcin/bgi130. [DOI] [PubMed] [Google Scholar]
- 48.Chen XL, Cheng QY, She MR, et al. Expression of sonic hedgehog signaling components in hepatocellular carcinoma and cyclopamine-induced apoptosis through Bcl-2 downregulation in vitro. Arch Med Res. 2010;41:315–323. doi: 10.1016/j.arcmed.2010.06.003. [DOI] [PubMed] [Google Scholar]
- 49.Kim Y, Yoon JW, Xiao X, Dean NM, Monia BP, Marcusson EG. Selective down-regulation of glioma-associated oncogene 2 inhibits the proliferation of hepatocellular carcinoma cells. Cancer Res. 2007;67:3583–3593. doi: 10.1158/0008-5472.CAN-06-3040. [DOI] [PubMed] [Google Scholar]
- 50.Wang Q, Huang S, Yang L, et al. Down-regulation of Sonic hedgehog signaling pathway activity is involved in 5-fluorouracil-induced apoptosis and motility inhibition in Hep3B cells. Acta Biochim Biophys Sin (Shanghai) 2008;40:819–829. [PubMed] [Google Scholar]
- 51.Eichenmüller M, Gruner I, Hagl B, et al. Blocking the hedgehog pathway inhibits hepatoblastoma growth. Hepatology. 2009;49:482–490. doi: 10.1002/hep.22649. [DOI] [PubMed] [Google Scholar]