Developmental Programming by Maternal Insulin Resistance: Hyperinsulinemia, Glucose Intolerance, and Dysregulated Lipid Metabolism in Male Offspring of Insulin-Resistant Mice (original) (raw)
Abstract
Maternal obesity and gestational diabetes mellitus (GDM) are associated with obesity and diabetes risk in offspring. We tested whether maternal insulin resistance, which frequently coexists with GDM and obesity, could independently contribute to dysregulation of offspring metabolism. Female mice haploinsufficient for insulin receptor substrate-1 (IRS1-het) are hyperinsulinemic and insulin resistant during pregnancy, despite normal plasma glucose and body weight, and thus serve as a model of isolated maternal insulin resistance. Wild-type (WT) offspring of IRS1-het dams insulin resistance-exposed [IR-exposed] were compared with WT offspring of WT dams. Despite no differences in adiposity, male IR-exposed pups were glucose intolerant (P = 0.04) and hyperinsulinemic (1.3-fold increase, P = 0.02) by 1 month of age and developed progressive fasting hyperglycemia. Moreover, male IR-exposed pups challenged with high-fat diet exhibited insulin resistance. Liver lipidomic analysis of 3-week-old IR-exposed males revealed increases in the 16:1n7 fraction of several lipid classes, suggesting increased Scd1 activity. By 6 months of age, IR-exposed males had increased lipid accumulation in liver as well as increased plasma refed fatty acids, consistent with disrupted lipid metabolism. Our results indicate that isolated maternal insulin resistance, even in the absence of hyperglycemia or obesity, can promote metabolic perturbations in male offspring.
Introduction
The prenatal environment is increasingly recognized as a risk factor for chronic disease in offspring (1). Early life undernutrition, overnutrition, or dysregulated metabolism during critical developmental windows may increase disease risk (2). For example, gestational diabetes mellitus (GDM), excessive gestational weight gain, and maternal obesity (3–5) are all associated with increased risk of obesity and/or glucose intolerance in offspring.
In human studies, dissecting the relative contributions of genetics, diet, and the maternal metabolic environment (e.g., glucose, lipids, insulin resistance, and other hormones) to offspring phenotypes is challenging, given that these factors often coexist. Several groups have controlled for shared genetics by comparing siblings discordant for maternal GDM (6,7) or siblings born before versus after maternal bariatric surgery (8); individuals exposed to a diabetic or “obese” prenatal environment are at greater risk for obesity and diabetes than unexposed siblings, suggesting that maternal-to-child transmission of metabolic disease is not solely explained by shared genetics. Experimental models provide an opportunity to assess how specific features of the maternal environment contribute to offspring disease. Maternal hyperglycemia due to β-cell dysfunction increases risk of glucose intolerance in offspring (9,10). Similarly, high-fat feeding during pregnancy is associated with offspring obesity and glucose intolerance (11), inflammation (12), altered hypothalamic signaling (13), and hepatic lipogenesis (14). However, high-fat diet not only promotes maternal obesity but also alters glycemia, insulin sensitivity, inflammation, gut flora, and other aspects of systemic metabolism, so that the primary driver of offspring risk remains unclear.
Insulin resistance is one potential mediator, as it is common to GDM (15), excessive gestational weight gain (16), obesity (17), and high-fat feeding (18). However, the contribution of isolated maternal insulin resistance, without hyperglycemia or obesity, has not been extensively studied. In one report, maternal insulin resistance was associated with subtle changes in orexigenic signaling and glucose homeostasis in offspring mice (19). Whether maternal insulin resistance contributes to dysmetabolism in offspring is a key question given recent epidemic increases in T2DM and metabolic syndrome (20). Importantly for public health, risk factor modification during pregnancy may be easier to implement and has the potential to prevent disease not only in mothers but also in their children.
To test whether isolated maternal insulin resistance during pregnancy increases metabolic risk in offspring, we used a mouse model of genetic insulin resistance. We hypothesized that prenatal exposure to insulin resistance confers increased risk for metabolic perturbations in offspring. Mice haploinsufficient for insulin receptor substrate-1 (IRS1-het) have normal body weight, length, and fasting glycemia but develop fasting hyperinsulinemia and insulin resistance by 2 months of age due to a 60% reduction in IRS-1 (21–23). During pregnancy, IRS1-het females are normoglycemic but insulin resistant. Wild-type (WT) male offspring of IRS1-het females developed glucose intolerance, hyperinsulinemia, and altered lipid metabolism. Our results indicate that isolated maternal insulin resistance, in the absence of hyperglycemia or obesity, can promote metabolic disease in male offspring.
Research Design and Methods
Animal Model
Female IRS1-het mice were bred to WT C57Bl/6J males. WT offspring of these breedings are termed “insulin resistance-exposed (IR-exposed).” WT offspring of C57Bl/6J pairs served as controls. All mice were bred beginning at 8 weeks of age and cohoused until pregnancy was detected. This strategy yielded an age window of 8–15 weeks for mothers, an interval during which plasma glucose is stable. To minimize potential intergenerational transmission of metabolic phenotypes via the female lineage, the colony was maintained through WT-female and IRS1-het male matings; IRS1-het dams used for experimental matings were offspring of WT females and IRS1-het males. Litter size was normalized to between five and six at birth. Mice were genotyped by PCR (21). Experimental data presented in this article were obtained from 86 independent pregnancies. Multiple cohorts of mice were bred over several years; some cohorts were dedicated primarily to characterizing maternal and fetal phenotypes, whereas others were focused on postnatal phenotypes. Data on maternal characteristics during pregnancy represent 57 independent pregnancies (n = 28 WT and n = 29 IRS1-het); data on offspring phenotypes represent 29 independent pregnancies (16 control and 13 IR-exposed litters). Due to the potential stress of metabolic assessments (e.g., blood sampling, dual-energy X-ray absorptiometry, and insulin tolerance), we did not study the offspring of dams undergoing metabolic testing during pregnancy. For all experiments, multiple litters were analyzed (range 2–16 litters per group, indicated in figure legends). Initial experiments were performed in offspring of both sexes, but subsequent studies were performed in males after finding that they were more severely affected than females. Data presented in this article are for male offspring only. Fertility and lactation capacity are normal in IRS1-het dams (24). Pups were weaned to either standard chow (Laboratory Diets 5020) or high-fat, high-sucrose (HFHS) diet containing 58% fat and 25% carbohydrate (% kcal; D12331; Research Diets, New Brunswick, NJ) (25) at 3 weeks of age. Animals were housed in an Office of Laboratory Animal Welfare-approved facility with a 12-h light-dark cycle. All protocols were approved by Joslin Institutional Animal Care and Use Committee.
Metabolic Assessments
Body composition was measured using dual-energy X-ray absorptiometry (GE Lunar, Joslin Physiology Core). Resting energy expenditure, VO2, VCO2, food intake, and activity were measured in metabolic cages (CLAMS, Columbus OH). Glucose and insulin tolerance were assessed by intraperitoneal glucose tolerance test (IP-GTT, 1 or 2 g/kg glucose, as indicated), oral GTT (2 g/kg glucose via gavage, males only), or intraperitoneal insulin tolerance test (IP-ITT, 1 unit/kg Humulin R; Eli Lilly and Company). Pyruvate tolerance (pyruvate tolerance test) was assessed in males after intraperitoneal injection (1.5 g/kg). GTT and pyruvate tolerance test were performed after a 16-h fast; ITT was performed 2 h after food removal. Commercial kits were used to measure plasma insulin (Crystal Chem 90080), adipokines (Millipore MADPK-71K), and nonesterified fatty acids (WAKO Diagnostics). Plasma metabolites were assayed using liquid chromatography–mass spectroscopy (Metabolon, Inc.), and liver lipids were analyzed by liquid chromatography separation of lipid classes followed by gas chromatography-flame ionization detector quantification of fatty acid composition (Lipomics, Inc., for 3-week samples; Vanderbilt Mouse Metabolic Phenotyping Center for 6-month samples). Liver triglycerides were measured in chloroform-methanol extracts using a colorimetric assay (Cayman Chemical).
Histology
Liver and gonadal fat were dissected, fixed in 10% formalin, paraffin embedded, and stained with hematoxylin and eosin (Harvard University Rodent Histopathology Core).
Real-Time PCR
RNA was isolated from liver and adipose (Trizol; Life Technologies, Grand Island, NY) for cDNA synthesis (ABI High Capacity cDNA Reverse Transcription Kit, Carlsbad, CA) and quantitative real-time PCR (ABI SYBRGreen Mastermix and 7900HT Thermocycler). Values were normalized to a housekeeping gene, as indicated. See Supplementary Table 2 for primer sequences.
Statistics
Data are expressed as mean ± SEM. Between-group comparisons were analyzed using two-sided unpaired Student t test (Microsoft Excel); P < 0.05 was considered significant. Time-dependent tests (e.g., GTT and ITT) were additionally analyzed using glucose area under the curve (AUC), calculated using trapezoidal integration, and repeated measures ANOVA (Statview; SAS Institute, Cary, NC), shown in legends. False discovery rates for metabolomic and lipidomic data sets were calculated using Q-value software (http://genomics.princeton.edu/storeylab/qvalue/) (26).
Results
IRS1-het Females Are Insulin Resistant During Pregnancy
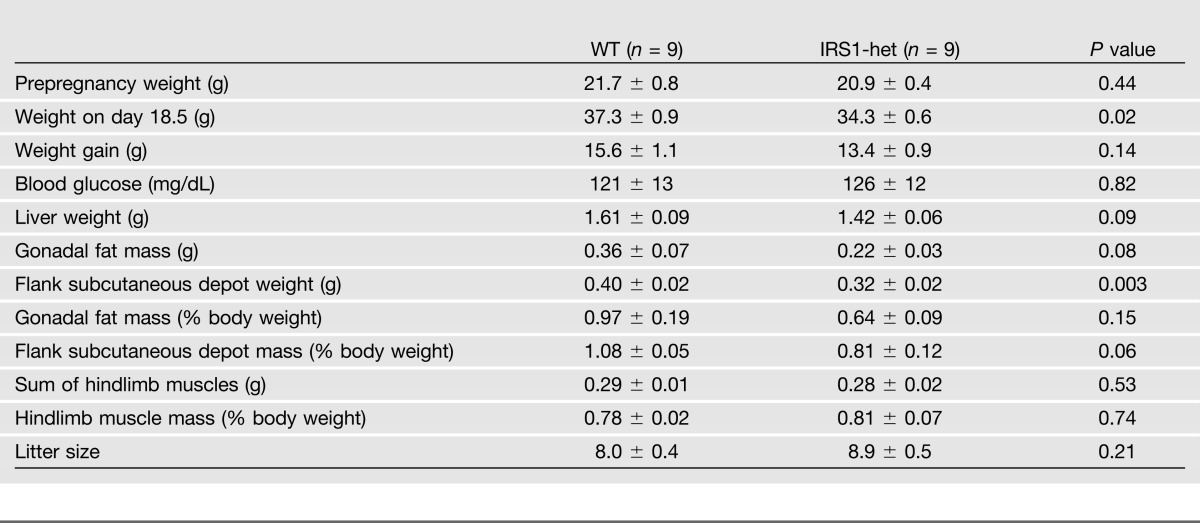
To assess whether prenatal exposure to insulin resistance increases susceptibility to metabolic disease in offspring, we bred IRS1-het female mice with WT C57Bl/6J males and bred WT pairs as controls (Fig. 1_A_). Random-fed blood glucose was similar between control and IRS1-het females on both pregnancy days 16.5 (control, 114 ± 11; IRS1-het, 120 ± 7 mg/dL; P = 0.64) (Fig. 1_B_) and 18.5 (control, 121 ± 13; IRS1-het, 126 ± 12 mg/dL; P = 0.82) (Table 1). On day 16.5, IRS1-het females were insulin resistant, as indicated by a 2.4-fold increase in plasma insulin (control, 1.3 ± 0.2; IRS1-het, 3.1 ± 0.4 ng/mL; P = 0.004) (Fig. 1_C_) and significantly impaired insulin tolerance (AUC P = 0.04) (Fig. 1_D_). Insulin resistance in IRS1-het dams was not accompanied by obesity, with similar body weight as controls at breeding (control, 21.7 ± 0.8; IRS1-het, 20.9 ± 0.4 g; P = 0.44). Despite similar litter size (control, 8.0 ± 0.4; IRS1-het, 8.9 ± 0.5; P = 0.21), IRS1-het females weighed less by day 18.5 of pregnancy (control, 37.3 ± 0.9; IRS1-het, 34.3 ± 0.6 g; P = 0.02) and had slightly lower adiposity, with reduced subcutaneous adipose (control, 0.40 ± 0.02; IRS1-het, 0.32 ± 0.02 g; P = 0.003) and a trend for reduced gonadal fat (control, 0.36 ± 0.07; IRS1-het, 0.22 ± 0.03 g; P = 0.08) (Table 1). Thus, IRS1-het females provide a model of insulin resistance during pregnancy without confounding by obesity or hyperglycemia.
Figure 1.
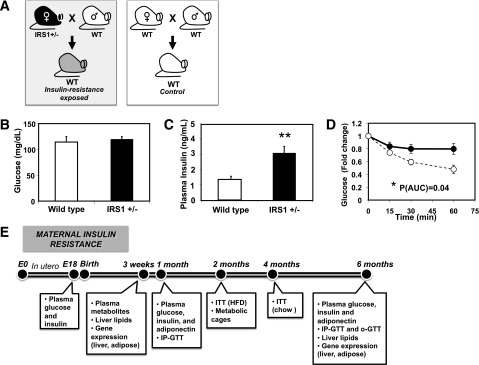
Model of in utero exposure to maternal insulin resistance. A: Schematic model of gestational insulin resistance. B: Maternal blood glucose, E16.5. n = 4–5 per group. C: Maternal plasma insulin, E16.5. n = 4–5 per group. **P = 0.004. D: Glycemic response during IP-ITT, pregnancy day 16.5. n = 6 per group. IRS1 het, black circles and solid line; WT, open circles and dashed line. *P = 0.04 for AUC; P = 0.06 for repeated measures ANOVA. E: Experimental time line for physiological assessments in offspring mice. HFD, high-fat diet; o-GTT, oral GTT.
Table 1.
Maternal characteristics during pregnancy, day 18.5
Male Offspring of Insulin-Resistant Mothers Have Similar Body Weight as Controls, Even With Obesogenic Diet
Birth weight did not differ in male offspring exposed to maternal insulin resistance (IR-exp) (control, 1.32 ± 0.02; IR-exp, 1.35 ± 0.04 g; P = 0.46). Male IR-exposed and control offspring had similar early postnatal weight trajectories (0–4 weeks) (Fig. 2_A_) and body weights from 1 to 6 months (Fig. 2_B_). Moreover, prenatal exposure to insulin resistance did not influence the weight of individual adipose and muscle depots (Fig. 2_D_), food intake, activity, or VO2 in male mice (Fig. 2_E_–G).
Figure 2.
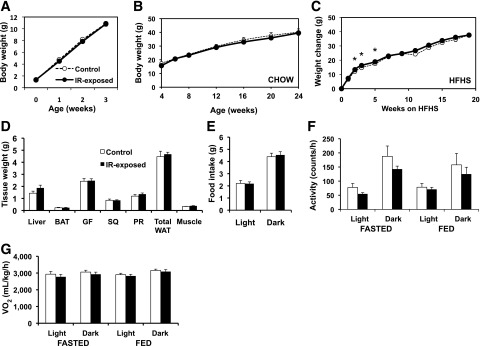
Weight trajectories in male offspring exposed to maternal insulin resistance are comparable to controls. A: Early postnatal growth, males. n = 18–40 pups per group, representing 10–16 litters per group. B: Growth curve from 4–24 weeks on chow diet, males. n = 5–15 pups per group, representing 3–6 litters per group. C: Weight change on HFHS diet (starting at age 3 weeks), expressed as change from baseline weight, males. n = 7 per group, representing four litters per group. *P < 0.05. _D_: Dissected tissue weights, males, chow diet, aged 6 months. _n_ = 8–9 per group, representing three litters per group. BAT, interscapular brown adipose tissue depot; GF, gonadal fat; PR, perirenal fat depot; SQ, flank subcutaneous adipose depot; total WAT, sum of GF, SQ, and PR depot mass; WAT, white adipose tissue. All _P_ > 0.05. E: Food intake per 24 h during light and dark cycle, males, chow diet, aged 3 months. n = 8–9 per group, representing three litters per group. All P > 0.05. F: Activity level expressed in beam breaks per hour in fasting or fed state throughout light or dark cycle, as indicated, males, chow diet, aged 3 months. n = 8–9 per group, representing three litters per group. All P > 0.05. G: Oxygen consumption (VO2), CLAMS metabolic cages, in fasting or fed state throughout light or dark cycle, as indicated, males, chow diet, aged 3 months. n = 8–9 per group, representing three litters per group. All P > 0.05.
We next tested whether prenatal exposure to insulin resistance predisposes to diet-induced obesity by weaning offspring to an HFHS diet. In this cohort, presumably due to intercohort variability, IR-exposed males treated with HFHS diet were heavier at 3 weeks of age (control, 10.4 ± 0.4; IR-exp, 12.3 ± 0.6 g; P = 0.03); thus, data are presented as change in body weight after HFHS diet introduction. We observed a transient acceleration in weight gain in IR-exp males from weeks 3 to 5 of diet exposure, but weight gain was similar beyond 7 weeks (Fig. 2_C_). IR-exp males fed an HFHS diet had similar adipose mass, metabolic rate, food intake, and activity as controls (Supplementary Fig. 1_A_–E).
Impaired Glucose Tolerance in Male IR-Exposed Offspring
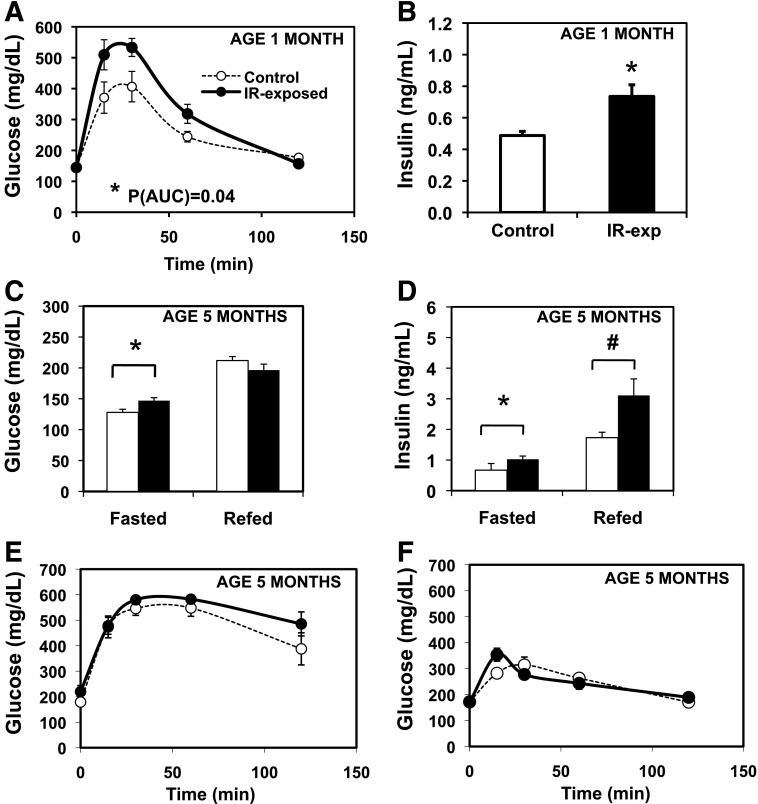
To test whether maternal insulin resistance alters offspring glucose homeostasis, we performed IP-GTT at 1 month of age. Glucose tolerance was significantly impaired in IR-exposed males (_P_[AUC] = 0.04) (Fig. 3_A_). Fasting insulin levels were significantly increased in IR-exposed males at 1 month of age (control, 0.55 ± 0.02; IR-exp, 0.70 ± 0.05 ng/mL; P = 0.02) (Fig. 3_B_), despite no differences in fasting glucose.
Figure 3.
Altered glucose homeostasis in male offspring of insulin-resistant mothers. A: IP-GTT (2 g/kg) in males, chow fed, aged 1 month. n = 6–8 pups, representing three litters per group. *P(AUC) = 0.04; *P(rmANOVA) = 0.05. B: Insulin, fasted, males, aged 1 month. n = 6–8 pups, representing three litters per group. *P = 0.02. C: Glucose in the fasted (16 h) and refed (4 h) state. Chow-fed males, aged 5 months. n = 8–9 per group, representing three litters per group. *P = 0.02. D: Insulin, fasted for 16 h and refed (4 h). Chow-fed males, aged 5 months. n = 8–9 per group, representing three litters per group. *P = 0.02; #P = 0.05. E: IP-GTT (2 g/kg) in males, chow-fed, aged 5.5 months. n = 8–9 per group, representing three litters per group. P(AUC) = 0.09; P(rmANOVA) = 0.08. F: Glycemic excursion after 2 g/kg oral glucose gavage. n = 5–8 pups, representing three litters per group, chow-fed males, aged 5.5 months. Filled circles denote IR-exposed offspring, and open circles with dashed line denote controls. P(AUC) = 0.96; P(rmANOVA) = 0.72.
By 5 months, IR-exp males had significant increases in both fasting glucose (control, 128 ± 5; IR-exp, 147 ± 5 mg/dL; P = 0.02) and insulin (control, 0.67 ± 0.22; IR-exp, 1.03 ± 0.11 ng/mL; P = 0.02) (Fig. 3_C_ and D). Despite similar glucose 4 h after refeeding, refed plasma insulin tended to be higher in IR-exposed offspring (control, 1.7 ± 0.2; IR-exp, 3.1 ± 0.5 ng/mL; P = 0.05) (Fig. 3_D_). At 5 months, IP-GTT was similar between IR-exposed males and controls (Fig. 3_E_). Given the differences in refed insulin levels, we assessed oral glucose tolerance in 5.5-month-old males. IR-exposed males had similar responses to glucose gavage as controls, although the glycemic response differed slightly, with an earlier peak in IR-exposed males (Fig. 3_F_). Fasting and 30-min postgavage insulin levels were similar (not shown).
Insulin Resistance in Male IR-Exposed Offspring Exposed to Obesogenic Diet
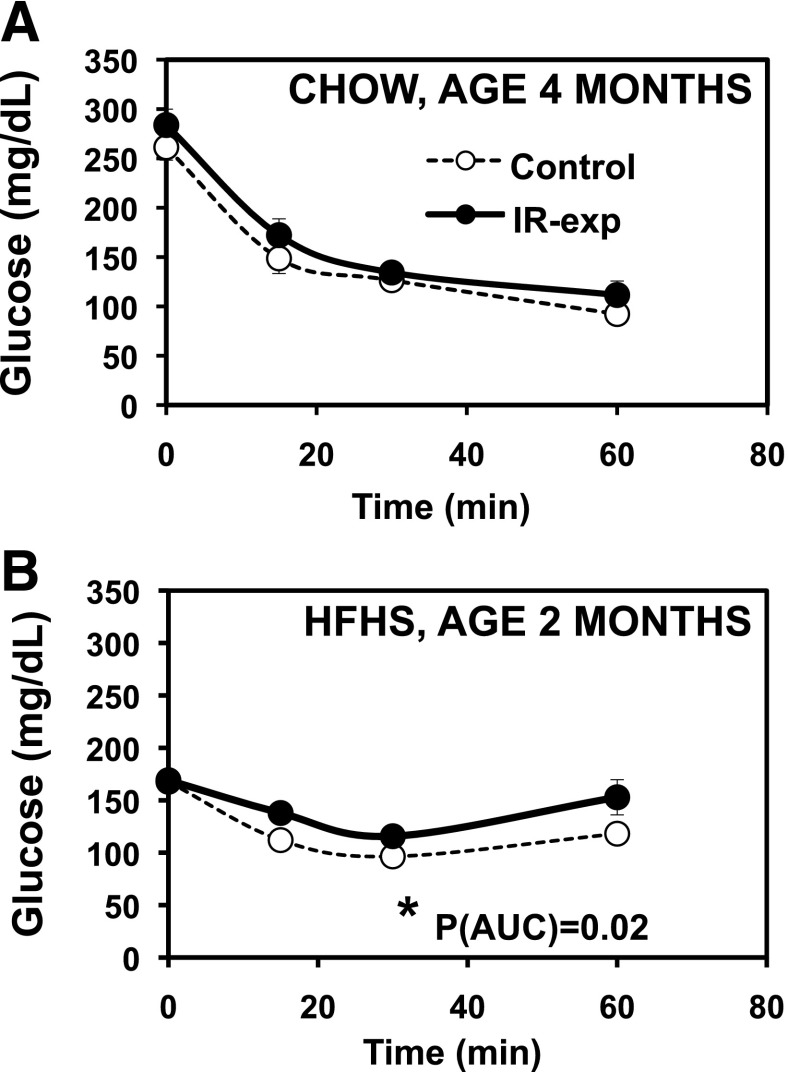
Hyperinsulinemia in both the fasting and refed states (Fig. 3_B_ and D) in IR-exposed offspring may reflect systemic insulin resistance. We therefore assessed insulin sensitivity with insulin tolerance tests. On chow, glycemic responses to insulin did not differ in IR-exposed offspring aged 4 months (Fig. 4A). By contrast, when challenged with an HFHS diet, 2-month-old IR-exposed offspring had impaired glycemic responses to insulin, consistent with insulin resistance (_P_[AUC] = 0.02) (Fig. 4B). Since hepatic insulin resistance can be associated with increased gluconeogenesis, we tested glycemic responses to pyruvate but did not find any significant differences at either 4 or 7 months (not shown).
Figure 4.
Modest insulin resistance in the male offspring of insulin-resistant mothers. A: ITT. Males, aged 4 months, chow diet, 1 unit/kg insulin. n = 8–9 per group, representing three litters per group. P(AUC) = 0.24; P(rmANOVA) = 0.22. B: ITT. Males, aged 2 months, HFHS diet, 1 unit/kg insulin. n = 7 per group, representing four litters per group. *P(AUC) = 0.02; *P(rmANOVA) = 0.04.
Differences in adipose distribution, mass, and function can contribute to systemic insulin resistance. We observed no differences in adipocyte size or morphology as a function of prenatal exposure to insulin resistance in chow-fed males (Fig. 5_A_). We next assessed the expression of differentiation-associated genes, finding a 40% reduction in expression of the adipogenesis regulator C/EBPα (P = 0.02), yet no differences in expression of either peroxisome proliferator–activated receptor γ (PPARγ) or the late differentiation markers AP2 and GLUT4 (Fig. 5_B_). To assess adipose inflammatory phenotypes, we measured expression of macrophage markers and cytokines in the stromal vascular fraction of gonadal fat and found a 30% reduction in the expression of tumor necrosis factor-α (TNF-α) (P = 0.049) in IR-exposed offspring but no differences in F4/80, interleukin 1b (IL-1b), IL-10, IL-6, monocyte chemoattractant protein 1 (MCP-1), plasminogen activator inhibitor 1 (PAI-1), or TLR4 (Fig. 5_C_). We similarly saw no differences in the expression of genes commonly altered in proinflammatory states in isolated adipocytes, but expression of the anti-inflammatory cytokine IL-10 was increased approximately twofold in IR-exposed offspring (P = 0.04) (Fig. 5_D_). We detected no differences in plasma IL-6, TNF-α, MCP-1, or PAI-1 (not shown). However, plasma adiponectin levels were increased almost threefold in male IR-exposed offspring 6 months of age (control, 23.3 ± 6.3; IR-exp, 67.0 ± 6.4 ng/mL; P = 0.0002) (Fig. 5_E_). Adiponectin mRNA expression, however, was not altered in isolated adipocytes (Fig. 5_F_), suggesting that increased plasma adiponectin results from posttranscriptional regulation. Moreover, we detected no differences in plasma adiponectin or adiponectin mRNA in early life (3–4 weeks) (Supplementary Fig. 3), suggesting that the prenatal environment may interact with aging to increase plasma adiponectin in 6-month-old IR-exposed males.
Figure 5.
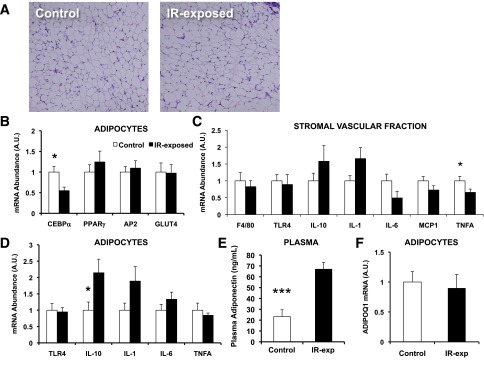
Hyperadiponectinemia in chow-fed male offspring of insulin-resistant mothers despite similar adipose histology and gene expression patterns. A: Representative section of gonadal fat, males, aged 6 months. Hematoxylin and eosin staining. Original magnification ×200. B: Gene expression of adipocyte differentiation markers by quantitative PCR (q-PCR), normalized to 36B4, adipocyte fraction of gonadal fat, males. n = 8–9 pups, representing three litters per group, aged 6 months. *P = 0.02 for C/EBP-α. C: Gene expression of inflammatory markers by q-PCR, normalized to 36B4, stromal-vascular fraction of gonadal fat, males. n = 8–9 pups, representing three litters per group, aged 6 months. *P = 0.049 for TNF-α. D: Gene expression of inflammatory markers by q-PCR, normalized to 36B4, adipocyte fraction of gonadal fat, males. n = 8–9 pups, representing three litters per group, aged 6 months. *P = 0.03 for IL-10. E: Plasma adiponectin, males. n = 8–9 pups, representing three litters per group, aged 6 months. ***P = 0.0002. F: Expression of adiponectin mRNA by q-PCR, normalized to 36B4, adipocyte fraction of gonadal fat, males. n = 8–9 pups, representing three litters per group, aged 6 months. A.U., arbitrary units. (A high-quality color representation of this figure is available in the online issue.)
Prenatal Exposure to Insulin Resistance Alters Lipid Metabolism
To assess whether hyperinsulinemia in male offspring exposed to maternal insulin resistance is associated with increased lipid accumulation, we analyzed liver lipids in both young (3 weeks) and adult (6 months) males. Young IR-exposed mice had increases across a range of lipids: of 18 species altered (P < 0.05), 10 were increased by >20%, whereas only 5 were reduced by >20% in liver (Fig. 6_A_). The concentration of 16:1n7 was increased in several lipid classes, including TAG16:1n7, DG16:1n7, FFA16:1n7, LPC16:1n7, PC16:1n7, and PE16:1n7 (increased by 104%, P = 0.047; 140%, P = 0.001; 79%, P = 0.002; 59%, P = 0.045; 37%, P = 0.005; and 51%, P = 0.001, respectively) (Fig. 6_B_), potentially consistent with increased Scd1 activity. Twenty seven of 44 measured triglyceride species were increased by >50% in IR-exp offspring, whereas none were decreased by >50%. These patterns were attenuated by 6 months, at which point, liver content of several lipid species was reduced in IR-exposed offspring (Fig. 6_C_), including several phospholipids (20:5, 22:5n3, and 22:6) reduced by >20% (P < 0.05). However, liver content of triglyceride species tended to be elevated in IR-exposed offspring at 6 months (Fig. 6_C_). Total liver triglyceride content assessed by chloroform/methanol extraction also tended to be higher (control, 0.022 ± 0.003; IR-exp, 0.028 ± 0.003 mg TAG/mg liver; P = 0.15), and liver histology demonstrated more prominent lipid droplets in IR-exposed offspring than in controls (Fig. 6_D_). Moreover, IR-exposed offspring (5 months of age) had higher plasma fatty acids after refeeding (control, 0.60 ± 0.07; IR-exp, 0.78 ± 0.06 mmol/L; P = 0.05) (Fig. 6_E_). Together, these data suggest that prenatal exposure to insulin resistance may contribute to altered lipid metabolism in offspring.
Figure 6.
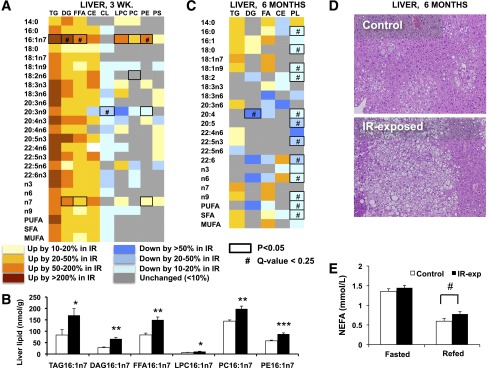
Altered lipid metabolism in chow-fed offspring of insulin-resistant mothers. A: Lipidomic profiling in livers from 3-week-old males. Each column represents the fold change of IR-exposed/control, calculated based on mean lipid abundance in nmol/mg in each group. n = 6 per group, representing two to three litters per group. B: Liver levels of 16:1n7 fraction of lipid classes in 3-week-old males. n = 6 per group, representing two to three litters per group. C: Lipidomic profiling in livers from 6-month-old males. Each column represents the fold change of IR-exposed/control, calculated based on mean lipid abundance in μg/mg. n = 8–9 per group, representing three litters per group. *P < 0.05; **P < 0.01; ***P < 0.001. D: Representative liver histology images from 6-month-old males, hematoxylin and eosin stain. Original magnification ×200. E: Fasted and 4-h postrefeeding plasma nonesterified fatty acid (NEFA) levels in 5-month-old males. n = 8–9 per group, representing three litters per group. #P = 0.05.
Metabolomic Profiling: Lipids and Branched-Chain Amino Acids as Potential Mediators of Developmental Programming by Maternal Insulin Resistance
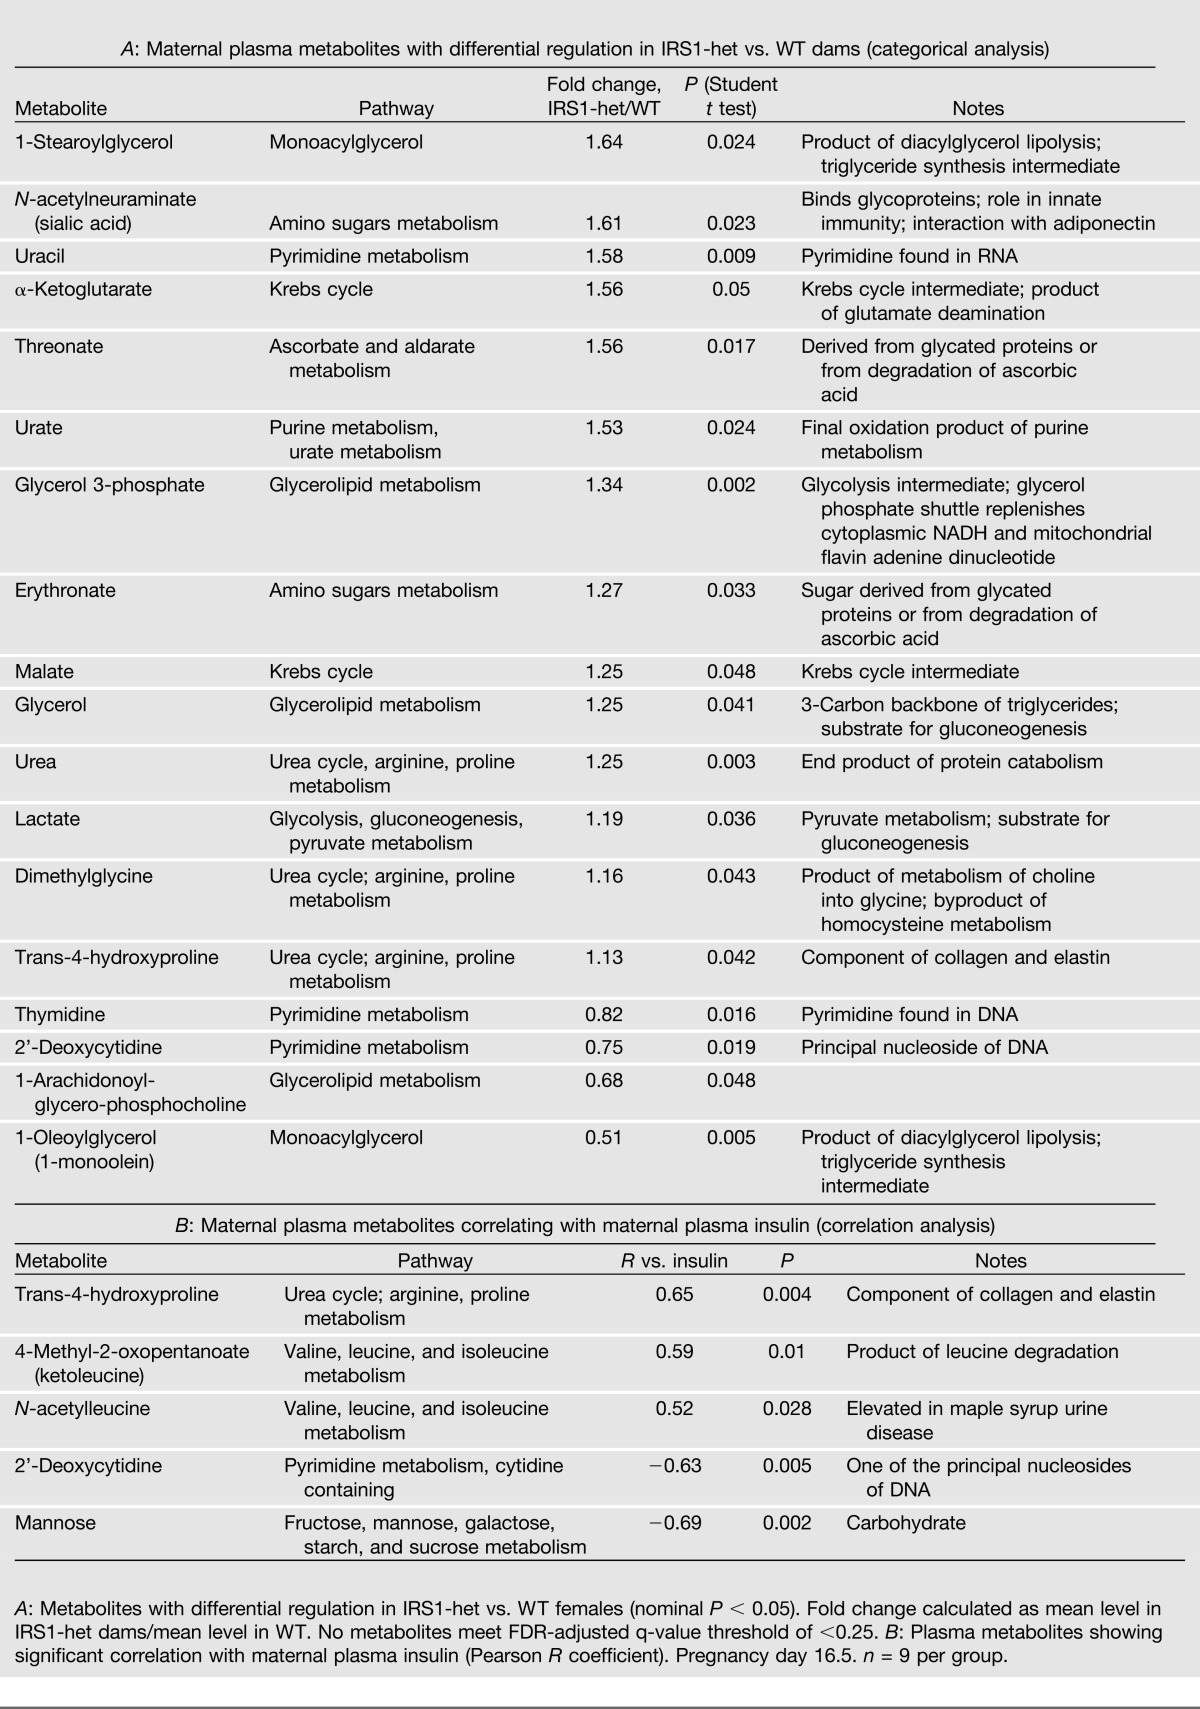
Because insulin does not cross the placenta, we sought to identify potential maternally derived mediators of risk associated with prenatal exposure to insulin resistance by analyzing plasma from IRS1-het versus WT pregnant dams. Although adipokines have been implicated in both insulin resistance and developmental programming (27), we found no differences in plasma adiponectin, leptin, IL-6, TNF-α, MCP-1, PAI-1, and resistin in pregnant IRS1-het females versus controls (Supplementary Table 1), suggesting these adipokines are unlikely effectors of risk in our model. We thus used a metabolomic approach to identify metabolic intermediates, nutrients, and small molecules differing between pregnant IRS1-het females and WT controls. IRS1-het females had increases in glycerol and glycerol-3-phosphate and alterations in several glycerolipids, consistent with either increased lipolysis or lipid turnover (Table 2_A_). Interestingly, 1-stearoylglycerol (18:0-glycerol) was the top-ranking metabolite increased in IRS1-het females (64% increase, P = 0.024), whereas its monounsaturated counterpart 1-oleoylglycerol (18:1n9-glycerol) was the top-ranking decreased metabolite (49% reduction, P = 0.005). These patterns are potentially consistent with reduced desaturase activity or with differences in de novo synthesis of fatty acids in insulin-resistant dams. Moreover, uric acid was increased 1.5-fold in IRS1-het females (P = 0.024). Two branched chain amino acid (BCAA) metabolites, ketoleucine and _N_-acetylleucine, were significantly correlated with maternal plasma insulin (R = 0.59, P = 0.01; R = 0.52, P = 0.03, respectively) (Table 2_B_).
Table 2.
Metabolomic analysis of maternal plasma
We did not detect any differences in fetal levels of insulin, glucose, and fatty acids between IR-exposed mice and controls at E18.5 (Supplementary Fig. 2_A_–C).
Discussion
Although population studies and experimental models indicate that maternal obesity and diabetes increase risk of obesity and glucose intolerance in offspring, the mechanisms underlying such associations remain unclear. Maternal insulin resistance is a feature of both obesity and diabetes and thus may be an independent contributor to offspring disease risk. To test this hypothesis, we used female mice haploinsufficient for IRS-1, which are insulin resistant and hyperinsulinemic during pregnancy but normoglycemic, as a model of prenatal exposure to insulin resistance.
We first tested whether prenatal exposure to maternal insulin resistance increases obesity risk in offspring. Male IR-exposed offspring had similar patterns of weight gain to controls on a chow diet (Fig. 2_B_). Upon challenge with an obesogenic HFHS diet, IR-exposed males gained more weight than controls early on, but differences disappeared 5 weeks after the diet’s introduction (Fig. 2_C_). Our data are similar to those of Carmody et al. (19) who observed only a modest and short-lived propensity to weight gain in offspring of mothers with combined genetic and diet-induced insulin resistance. By contrast, human studies demonstrate associations between prenatal exposure to maternal obesity or GDM and risk of childhood obesity (28–30). Although maternal insulin resistance is a prominent feature of maternal obesity and GDM, our data suggest that insulin resistance alone may not be sufficient to confer obesity risk, and that interactions between maternal insulin resistance, diet, and/or genetics may be important.
Despite normal body weight and body composition, male offspring of insulin-resistant mothers had durable impairments in glucose homeostasis. As early as 1 month of age, IR-exposed males had fasting hyperinsulinemia and greater glycemic excursions than controls (Fig. 3_A_ and B). By 5 months, male offspring of insulin-resistant mothers continued to have fasting hyperinsulinemia and had developed fasting hyperglycemia (Fig. 3_C_ and D). These findings were likely caused by insulin resistance, given that IR-exposed male offspring on a high-fat diet became more insulin resistant than controls (Fig. 4_B_). Future studies assessing β-cell function and tissue-specific insulin sensitivity may allow us to pinpoint whether insulin secretion, impaired insulin signaling in liver, adipose, or muscle, or altered clearance contributes to hyperinsulinemia after prenatal exposure to insulin resistance.
To test whether prenatal exposure to maternal insulin resistance alters lipid metabolism, we analyzed the liver lipidome in IR-exposed males at 3 weeks and at 6 months of age. Young IR-exposed males had increased liver content of numerous lipid species, notably in the 16:1n7 fraction of multiple lipid classes, providing indirect evidence of increased activity of the lipogenic enzyme Scd1 (Fig. 6_A_ and B). By contrast, analysis of the liver lipidome at 6 months of age revealed only a trend for increased triglyceride species, as well as significant reductions across multiple phospholipid species (Fig. 6_C_). These findings are intriguing in light of reports of reduced hepatic phospholipid content and altered composition (i.e., phosphatidylcholine/phosphatidylethanolamine ratio) in humans with liver steatosis (31). Alterations in liver phospholipid composition via low-choline diet or knockdown of PEMT, the enzyme that synthesizes phosphatidylcholine, the most abundant liver phospholipid, from phosphatidylethanolamine, result in steatosis (32,33). Histologic examination of liver at 6 months of age revealed increased lipid droplets in male offspring exposed to maternal insulin resistance (Fig. 6_D_). We also noted IR-exposed male offspring to have increased plasma fatty acids in the refed state (Fig. 6_E_); increased circulating fatty acids may reflect a failure of insulin to suppress lipolysis in the setting of insulin resistance. Together, these data suggest that prenatal exposure to insulin resistance may result in durable changes in lipid metabolism in offspring. However, an important limitation is the small number of animals studied in the lipidomic analyses (six mice per group representing two control litters and three IR-exposed litters at 3 weeks of age and six mice per group representing three litters per group at 6 months of age). Thus, it will be essential for future studies to confirm these findings. Moreover, given that plasma insulin levels are increased in IR-exposed mice during early life (Fig. 3_B_) and adulthood (Fig. 3_D_), future studies will also be essential to establish to what extent altered lipid metabolism results from hyperinsulinemia and insulin resistance or, conversely, whether hepatic lipogenesis and lipid accumulation lead to hepatic and systemic insulin resistance.
Inflammation in metabolic organs, including adipose tissue, liver, and brain, may contribute to systemic insulin resistance and metabolic dysfunction (34). However, we found no evidence of increased inflammation in IR-exposed offspring. Adipose tissue expression of proinflammatory genes and plasma levels of adipokines, including IL-6, TNF-α, MCP-1, and PAI-1, were unchanged by prenatal exposure to insulin resistance. Moreover, mRNA expression of the anti-inflammatory cytokine IL-10 was increased, suggesting that prenatal exposure to insulin resistance may reduce adipose inflammation. These data suggest that observed associations between maternal obesity and offspring inflammation (12,35) are unlikely to be mediated directly by maternal insulin resistance.
Increased adiponectin levels in 6-month-old IR-exposed males (Fig. 5_E_) were a surprising finding given that IR-exposed mice were more insulin resistant on HFHS diet. Although adiponectin, particularly its HMW fraction, is a potent insulin sensitizer, elevated adiponectin has previously been observed in severe insulin resistance, including mice with dominant-negative IGF-1 receptor mutations (36) and humans with insulin receptor mutations (37). Such elevations in circulating adiponectin could potentially contribute to altered lipid metabolism in IR-exposed mice, as reflected by elevated refed plasma fatty acid levels and a tendency for liver lipid accumulation (Fig. 6). Indeed, adiponectin deficiency has been associated with reductions in activity of the lipogenic enzyme Scd1 (38), and insulin-sensitizing agents can induce parallel increases in Scd1 and adiponectin (39). It is also possible that high adiponectin levels may have attenuated the systemic insulin resistance of IR-exposed offspring. Testing the extent to which adiponectin secretion and signaling contributes to phenotypes associated with prenatal exposure to insulin resistance will be important in future studies.
Although our studies demonstrate that maternal insulin resistance can increase risk of offspring metabolic disease, the specific mechanism remains unclear. We cannot exclude the possibility that maternal insulin resistance may alter nurturing behavior or lactation as our animals were not cross-fostered at birth. However, data from Hadsell et al. (24) indicate that lactation capacity is similar between IRS1-het and WT dams, and that weight gain is similar in WT pups cross-fostered to IRS1-het versus WT dams; this does not rule out differences in milk composition or gut flora. Insulin is unlikely to be the primary mediator since it does not cross the placental barrier, and fetal insulin levels did not differ in response to prenatal exposure to insulin resistance (Supplementary Fig. 2). Although adipokines have been implicated in insulin resistance and in developmental programming (27), we found no differences in plasma adipokines in mothers, potentially due to similar body weight and slightly reduced adipose mass in IRS1-het dams. We next used metabolomic analysis to identify candidates contributing to mother-to-offspring transmission. Given the alterations in lipid metabolism observed in IR-exposed offspring (increased plasma fatty acids and hepatic lipid accumulation), it is intriguing that some of the most striking changes in plasma from IRS1-het females were also in lipid species. Monoacylglycerol species ranked as both the top increased (1-stearoylglycerol or 18:0-glycerol) and decreased (1-oleoylglycerol or 18:1n9-glycerol) metabolites (Table 2_A_). The parallel increase in 18:0-glycerol and decrease in 18:1n9-glycerol may suggest reduced desaturase activity and reduced lipogenesis. Increased levels of glycerol and glycerolipids in the maternal circulation are potentially consistent with enhanced adipose tissue lipolysis in IRS1-het mothers or with increased lipid turnover. Although glycerolipids do not cross the placental barrier directly in appreciable amounts, placenta has a high lipase activity for lipoprotein hydrolysis, fatty acid uptake, and subsequent transport of free fatty acids to the fetus (40). Thus, we hypothesize that IR-exposed pups may be exposed to increased lipids during fetal life.
Additional metabolites may also contribute to risk associated with maternal insulin resistance. Uric acid was increased in plasma from IRS1-het females, an intriguing finding as hyperuricemia may also mark insulin resistance in the metabolic syndrome (41) and predict adverse fetal outcomes in hypertensive pregnancies (42). Interestingly, two BCAA metabolites (ketoleucine and _N_-acetylleucine) correlated strongly with maternal insulin levels. Although this may simply reflect maternal insulin resistance and unsuppressed proteolysis, BCAAs have recently been shown to predict diabetes risk (43) and may contribute to the pathogenesis of insulin resistance (44).
In conclusion, isolated maternal insulin resistance, even in the absence of obesity or hyperglycemia, can produce durable impairments in glucose homeostasis and altered lipid metabolism in male offspring. Metabolomic patterns in insulin-resistant mothers raise the possibility that altered metabolism of lipids by both the mother and the fetoplacental unit might contribute to metabolic risk in offspring. Defining the specific mechanisms responsible for these patterns not only will be important for our understanding but may also lead to diagnostic and therapeutic approaches to reduce maternal insulin resistance and prevent metabolic disease outcomes in offspring.
Supplementary Material
Supplementary Data
Article Information
Acknowledgments. Mice with targeted disruption of IRS-1 were a generous gift from C. Ronald Kahn (Iacocca Professor of Medicine at Harvard Medical School and a Senior Investigator at Joslin Diabetes Center, Boston, MA).
Funding. Grant support was provided by the Eunice Kennedy Shriver National Institute of Child Health and Human Development K99/R00, the Pediatric Endocrine Society, the Canadian Institutes of Health Research (to E.I.); and by the American Diabetes Association and the Graetz Foundation (to M.-E.P.). A.L. was the recipient of a Marie-Curie International Outgoing Fellowship for Career Development (MC-IOF-2009-253131). The authors thank the Joslin Diabetes Research Center (DK-036836) and Vanderbilt Mouse Metabolic Phenotyping Center (DK-59637).
Duality of Interest. W.G. discloses a professional relationship with Metabolon, Inc., where he was Program Manager for Diagnostic Development, and S.W. discloses a professional relationship with Lipomics, Inc., of which he is the President and Chief Scientific Officer. No other potential conflicts of interest relevant to this article were reported.
Author Contributions. E.I. researched data; designed the experiments; contributed to the discussion; and wrote, reviewed, and edited the manuscript. M.W., H.M., M.C., W.K., V.S., J.D.-L., K.-J.L., C.L., D.L., C.F., and W.G. researched data. A.L. and S.W. researched data and contributed to discussion. M.-E.P. designed the experiments; contributed to the discussion; and wrote, reviewed, and edited the manuscript. E.I. is the guarantor of this work and, as such, had full access to all the data in the study and takes responsibility for the integrity of the data and the accuracy of the data analysis.
Footnotes
References
- 1.Gluckman PD, Hanson MA. Developmental origins of disease paradigm: a mechanistic and evolutionary perspective. Pediatr Res 2004;56:311–317 [DOI] [PubMed] [Google Scholar]
- 2.Oken E, Gillman MW. Fetal origins of obesity. Obes Res 2003;11:496–506 [DOI] [PubMed] [Google Scholar]
- 3.Gillman MW, Rifas-Shiman S, Berkey CS, Field AE, Colditz GA. Maternal gestational diabetes, birth weight, and adolescent obesity. Pediatrics 2003;111:e221–e226 [DOI] [PubMed] [Google Scholar]
- 4.Reynolds RM, Osmond C, Phillips DI, Godfrey KM. Maternal BMI, parity, and pregnancy weight gain: influences on offspring adiposity in young adulthood. J Clin Endocrinol Metab 2010;95:5365–5369 [DOI] [PubMed] [Google Scholar]
- 5.Petitt DJ, Bennett PH, Knowler WC, Baird HR, Aleck KA. Gestational diabetes mellitus and impaired glucose tolerance during pregnancy. Long-term effects on obesity and glucose tolerance in the offspring. Diabetes 1985;34(Suppl. 2):119–122 [DOI] [PubMed] [Google Scholar]
- 6.Dabelea D, Hanson RL, Lindsay RS, et al. Intrauterine exposure to diabetes conveys risks for type 2 diabetes and obesity: a study of discordant sibships. Diabetes 2000;49:2208–2211 [DOI] [PubMed] [Google Scholar]
- 7.Lawlor DA, Lichtenstein P, Långström N. Association of maternal diabetes mellitus in pregnancy with offspring adiposity into early adulthood: sibling study in a prospective cohort of 280,866 men from 248,293 families. Circulation 2011;123:258–265 [DOI] [PMC free article] [PubMed] [Google Scholar]
- 8.Kral JG, Biron S, Simard S, et al. Large maternal weight loss from obesity surgery prevents transmission of obesity to children who were followed for 2 to 18 years. Pediatrics 2006;118:e1644–e1649 [DOI] [PubMed]
- 9.Steculorum SM, Bouret SG. Maternal diabetes compromises the organization of hypothalamic feeding circuits and impairs leptin sensitivity in offspring. Endocrinology 2011;152:4171–4179 [DOI] [PMC free article] [PubMed] [Google Scholar]
- 10.Lau SM, Lin S, Stokes RA, et al. Synergistic effects of genetic beta cell dysfunction and maternal glucose intolerance on offspring metabolic phenotype in mice. Diabetologia 2011;54:910–921 [DOI] [PMC free article] [PubMed] [Google Scholar]
- 11.Howie GJ, Sloboda DM, Kamal T, Vickers MH. Maternal nutritional history predicts obesity in adult offspring independent of postnatal diet. J Physiol 2009;587:905–915 [DOI] [PMC free article] [PubMed] [Google Scholar]
- 12.Rother E, Kuschewski R, Alcazar MA, et al. Hypothalamic JNK1 and IKKβ activation and impaired early postnatal glucose metabolism after maternal perinatal high-fat feeding. Endocrinology 2012;153:770–781 [DOI] [PubMed] [Google Scholar]
- 13.Chang GQ, Gaysinskaya V, Karatayev O, Leibowitz SF. Maternal high-fat diet and fetal programming: increased proliferation of hypothalamic peptide-producing neurons that increase risk for overeating and obesity. J Neurosci 2008;28:12107–12119 [DOI] [PMC free article] [PubMed] [Google Scholar]
- 14.McCurdy CE, Bishop JM, Williams SM, et al. Maternal high-fat diet triggers lipotoxicity in the fetal livers of nonhuman primates. J Clin Invest 2009;119:323–335 [DOI] [PMC free article] [PubMed] [Google Scholar]
- 15.Ward WK, Johnston CL, Beard JC, Benedetti TJ, Halter JB, Porte DJ., Jr Insulin resistance and impaired insulin secretion in subjects with histories of gestational diabetes mellitus. Diabetes 1985;34:861–869 [DOI] [PubMed] [Google Scholar]
- 16.Scholl TO, Chen X. Insulin and the “thrifty” woman: the influence of insulin during pregnancy on gestational weight gain and postpartum weight retention. Matern Child Health J 2002;6:255–261 [DOI] [PubMed] [Google Scholar]
- 17.Ramsay JE, Ferrell WR, Crawford L, Wallace AM, Greer IA, Sattar N. Maternal obesity is associated with dysregulation of metabolic, vascular, and inflammatory pathways. J Clin Endocrinol Metab 2002;87:4231–4237 [DOI] [PubMed] [Google Scholar]
- 18.Surwit RS, Kuhn CM, Cochrane C, McCubbin JA, Feinglos MN. Diet-induced type II diabetes in C57BL/6J mice. Diabetes 1988;37:1163–1167 [DOI] [PubMed] [Google Scholar]
- 19.Carmody JS, Wan P, Accili D, Zeltser LM, Leibel RL. Respective contributions of maternal insulin resistance and diet to metabolic and hypothalamic phenotypes of progeny. Obesity (Silver Spring) 2011;19:492–499 [DOI] [PMC free article] [PubMed] [Google Scholar]
- 20.Nelson SM, Matthews P, Poston L. Maternal metabolism and obesity: modifiable determinants of pregnancy outcome. Hum Reprod Update 2010;16:255–275 [DOI] [PMC free article] [PubMed] [Google Scholar]
- 21.Araki E, Lipes MA, Patti ME, et al. Alternative pathway of insulin signalling in mice with targeted disruption of the IRS-1 gene. Nature 1994;372:186–190 [DOI] [PubMed] [Google Scholar]
- 22.Patti ME, Sun XJ, Bruening JC, et al. 4PS/insulin receptor substrate (IRS-2) is the alternative substrate of the insulin receptor in IRS-1-deficient mice. J Biol Chem 1995;270:24670–24673 [DOI] [PubMed] [Google Scholar]
- 23.Brüning JC, Winnay J, Bonner-Weir S, Taylor SI, Accili D, Kahn CR. Development of a novel polygenic model of NIDDM in mice heterozygous for IR and IRS-1 null alleles. Cell 1997;88:561–572 [DOI] [PubMed] [Google Scholar]
- 24.Hadsell DL, Olea W, Lawrence N, et al. Decreased lactation capacity and altered milk composition in insulin receptor substrate null mice is associated with decreased maternal body mass and reduced insulin-dependent phosphorylation of mammary Akt. J Endocrinol 2007;194:327–336 [DOI] [PubMed] [Google Scholar]
- 25.Surwit RS, Feinglos MN, Rodin J, et al. Differential effects of fat and sucrose on the development of obesity and diabetes in C57BL/6J and A/J mice. Metabolism 1995;44:645–651 [DOI] [PubMed] [Google Scholar]
- 26.Storey JD, Tibshirani R. Statistical significance for genomewide studies. Proc Natl Acad Sci USA 2003;100:9440–9445 [DOI] [PMC free article] [PubMed] [Google Scholar]
- 27.Mantzoros CS, Rifas-Shiman SL, Williams CJ, Fargnoli JL, Kelesidis T, Gillman MW. Cord blood leptin and adiponectin as predictors of adiposity in children at 3 years of age: a prospective cohort study. Pediatrics 2009;123:682–689 [DOI] [PMC free article] [PubMed] [Google Scholar]
- 28.Nielsen GL, Dethlefsen C, Lundbye-Christensen S, Pedersen JF, Mølsted-Pedersen L, Gillman MW. Adiposity in 277 young adult male offspring of women with diabetes compared with controls: a Danish population-based cohort study. Acta Obstet Gynecol Scand 2012;91:838–843 [DOI] [PMC free article] [PubMed] [Google Scholar]
- 29.Laitinen J, Jääskeläinen A, Hartikainen AL, et al. Maternal weight gain during the first half of pregnancy and offspring obesity at 16 years: a prospective cohort study. BJOG 2012;119:716–723 [DOI] [PubMed] [Google Scholar]
- 30.Oken E, Rifas-Shiman SL, Field AE, Frazier AL, Gillman MW. Maternal gestational weight gain and offspring weight in adolescence. Obstet Gynecol 2008;112:999–1006 [DOI] [PMC free article] [PubMed] [Google Scholar]
- 31.Puri P, Baillie RA, Wiest MM, et al. A lipidomic analysis of nonalcoholic fatty liver disease. Hepatology 2007;46:1081–1090 [DOI] [PubMed] [Google Scholar]
- 32.Zhu X, Song J, Mar MH, Edwards LJ, Zeisel SH. Phosphatidylethanolamine N-methyltransferase (PEMT) knockout mice have hepatic steatosis and abnormal hepatic choline metabolite concentrations despite ingesting a recommended dietary intake of choline. Biochem J 2003;370:987–993 [DOI] [PMC free article] [PubMed] [Google Scholar]
- 33.Li Z, Agellon LB, Allen TM, et al. The ratio of phosphatidylcholine to phosphatidylethanolamine influences membrane integrity and steatohepatitis. Cell Metab 2006;3:321–331 [DOI] [PubMed] [Google Scholar]
- 34.Shoelson SE, Lee J, Goldfine AB. Inflammation and insulin resistance. J Clin Invest 2006;116:1793–1801 [DOI] [PMC free article] [PubMed] [Google Scholar]
- 35.Guénard F, Tchernof A, Deshaies Y, et al. Methylation and expression of immune and inflammatory genes in the offspring of bariatric bypass surgery patients. J Obes 11 June 2013 [Epub ahead of print] [DOI] [PMC free article] [PubMed] [Google Scholar]
- 36.Kim CH, Pennisi P, Zhao H, et al. MKR mice are resistant to the metabolic actions of both insulin and adiponectin: discordance between insulin resistance and adiponectin responsiveness. Am J Physiol Endocrinol Metab 2006;291:E298–E305 [DOI] [PubMed] [Google Scholar]
- 37.Sleigh A, Raymond-Barker P, Thackray K, et al. Mitochondrial dysfunction in patients with primary congenital insulin resistance. J Clin Invest 2011;121:2457–2461 [DOI] [PMC free article] [PubMed] [Google Scholar]
- 38.Wanninger J, Liebisch G, Schmitz G, et al. Lipidomic analysis of the liver identifies changes of major and minor lipid species in adiponectin deficient mice. Exp Mol Pathol 2013;94:412–417 [DOI] [PMC free article] [PubMed] [Google Scholar]
- 39.Yao-Borengasser A, Rassouli N, Varma V, et al. Stearoyl-coenzyme A desaturase 1 gene expression increases after pioglitazone treatment and is associated with peroxisomal proliferator-activated receptor-gamma responsiveness. J Clin Endocrinol Metab 2008;93:4431–4439 [DOI] [PMC free article] [PubMed] [Google Scholar]
- 40.Gil-Sánchez A, Koletzko B, Larqué E. Current understanding of placental fatty acid transport. Curr Opin Clin Nutr Metab Care 2012;15:265–272 [DOI] [PubMed] [Google Scholar]
- 41.Lin JD, Chiou WK, Chang HY, Liu FH, Weng HF. Serum uric acid and leptin levels in metabolic syndrome: a quandary over the role of uric acid. Metabolism 2007;56:751–756 [DOI] [PubMed] [Google Scholar]
- 42.Hawkins TL, Roberts JM, Mangos GJ, Davis GK, Roberts LM, Brown MA. Plasma uric acid remains a marker of poor outcome in hypertensive pregnancy: a retrospective cohort study. BJOG 2012;119:484–492 [DOI] [PubMed] [Google Scholar]
- 43.Wang TJ, Larson MG, Vasan RS, et al. Metabolite profiles and the risk of developing diabetes. Nat Med 2011;17:448–453 [DOI] [PMC free article] [PubMed] [Google Scholar]
- 44.Newgard CB, An J, Bain JR, et al. A branched-chain amino acid-related metabolic signature that differentiates obese and lean humans and contributes to insulin resistance. Cell Metab 2009;9:311–326 [DOI] [PMC free article] [PubMed] [Google Scholar]
Associated Data
This section collects any data citations, data availability statements, or supplementary materials included in this article.
Supplementary Materials
Supplementary Data
