CRISPR-mediated direct mutation of cancer genes in the mouse liver (original) (raw)
. Author manuscript; available in PMC: 2015 Apr 16.
Published in final edited form as: Nature. 2014 Aug 6;514(7522):380–384. doi: 10.1038/nature13589
Abstract
The study of cancer genes in mouse models has traditionally relied on genetically-engineered strains made via transgenesis or gene targeting in embryonic stem (ES) cells1. Here we describe a new method of cancer model generation using the CRISPR/Cas system in vivo in wild-type mice. We have used hydrodynamic injection to deliver a CRISPR plasmid DNA expressing Cas9 and single guide RNAs (sgRNAs)2–4 to the liver and directly target the tumor suppressor genes Pten5 and p536, alone and in combination. CRISPR-mediated Pten mutation led to elevated Akt phosphorylation and lipid accumulation in hepatocytes, phenocopying the effects of deletion of the gene using Cre-LoxP technology7, 8. Simultaneous targeting of Pten and p53 induced liver tumors that mimicked those caused by Cre-loxP-mediated deletion of Pten and p53. DNA sequencing of liver and tumor tissue revealed insertion or deletion (indel) mutations of the tumor suppressor genes, including bi-allelic mutations of both Pten and p53 in tumors. Furthermore, co-injection of Cas9 plasmids harboring sgRNAs targeting the β-Catenin gene (Ctnnb1) and a single-stranded DNA (ssDNA) oligonucleotide donor carrying activating point mutations led to the generation of hepatocytes with nuclear localization of β-Catenin. This study demonstrates the feasibility of direct mutation of tumor suppressor genes and oncogenes in the liver using the CRISPR/Cas system, which presents a new avenue for rapid development of liver cancer models and functional genomics.
The prokaryotic type II CRISPR/Cas genome editing tools have been successfully applied in many organisms, including mouse and human cells2, 4, 9–11. The system offers sequence-specific direct editing of DNA; therefore, this method can achieve complete loss-of-function compared to RNAi-based approaches12. In rodent and primate ES cells or zygotes, CRISPR has been applied to efficiently generate mutant alleles or reporter genes13–19. Our groups have previously shown that in vivo delivery of CRISPR can repair a disease gene in mouse liver20. However, generation of somatic cancer mutations in adult animals using CRISPR has not been reported.
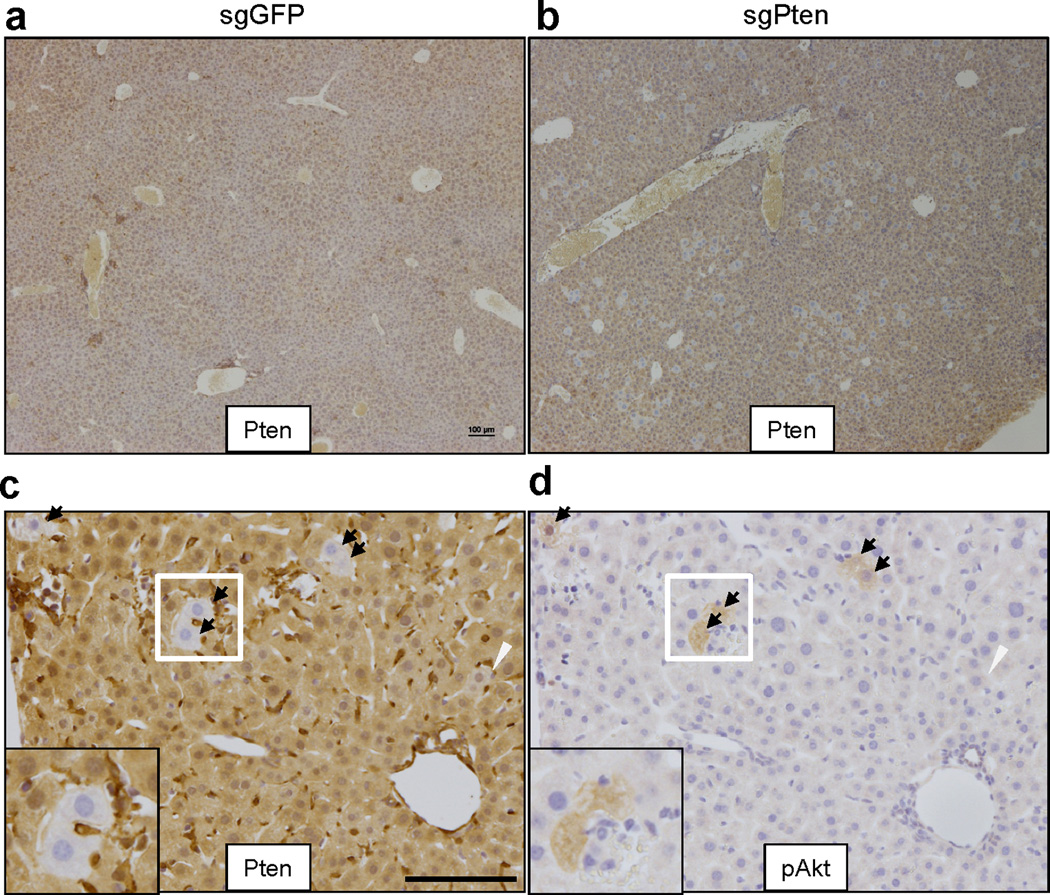
To investigate the potential of the CRISPR system to directly induce loss-of-function mutations in vivo, we chose to target the tumor suppressor gene Pten, which is a negative regulator of the PI3-Kinase/Akt pathway5. Mutation and genomic loss of Pten has been identified in many types of human cancer5. Liver-specific knockout of Pten in mice induces lipid accumulation and late-onset liver cancer7, 8. We cloned a pX330 vector9 co-expressing an sgRNA targeting Pten (Pten target sequence 1 in Supplementary Table 1, termed sgPten) and Cas9. We first showed that sgPten could induce Pten mutations in mouse 3T3 cells following transfection (Extended Data Fig. 1 and Supplementary Table 5). To deliver CRISPR to the liver in adult mice, we employed hydrodynamic tail vein injection (Fig. 1a), which can deliver DNA to ~20% of hepatocytes for transient expression21. As shown in Figure 1b, hydrodynamic injection of a luciferase plasmid DNA resulted in liver-specific expression of luciferase in mice. We next injected a cohort of wild-type FVB mice with sgPten and an equal number with a pX330 plasmid encoding an sgRNA targeting GFP (sgGFP) as a control. In parallel, we genetically deleted Pten in the liver of Pten floxed mice8 (Ptenfl/fl) via tail vein injection of adenovirus expressing the Cre recombinase (adeno-Cre). Two weeks later, immunohistochemical (IHC) staining of liver sections from five of the sgPten-treated mice using a Pten-specific antibody revealed 3.3±0.5% hepatocytes with negative Pten staining, surrounded by Pten-positive cells (Fig. 1c,d and Extended Data Fig. 2a–c). Importantly, the liver is composed of a mixture of diploid and polyploidy hepatocytes, and we cannot determine the ploidy of the Pten-deficient cells. Thus, they may be a mixture of cells with two or more mutated Pten alleles. A lower percentage (0.4±0.1%) of hepatocytes showed intermediate Pten staining (Fig. 1d and Extended Data Fig. 2c), potentially indicating heterozygous Pten mutation in diploid cells or incomplete mutation in polyploid cells. Coincident with negative Pten staining, we detected elevated staining of phospho-Akt, a biomarker of the PI3K pathway activity, in sgPten-treated (n=5) and adeno-Cre injected Ptenfl/fl mice (n=5) (Fig. 1c lower panel and Extended Data Fig. 2d). Histological analysis and Oil Red staining at two months showed hepatocytes with lipid accumulation in sgPten-treated FVB mice (n=5) and adeno-Cre treated Ptenfl/fl mice (Extended Data Fig. 3), which is a known phenotype associated with Pten mutation in the liver7, 8. These data indicate that in vivo CRISPR-mediated genome editing was able to generate Pten-negative cells in the liver, mimicking liver-specific conditional deletion of Pten in mice.
Figure 1. Hydrodynamic injection of CRISPR deletes Pten in a subset of hepatocytes in mice.

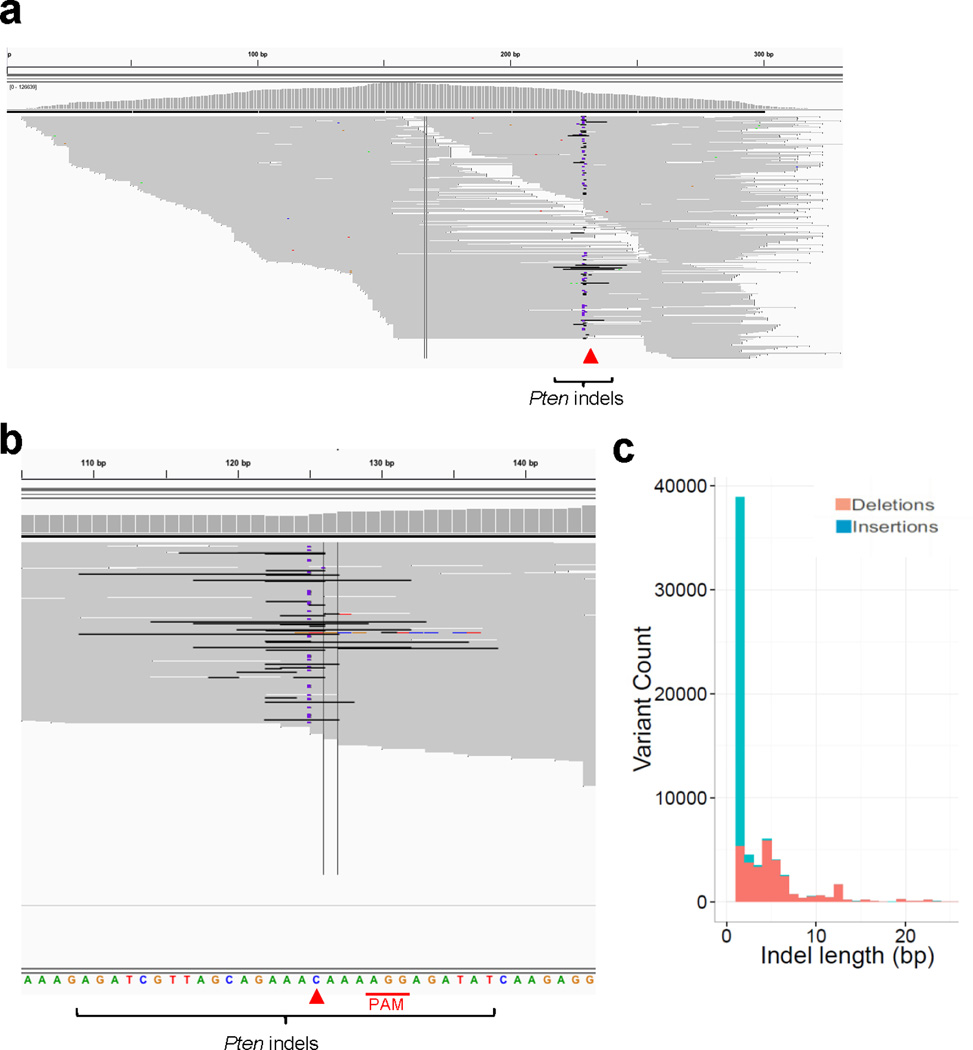
(a) pX330 plasmids expressing Cas9 and sgRNA targeting Pten (sgPten) were hydrodynamically injected into wild-type FVB mice to transiently express the CRISPR components in hepatocytes. (b) Bioluminescence imaging of mice hydrodynamically injected with a Luciferase plasmid (n=3). (c) Representative H&E and IHC staining of FVB mice injected with sgGFP (as a control) or sgPten, and Ptenfl/fl mice injected with Adeno-Cre for 2 weeks. Note the hepatocytes with clear cytoplasm on H&E sections, indicating lipid accumulation. Scale bars are 50μm. (d) Percentage of hepatocytes with negative or intermediate Pten staining. Error bars are s.d. (n=5 mice). (e) Pten indel frequency in the total liver genomic DNA (n=3 mice for sgGFP and n=5 mice for sgPten). (f-h) Representative Pten indels in sgPten treated mice. (f) Distribution of indel length. (g) Distribution of indel frame phase calculated as the length of indels modulus 3. (h) Representative IGV views of Pten indels in sgPten-treated mice. Black or purple bars indicate deletions or insertions, respectively. Arrowhead denotes predicted Cas9 cutting site. A full list of indels are in Supplementary Table 4. (i) Correlation between Pten loss determined by IHC and deep sequencing. Each dot is an individual mouse treated with sgPten.
To confirm that loss of Pten staining and function occurred due to CRISPR-mediated mutation of Pten, we performed deep sequencing on the captured targeted region of Pten locus of total liver genomic DNA. Sequencing revealed that 2.6±1.4% of the sequencing reads harbored indels at the Pten locus in sgPten-treated mice (n=5) compared to 0.5±0.1% in sgGFP-treated mice (n=3, p=0.02) (Fig. 1e). In the sgPten-treated livers, most of the sequence variants were predicted to cause frameshift mutations as inferred from insertion length and/or phase (Fig. 1f–g, Extended Data Fig. 4). For example, we observed frequent occurrence of 1nt or 2nt indels, which would lead to disruption of the Pten reading frame (Fig. 1f–h and Supplementary Table 4). These indels clustered at the predicted sgPten-induced Cas9 cutting site (Fig. 1h, Extended Data Fig. 4a), whereas the indels detected in sgGFP samples distribute randomly at low frequency, likely due to background PCR errors or sequencing errors (Extended Data Fig. 4b). Interestingly, in five independent mice, the frequency of Pten loss scored by IHC (including both full and partial loss of signal) strongly correlated with the frequency of Pten indels (Fig. 1i, R2=0.81). These data suggest that for most cells, expression of the sgPten vector results in complete mutation of all Pten alleles present in the cell. Because non-parenchymal cells (NPC) in the liver generally do not take up DNA following hydrodynamic injection, it is not surprising that the indel frequency in liver genomic DNA and the frequency of Pten-negative hepatocytes are not strictly equal.
To assess the long-term phenotype following sgPten treatment, we harvested livers from three sgPten-treated mice at four months. As shown in Figure 2a, these livers exhibited regions of hepatocytes with prominent lipid accumulation, loss of Pten and increased phospho-Akt staining, which fully phenocopies Pten knockout mice7, 8. To address whether sgPten induces p53 in hepatocytes, we performed p53 IHC on sgPten-treated liver sections at 14 days and 4 months. sgPten liver sections did not stain positively for p53, despite elevated phospho-Akt (Fig. 2a and Extended Data Fig. 5), suggesting that Pten loss does not activate the p53 pathway in the liver at these timepoints. Given the long tumor latency of liver tumors in Pten knockout mice (44–74 weeks)7, we were not surprised to find no tumors in sgPten-treated mice at timepoints up to 4 months.
Figure 2. Long term effects of sgPten in the liver and off-set CRISPR double nickase strategy.

(a) IHC on serial sections from sgPten-treated mice at 4 months post injection. Scale bars are 100μm. n=3 mice. The lower-left insets are high-magnification views. The “p53 ON” inset is a p53 restored liver tumor as a positive control30. (b) FVB mice were injected with Cas9D10A plus sgGFP (as a control) or plus a pair of off-set sgRNAs targeting Pten (sgPten2 and sgPten3) to introduce double nicking. Red arrowheads denote predicted Cas9D10A cutting sites. Total liver genomic DNA was analyzed by deep sequencing for Pten indels. Representative sequences were shown. (c) Frequency of Pten indels (n=2 mice). (d) Frame phase of Pten indels calculated as the length of indels modulus 3. (e) H&E and Pten IHC staining of liver sections. Arrows denote cells showing negative Pten staining or lipid accumulation. n=5 mice. Scale bar is 50μm.
Recent studies identified that Cas9 can tolerate mismatches between sgRNA and genomic DNA depending on the sgRNA sequence and position of mismatches9, 22. To characterize potential off-target effect of sgPten in the liver, we identified top-ranking sgPten off-target genomic sites in the mouse genome (Extended Data Fig. 6a) using a published prediction tool9. We amplified the Pten locus and the top three potential off-target sites from sgGFP- and sgPten- treated livers and measured CRISPR editing using the Surveyor assay2. In the sgPten-treated livers, the assay revealed 2.3±0.4% (n=2) indels at the Pten locus. In contrast, we did not detect surveyor nuclease cutting at the assayed off-target sites (Extended Data Fig. 6b), indicating that the frequency of off-target editing is below the limit of detection of this assay. Deep sequencing of a sgPten-treated liver sample revealed that the indels frequencies within 10nt regions around the top three predicted cutting sites were <0.1% (Supplementary Table 6).
We next tested a nickase version of Cas9, Cas9D10A, which only makes single strand DNA breaks and was reported to have further reduced levels of off-target effects23, 24. We designed a pair of Pten sgRNAs (Fig. 2b) predicted to generate off-set single-stranded DNA breaks24. The Cas9D10A plasmid and the two PCR products containing a U6 promoter driving expression of offset Pten sgRNAs (termed sgPten2/3) were introduced into FVB mice (n=5) by hydrodynamic injection. U6-sgGFP PCR DNA served as a control (n=5). By deep sequencing of the liver genomic DNA isolated from two mice at two weeks post injection, we observed 2.7±0.1% indels at the Pten locus in sgPten2/3-treated mice compared to 0.2±0.2% in sgGFP-treated mice (n=2) (Fig. 2c,d, Extended Data Fig. 4c and Supplementary Table 4). Pten-negative cells were observed in the sgPten2/3 livers (2.8±0.4%) but not in sgGFP controls (0.0±0.0%) by IHC staining (Fig. 2e) (n=5).
To test whether CRISPR-mediated mutation can target other tumor suppressor genes in vivo, we designed constructs to mutate p53 (also known as TP53 and Trp53), which is the most frequently mutated tumor suppressor gene in human cancer6. Exome sequencing studies have identified frequent mutations of p53 and PTEN in human cholangiocarcinoma25. An sgRNA construct targeting p53 was cloned into the pX330 plasmid (termed sgp53)26. Transfection of sgp53 into 3T3 cells led to frequent p53 indels, as measured by deep sequencing (Extended Data Fig. 7 and Supplementary Table 5). We next injected a cohort of FVB mice with sgp53 alone. These mice did not exhibit liver tumors at three months post injection (Extended Data Fig. 8a), which is consistent with previous studies showing that liver-specific p53 knockout mice develop liver tumors only after 14 months27. We also performed deep sequencing of sgp53-treated livers at 14 days and detected 6.0±0.1% indels at the p53 locus (Extended Data Fig. 8b and Supplementary Table 4), demonstrating that sgp53 can directly generate mutations in p53 in the mouse liver.
In an effort to mutate two tumor suppressor genes simultaneously, we co-injected sgPten and sgp53 into FVB mice (Fig. 3a). As shown in Fig. 3b and Extended Data Figure 9, indels were observed in total liver DNA isolated from two animals, at frequencies of 4.0±0.1% for Pten and 6.4±0.1% for p53, enriched at the predicted cutting sites. At 3 months post injection, all 5 mice co-injected with sgPten and sgp53 developed liver tumors with bile duct differentiation features (Fig. 3c), while none of sgGFP-injected mice (n=5) developed tumors. The tumors were positive for Cytokeratin 19, a marker of bilinear lineage cells27 (Fig. 3c). Ptenfl/fl;p53fl/fl conditional knockout mice (n=5) injected with Adeno-Cre also developed liver tumors of similar histology at 3 months (Fig. 3c). When injected alone, neither sgPten alone nor sgp53 caused any detectable tumors at this time point. Sequencing of the sgPten- plus sgp53- induced liver tumors and tumor-derived cell lines (n=5 tumors analyzed) showed bi-allelic mutations of both genes (Fig. 3d and Supplementary Table 7). These results demonstrate that CRISPR-mediated mutation of Pten and p53 can induce liver tumor development, supporting the use of multiplexed CRISPR editing of cancer genes, at least in this tissue.
Figure 3. Multiplexed CRISPR targeting Pten and p53 induces tumor formation in murine liver.

(a) pX330 plasmids expressing sgPten and sgp53 were hydrodynamically injected into FVB mice. (b) Frequency of Pten and p53 indels quantified by MiSeq (n=2 mice) at 14 days post injection. (c) Representative H&E and IHC staining of FVB mice injected with sgGFP (as a control) or sgPten+sgp53, and Ptenfl/fl;p53fl/fl mice injected with Adeno-Cre. Arrows indicate Ck19+ bile duct cells in sgGFP mice. Scale bars are 100μm. n=5 mice. (d) Representative sequences of Pten and p53 loci in sgPten+sgp53 induced liver tumors (n=5 tumors).
To determine whether CRISPR can be used to directly introduce gain-of-function mutations, we targeted the Ctnnb1 gene, which encodes β-Catenin, a transcription factor in the WNT pathway that is frequently mutated in liver cancer28. Phosphorylation of four serine/threonine residues leads to degradation of β-Catenin (Fig. 4a)28. We co-injected FVB mice with two pX330 plasmids carrying sgRNAs targeting Ctnnb1 (termed sgβ-Catenin) and a 200nt single-stranded DNA (ssDNA) oligo harboring four point mutations that cause serine/threonine to alanine mutations (Fig. 4a) that have been shown to abolish phosphorylation and cause stabilization and nuclear localization of β-Catenin28. In mice injected with either sgβ-Catenin or ssDNA alone (n=5), β-Catenin was localized only at cell junctions as shown by IHC (Fig. 4b,c). In contrast, in five mice injected with sgβ-Catenin and ssDNA, we observed that ~0.5% of hepatocytes exhibited nuclear β-Catenin at 7 days post injection (Fig. 4b,c). Moreover, accumulation of β-Catenin was associated with increased levels of glutamine synthetase (GS), a β-Catenin target gene29 (Fig. 4c and Extended Data Fig. 10a) and reduced phospho-β-Catenin (Fig. 4d). In addition, we subjected the liver DNA from two mice treated with this combination to deep sequencing. The data confirm that a small but detectable percentage of sequencing reads contained the four “G” point mutations present in the ssDNA (Fig. 4e and Extended Data Fig. 10b). sgβ-Catenin also generated indels clustered at the predicted Cas9 cutting sites (Supplementary Table 8). These data demonstrate that CRISPR system can be used to directly induce gain-of-function mutation or other substitutions via homologous recombination in vivo20.
Figure 4. CRISPR introduces β-Catenin mutations in the liver.

(a) FVB mice were co-injected with two sgRNAs targeting the β-Catenin gene Ctnnb1 (sgβ-Catenin) and a 200nt single-stranded DNA (ssDNA) oligo harboring four alanine point mutations (red) which abolish phosphorylation of serine and threonine sites of β-Catenin. Codons are underlined. PAM sequences are marked in blue. (b) Quantification of hepatocytes with nuclear β-Catenin IHC staining at day 7. Mice were injected with indicated combination. sgGFP serves as a control sgRNA. n=5 mice. *, p<0.05. (c) IHC on serial liver sections. Glutamine synthetase (GS) is normally expressed surrounding the central veins (left). Arrowheads indicate overlap of β-Catenin and GS staining outside the central vein (CV) region (right). Scale bars are 100μm. (d) Single confocal sections show nuclear β-Catenin and loss of cytoplasmic phospho-β-Catenin in the cell indicated by an arrow. Scale bars are 100 µm. (e) Representative Ctnnb1 deep sequencing reads in sgβ-Catenin+ssDNA treated mice. Each grey bar represents a sequencing read. Ctnnb1 reference sequence is shown in the bottom. Reads match the reference sequence are in grey. Variant bases are in colors (G in orange). n=2 mice.
Our data illustrate the potential to directly disrupt tumor suppressor genes and generate point mutations in oncogenes in adult mouse liver using the CRISPR/Cas system. This method bypasses the need to engineer ES cells and to breed multiple mutant animals together to generate compound mutants. This approach generated compound Pten and p53 indels at low frequency but was sufficient to induce multifocal tumors. We anticipate that this method will allow for more rapid testing of any single genes or gene combinations that are suspected of being capable of initiating tumor formation in the liver. Given the number of candidate cancer genes being discovered through NGS efforts, simplified methods of testing the oncogenic properties of candidates in vivo are critical. To increase the sensitivity of the assay, one could perform the CRISPR/Cas9-mediated mutagenesis on a “sensitized” background carrying constitutive or conditional mutation in a tumor suppressor gene such as p53. More efficient delivery techniques, such as adenovirus or adeno-associated virus (Ran et al, submitted), more potent sgRNAs, and longer HR templates might also improve the overall efficiency of this method and expand the range of tissue that could be targeted. Consistent with recent studies showing long-term Cas9/sgRNA expression is not toxic in cells26, hydrodynamic injection of Cas9/sgGFP in mice was well tolerated and did not trigger weight loss in mice20. However, further studies are required to fully evaluate the side effects of the CRISPR system in mice and other organisms. This study underscores the power of the CRISPR/Cas9 system for rapid genome editing and the development of novel cancer models in the mouse.
Materials and Methods
CRISPR vectors
pX330 vector9 was digested with BbsI and ligated with annealed oligos (Supplementary Table 1). An extra G is added for sgRNAs lacking a 5’ G for U6 transcriptional initiation. Cas9D10A nickase vector was from addgene4. sgPten2 and sgPten3 were PCR amplified from empty pX330 plasmid using the U6 forward primer and sgRNA reverse ultramer oligos9 (Supplementary Table 2, 3) and PCR purified.
Mice and hydrodynamic injection
All animal study protocols were approved by the MIT Animal Care and Use Committee. Cohorts of Ptenflox/flox and Ptenflox/flox;p53flox/flox mice were infected with 1×10⁸ (Fig. 1) or 1×10⁹ (Fig. 3) plaque-forming units (PFU) of Adeno-Cre (University of Iowa) in 100μl PBS by intravenous injection. Vectors for hydrodynamic tail vein injection were prepared using the EndoFreeMaxi Kit (Qiagen). For hydrodynamic liver injection, plasmid DNA suspended in 2ml saline was injected via the tail vein in 5–7 seconds into 8 weeks old female FVB/NJ mice (Jackson lab). No randomization or blinding was used. The amount of injected DNA was 60μg for sgPten, 60μg each for sgPten+sgp53, 40μg Cas9D10A+2μg sgPten2 PCR+2μg sgPten3 PCR for off-set sgRNA study, and 30μg sgβ-Catenin.1, 30μg sgβ-Catenin.2 and 60μg ssDNA for the β-Catenin experiment. An equal amount of sgGFP was used as a control for each experiment. The Ptenflox/flox;p53flox/flox and sgPten+sgp53 mice were dosed with CCl4 as in31.
Immunohistochemistry and immunofluorescence
Mice were sacrificed by carbon dioxide asphyxiation. Livers were fixed in 4% formalin overnight, embedded in paraffin, sectioned at 4 μm and stained with hematoxylin and eosin (H&E) for pathology. Liver sections were de-waxed, rehydrated and stained using standard immunohistochemistry protocols32. The following antibodies were used: anti-Pten (Cell Signaling, 9559, 1:100), anti-pAkt S473 (Cell Signaling, 4060, 1:50), β-Catenin (BD,610154, 1:100), anti-p53 (CM5, 1:300), anti-GS (BD 610517, 1:200) and anti-Ck19 (Abcam, ab133496, 1:100). The number of hepatocytes was quantified from >3 low-magnification fields per mouse with 5 mice per group. Immunofluorescence was performed as previously described32. β-Catenin (BD,610154) and phospho-β-Catenin (Abcam, ab53050) antibodies were used. Slides were counterstained with 4, 6-diamidino-2-phenylindole (DAPI). Images were obtained with a Nikon A1R laser scanning confocal microscope using a 40× APO Fluor objective (NA 0.65).
Bioluminescence imaging
5μg luciferase plasmids were hydrodynamically injected into FVB mice. 24 hours later, bioluminescence imaging (Xenogen) was performed as previously described32.
Genomic DNA purification and Surveyor assay
Genomic DNA from liver or tumor was purified from High Pure PCR Template Preparation Kit (Roche 11796828001). 3T3 cells were transiently transfected with pX330 and a GFP plasmid. Top 20% GFP+ cells were sorted by FACS and genomic DNA was purified at 72 hours post transfection. Off-target sites were predicted using http://crispr.mit.edu/. For surveyor assay, PCR products (Supplementary Table 3) were gel purified and treated with Surveyor nuclease kit (Transgenomic). DNA was separated on 4–20% Novex TBE Gels (Life Technologies) and stained with ethidium bromide. Quantization of surveyor bands was as in9. For sequencing of liver tumors and matched tumor-derived cell lines, PCR products of the Pten and p53 genomic regions were cloned using Zero Blunt TOPO PCR Cloning Kit (Life Technologies) and analyzed by Sanger sequencing. One tumor from each animal was analyzed.
Deep sequencing of CRISPR modified Pten and p53 loci
Genomic region of Pten and p53 was PCR amplified using Herculase II high-fidelity polymerase and gel purified. Libraries were made from 50ng of the PCR products using the Nextera protocol and sequenced on Illumina MiSeq (150bp paired-end) and HiSeq2500 (100bp paired-end, β-Catenin samples) machines. Data were processed according to standard Illumina sequencing analysis procedures. Briefly, reads were mapped to the PCR amplicons as reference sequences using bwa with custom scripts33. Insertions and deletions were called against reference using VarScan2. Indel phase was calculated as the length of insertions or deletions modulus 3. The rate of β-Catenin donor integration was calculated as donor allele frequency. Indel at Pten G304 exist at the same frequency across all samples, thus possibly arise from PCR or sequencing errors, and was filtered out in final analysis. Two to five biological replicates were sequenced for in vivo liver samples. One DNA sample was sequenced for Pten and p53 in 3T3 cells and for Pten off-target sites in sgPten treated liver. To compare the editing efficiency at Pten off-target sites, the indel frequency within 10nt regions (20nt total) flanking Pten A124, OT1 G209, OT2 G451, OT3 G265 was calculated. Accession codes. BioProject: PRJNA252101
Statistics
P values were determined by Student’s t-tests for all IHC quantifications.
Extended Data
Extended Data Figure 1. Representative Pten indels in sgPten treated 3T3 cells.
mouse 3T3 cells were co-transfected with sgPten and a GFP plasmid. The highest 20% of GFP positive cells were sorted to enrich for cells expressing sgPten. Deep sequencing of the Pten locus revealed 36.4% Pten indels in this context (Supplementary Table 5), presumably due to the more efficient delivery of sgPten via cell culture transfection and sorting. Red arrowheads denote predicted Cas9 cutting sites. Black or purple bars in grey sequencing reads indicate deletions or insertions, respectively. Other colors indicate SNPs. (a) Pten PCR region. (b) Zoom in view. n=1 DNA sample. (c) Distribution of Pten indel length.
Extended Data Figure 2.
(a–b) Low magnification images of Pten IHC in sgGFP (a) and sgPten (b) treated mice. Scale bar is 100μm. (c-d) IHC on serial sections from sgPten treated mice. Black arrows denote cells with negative Pten staining and positive pAkt staining. White arrowhead denotes cells with intermediate Pten staining, potentially indicating heterozygous Pten mutation or multi-nucleated hepatocytes with partial Pten loss. Insets show high magnification IHC images. Scale bar is 100μm. n=5 mice. The frequency of Pten-deficient cells is likely a reflection of the transduction efficiency following hydrodynamic injection and the time required to achieve mutation. A recent study by our groups has shown that ~17% of hepatocytes were FLAG-Cas9 positive by IHC one day following hydrodynamic injection, only 1.4% of cells on day 7, and less than 0.3% at one month20. Given that Cas9-mediated genome editing usually takes more than 48 hours2, the fraction of hepatocytes that productively express Cas9 and an sgRNA after hydrodynamic injection is estimated to be less than 17%.
Extended Data Figure 3. sgPten induces lipid accumulation in the liver.
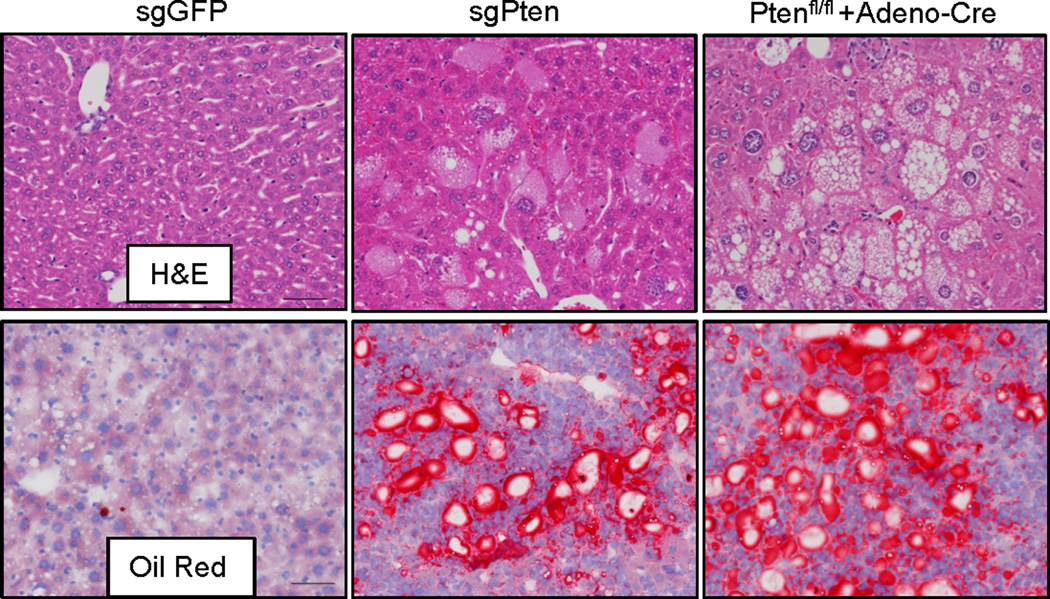
FVB mice were with injected with sgGFP or sgPten (n=5). 2 months later, liver sections were stained for Oil Red, a marker for lipid accumulation. Scale bars are 50μm.
Extended Data Figure 4. sgPten generated indels at the Pten locus in the liver.

(a) Representative indel frequency in (a). */+C denotes “C” insertion and */-AA denotes “AA” deletion. Basepair position denotes position along the Pten reference sequence. (b) Representative Pten indel frequency in sgGFP mice. Note the low mutant allele frequency compared to (a). sgPten samples show indels peaking at the predicted Cas9 cutting site while sgGFP indels distribute randomly. (c) Representative indel frequency in Cas9D10A+sgPten2/3 treated mice.
Extended Data Figure 5. Pten deletion in the liver does not induce p53.
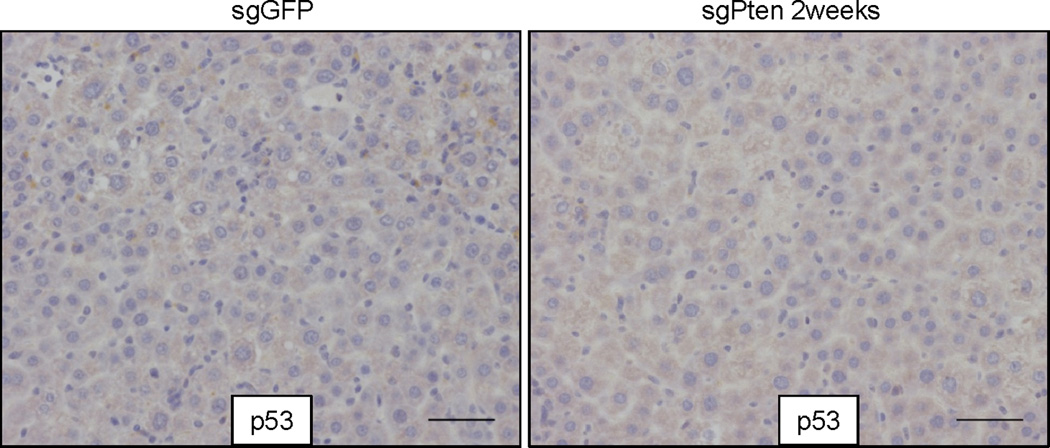
Liver sections from sgGFP or sgPten-treated mice at 2 weeks were stained for p53 IHC. n=3 mice. Scale bars are 50μm. Positive control from a p53 restoration tumor was shown in the Fig. 2a inset (p53 ON) (Xue et al, 2007).
Extended Data Figure 6. Assessing off-target cutting of sgPten.
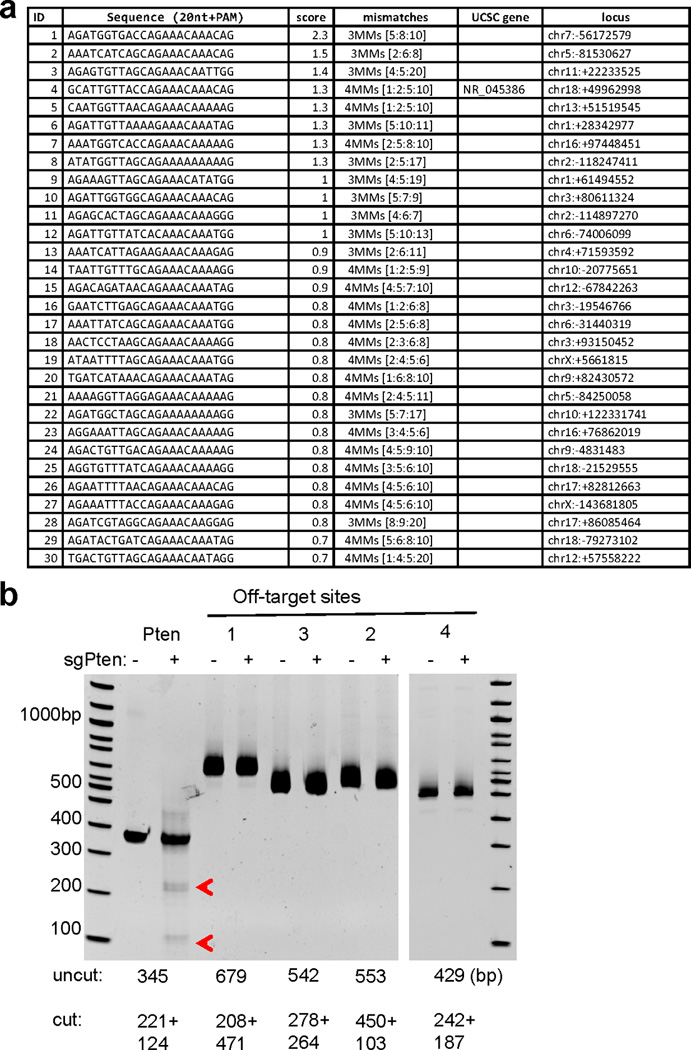
(a) Top 30 potential off-target sites for sgPten in the mouse genome. Score is likelihood of off-target binding. Only site 4 is in the exon region of NR_045386, which is a long non-coding RNA. (b) Surveyor assay in sgGFP (-) and sgPten (+) treated liver genomic DNA. Pten and Pten Off targets sites 1,2,3 and 4 were PCR amplified .Predicted size of uncut and cut bands are indicated. Red arrowheads indicate denote surveyor nuclease-cleaved Pten PCR products. The data are representative of two independent liver samples.
Extended Data Figure 7. Representative p53 indels in sgp53 treated 3T3 cells.
Red arrowheads denote predicted Cas9 cutting sites. Black or purple bars in grey sequencing reads indicate deletions or insertions, respectively. (a) p53 PCR region. (b) Zoom in view. n=1 DNA sample.
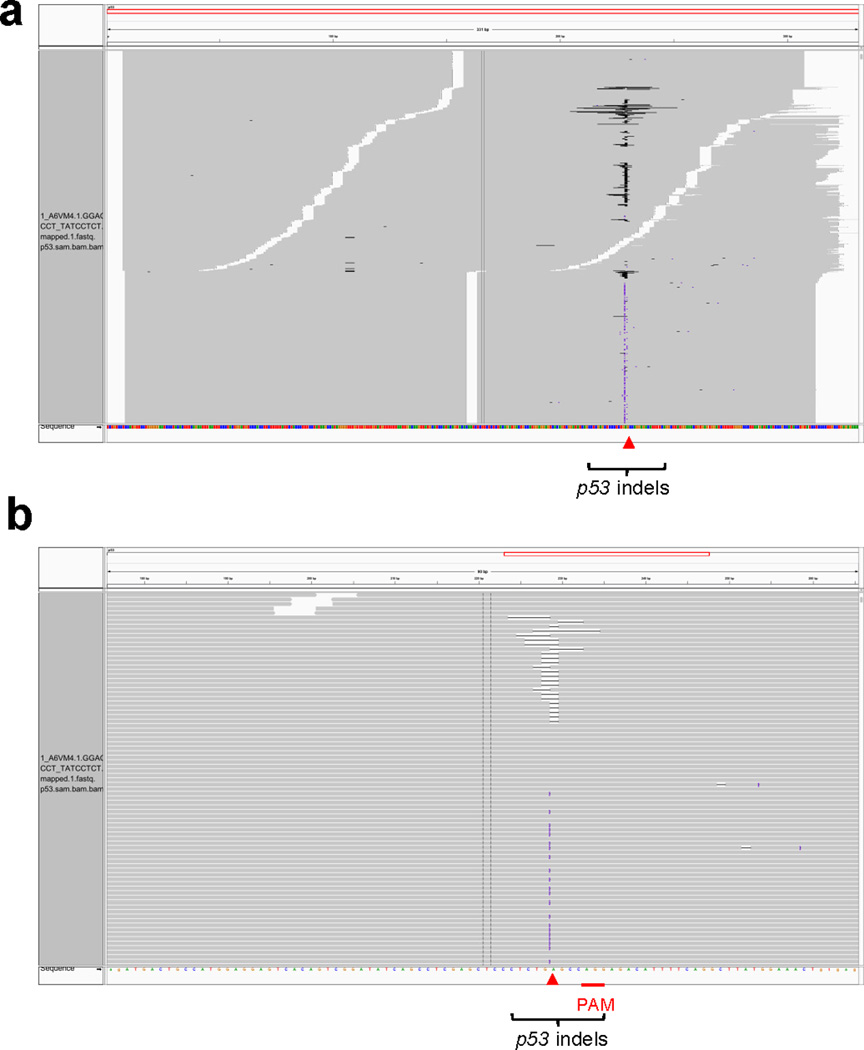
Extended Data Figure 8. Analyzing sgp53-treated livers.
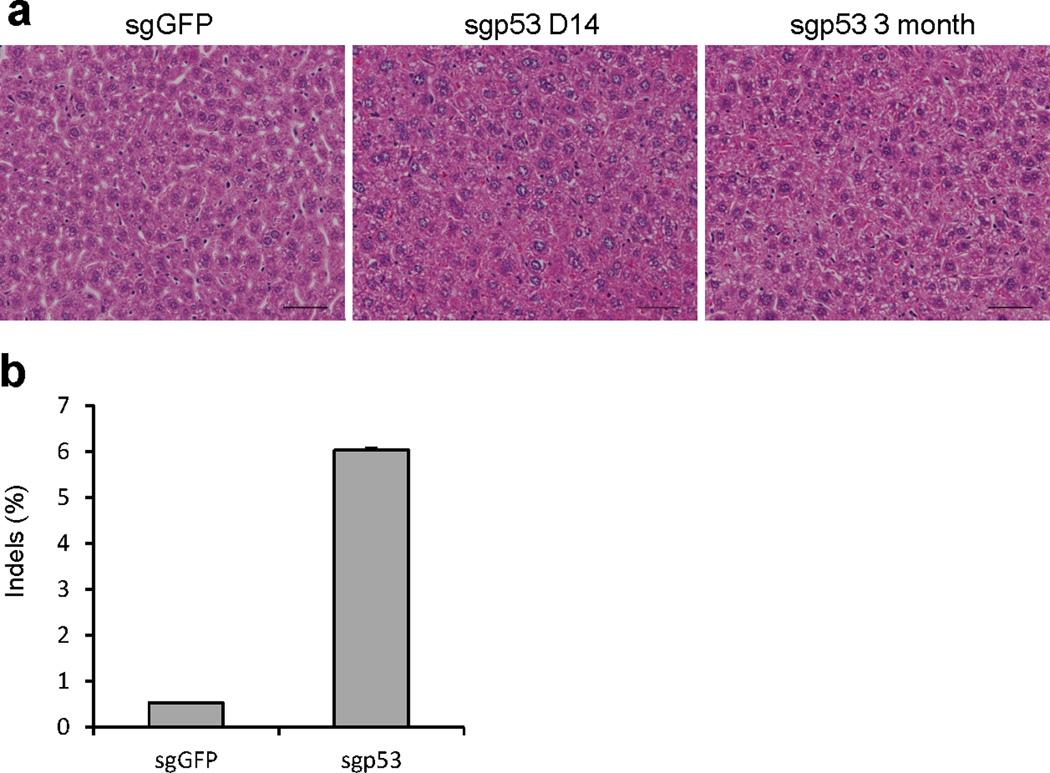
(a) Histology of sgp53-treated livers. Scale bars=50μm. n=3 mice. (b) p53 indel frequency was measured by MiSeq at day 14. Error bars are s.d. (n=2 mice).
Extended Data Figure 9. sgPten and sgp53 generated indels in the liver.
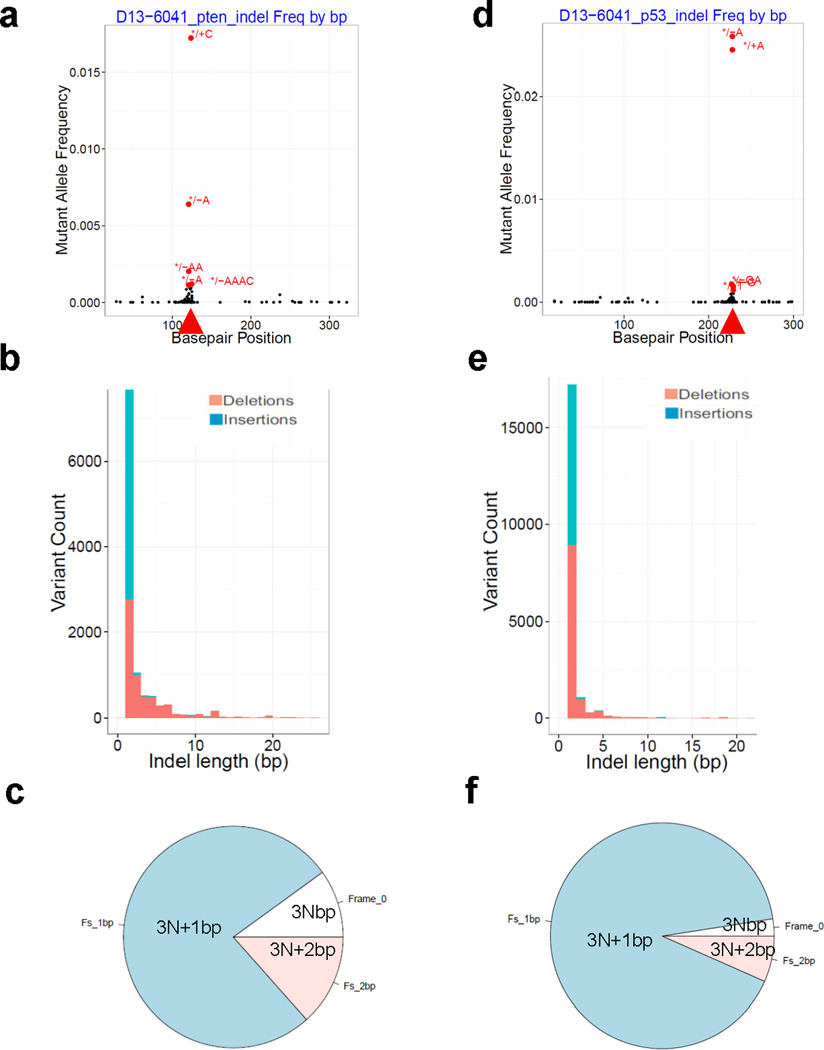
sgPten and sgp53 were co-injected into FVB mice. Representative analysis of MiSeq is shown. n=2 mice. (a-c) Pten locus. (d-f) p53 locus. (a, d) Indel frequency. */+ indicates insertions and */– indicates deletions. Basepair position denotes position along the Pten or p53 reference sequences. Arrowheads denote predicted Cas9 cutting sites. (b, e) Distribution of indel length. (c, f) Distribution of indel frame phase. Frame phase of indels was calculated as the length of indels modulus 3.
Extended Data Figure 10.
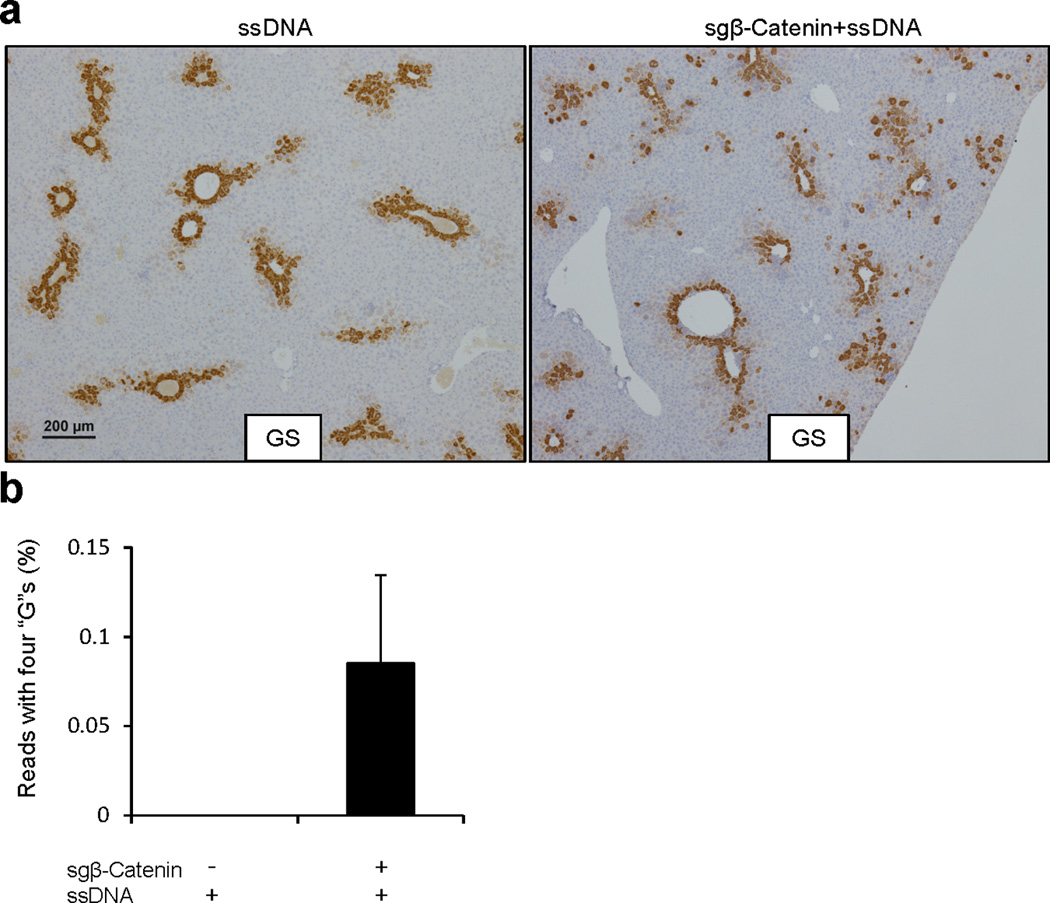
(a) Low magnification images of glutamine synthetase (GS) IHC as in Fig. 4c. (b) Frequency of Ctnnb1 deep sequencing reads with all four “G” nucleotides. The rate of β-Catenin donor integration was calculated as donor allele frequency. n=2 mice.
Supplementary Material
1
Supp Table4
Supp Table5
Supp Table6
Supp Table7
Supp Table8
Acknowledgements
We thank D. McFadden, N. Dimitrova, E. Snyder, A. Farago, M. Muzumdar, F. Sanchez-Rivera, J. Doench, L. Cong and S. Levine for discussions and for sharing reagents. We thank the Koch Institute Swanson Biotechnology Center (SBC) for technical support, specifically the Hope Babette Tang (1983) Histology Facility and K. Cormier. This work was supported by grants 2-PO1-CA42063, RO1-EB000244, RO1-CA115527, and RO1-CA132091 from the National Institutes of Health and supported in part by Cancer Center Support (core) grant P30-CA14051 from the National Cancer Institute. This work was supported, in part, by NIH Grant R01-CA133404 and Casimir-Lambert Fund to P. A. S. H.Y. is supported by 5-U54-CA151884-04 NIH Centers for Cancer Nanotechnology Excellence and the Harvard-MIT Center of Cancer Nanotechnology Excellence. S. C. is a Damon Runyon Fellow (DRG-2117-12). W.X. was supported by fellowships from the American Association for Cancer Research and the Leukemia Lymphoma Society and is currently supported by grant 1K99CA169512. T.J. is a Howard Hughes Medical Institute (HHMI) Investigator, the David H. Koch Professor of Biology, and a Daniel K. Ludwig Scholar. The authors wish to dedicate this paper to the memory of Officer Sean Collier, for his caring service to the MIT community and for his sacrifice.
Footnotes
Author Contributions
W.X., S.C., H.Y., and T.J. designed the study. W.X., S.C., H.Y., T.T., W.C., and G.Y. performed experiments and analyzed data. D.G.C. and R.B. performed histology and evaluations. T.P., N.S.J., F.Z., and D.A.G. provided reagents and conceptual advice. W.X., S.C., H.Y., P.A.S., and T.J. wrote the manuscript with comments from all authors.
Reference
- 1.Van Dyke T, Jacks T. Cancer modeling in the modern era: progress and challenges. Cell. 2002;108:135–144. doi: 10.1016/s0092-8674(02)00621-9. [DOI] [PubMed] [Google Scholar]
- 2.Cong L, et al. Multiplex genome engineering using CRISPR/Cas systems. Science. 2013;339:819–823. doi: 10.1126/science.1231143. [DOI] [PMC free article] [PubMed] [Google Scholar]
- 3.Jinek M, et al. A programmable dual-RNA-guided DNA endonuclease in adaptive bacterial immunity. Science. 2012;337:816–821. doi: 10.1126/science.1225829. [DOI] [PMC free article] [PubMed] [Google Scholar]
- 4.Mali P, et al. RNA-guided human genome engineering via Cas9. Science. 2013;339:823–826. doi: 10.1126/science.1232033. [DOI] [PMC free article] [PubMed] [Google Scholar]
- 5.Song MS, Salmena L, Pandolfi PP. The functions and regulation of the PTEN tumour suppressor. Nat Rev Mol Cell Biol. 2013;13:283–296. doi: 10.1038/nrm3330. [DOI] [PubMed] [Google Scholar]
- 6.Feldser DM, et al. Stage-specific sensitivity to p53 restoration during lung cancer progression. Nature. 2010;468:572–575. doi: 10.1038/nature09535. [DOI] [PMC free article] [PubMed] [Google Scholar]
- 7.Horie Y, et al. Hepatocyte-specific Pten deficiency results in steatohepatitis and hepatocellular carcinomas. J Clin Invest. 2004;113:1774–1783. doi: 10.1172/JCI20513. [DOI] [PMC free article] [PubMed] [Google Scholar]
- 8.Stiles B, et al. Liver-specific deletion of negative regulator Pten results in fatty liver and insulin hypersensitivity [corrected] Proc Natl Acad Sci U S A. 2004;101:2082–2087. doi: 10.1073/pnas.0308617100. [DOI] [PMC free article] [PubMed] [Google Scholar]
- 9.Hsu PD, et al. DNA targeting specificity of RNA-guided Cas9 nucleases. Nat Biotechnol. 2013;31:827–832. doi: 10.1038/nbt.2647. [DOI] [PMC free article] [PubMed] [Google Scholar]
- 10.Mali P, Esvelt KM, Church GM. Cas9 as a versatile tool for engineering biology. Nat Methods. 2013;10:957–963. doi: 10.1038/nmeth.2649. [DOI] [PMC free article] [PubMed] [Google Scholar]
- 11.Sander JD, Joung JK. CRISPR-Cas systems for editing, regulating and targeting genomes. Nat Biotechnol. 2014;32:347–355. doi: 10.1038/nbt.2842. [DOI] [PMC free article] [PubMed] [Google Scholar]
- 12.Fellmann C, Lowe SW. Stable RNA interference rules for silencing. Nat Cell Biol. 2013;16:10–18. doi: 10.1038/ncb2895. [DOI] [PMC free article] [PubMed] [Google Scholar]
- 13.Wang H, et al. One-step generation of mice carrying mutations in multiple genes by CRISPR/Cas-mediated genome engineering. Cell. 2013;153:910–918. doi: 10.1016/j.cell.2013.04.025. [DOI] [PMC free article] [PubMed] [Google Scholar]
- 14.Yang H, et al. One-step generation of mice carrying reporter and conditional alleles by CRISPR/Cas-mediated genome engineering. Cell. 2013;154:1370–1379. doi: 10.1016/j.cell.2013.08.022. [DOI] [PMC free article] [PubMed] [Google Scholar]
- 15.Li W, Teng F, Li T, Zhou Q. Simultaneous generation and germline transmission of multiple gene mutations in rat using CRISPR-Cas systems. Nat Biotechnol. 2013;31:684–686. doi: 10.1038/nbt.2652. [DOI] [PubMed] [Google Scholar]
- 16.Li D, et al. Heritable gene targeting in the mouse and rat using a CRISPR-Cas system. Nat Biotechnol. 2013;31:681–683. doi: 10.1038/nbt.2661. [DOI] [PubMed] [Google Scholar]
- 17.Shen B, et al. Generation of gene-modified mice via Cas9/RNA-mediated gene targeting. Cell Res. 2013;23:720–723. doi: 10.1038/cr.2013.46. [DOI] [PMC free article] [PubMed] [Google Scholar]
- 18.Wu Y, et al. Correction of a Genetic Disease in Mouse via Use of CRISPR-Cas9. Cell Stem Cell. 2013;13:659–662. doi: 10.1016/j.stem.2013.10.016. [DOI] [PubMed] [Google Scholar]
- 19.Niu Y, et al. Generation of Gene-Modified Cynomolgus Monkey via Cas9/RNA-Mediated Gene Targeting in One-Cell Embryos. Cell. 2014 doi: 10.1016/j.cell.2014.01.027. [DOI] [PubMed] [Google Scholar]
- 20.Yin H, et al. Genome editing with Cas9 in adult mice corrects a disease mutation and phenotype. Nat Biotechnol. 2014 doi: 10.1038/nbt.2884. [DOI] [PMC free article] [PubMed] [Google Scholar]
- 21.Liu F, Song Y, Liu D. Hydrodynamics-based transfection in animals by systemic administration of plasmid DNA. Gene Ther. 1999;6:1258–1266. doi: 10.1038/sj.gt.3300947. [DOI] [PubMed] [Google Scholar]
- 22.Fu Y, et al. High-frequency off-target mutagenesis induced by CRISPR-Cas nucleases in human cells. Nat Biotechnol. 2013;31:822–826. doi: 10.1038/nbt.2623. [DOI] [PMC free article] [PubMed] [Google Scholar]
- 23.Mali P, et al. CAS9 transcriptional activators for target specificity screening and paired nickases for cooperative genome engineering. Nat Biotechnol. 2013;31:833–838. doi: 10.1038/nbt.2675. [DOI] [PMC free article] [PubMed] [Google Scholar]
- 24.Ran FA, et al. Double nicking by RNA-guided CRISPR Cas9 for enhanced genome editing specificity. Cell. 2013;154:1380–1389. doi: 10.1016/j.cell.2013.08.021. [DOI] [PMC free article] [PubMed] [Google Scholar]
- 25.Ong CK, et al. Exome sequencing of liver fluke-associated cholangiocarcinoma. Nat Genet. 2012;44:690–693. doi: 10.1038/ng.2273. [DOI] [PubMed] [Google Scholar]
- 26.Malina A, et al. Repurposing CRISPR/Cas9 for in situ functional assays. Genes Dev. 2013;27:2602–2614. doi: 10.1101/gad.227132.113. [DOI] [PMC free article] [PubMed] [Google Scholar]
- 27.Katz SF, et al. Disruption of Trp53 in livers of mice induces formation of carcinomas with bilineal differentiation. Gastroenterology. 2012;142:1229–1239. doi: 10.1053/j.gastro.2012.02.009. [DOI] [PubMed] [Google Scholar]
- 28.Moon RT, Kohn AD, De Ferrari GV, Kaykas A. WNT and beta-catenin signalling: diseases and therapies. Nat Rev Genet. 2004;5:691–701. doi: 10.1038/nrg1427. [DOI] [PubMed] [Google Scholar]
- 29.Tward AD, et al. Distinct pathways of genomic progression to benign and malignant tumors of the liver. Proc Natl Acad Sci U S A. 2007;104:14771–14776. doi: 10.1073/pnas.0706578104. [DOI] [PMC free article] [PubMed] [Google Scholar]
- 30.Xue W, et al. Senescence and tumour clearance is triggered by p53 restoration in murine liver carcinomas. Nature. 2007;445:656–660. doi: 10.1038/nature05529. [DOI] [PMC free article] [PubMed] [Google Scholar]
- 31.Zender L, et al. Identification and validation of oncogenes in liver cancer using an integrative oncogenomic approach. Cell. 2006;125:1253–1267. doi: 10.1016/j.cell.2006.05.030. [DOI] [PMC free article] [PubMed] [Google Scholar]
- 32.Xue W, et al. Response and Resistance to NF-kappaB Inhibitors in Mouse Models of Lung Adenocarcinoma. Cancer Discov. 2011;1:236–247. doi: 10.1158/2159-8290.CD-11-0073. [DOI] [PMC free article] [PubMed] [Google Scholar]
- 33.Chen S, et al. Global microRNA depletion suppresses tumor angiogenesis. Genes Dev. 2014 doi: 10.1101/gad.239681.114. [DOI] [PMC free article] [PubMed] [Google Scholar]
Associated Data
This section collects any data citations, data availability statements, or supplementary materials included in this article.
Supplementary Materials
1
Supp Table4
Supp Table5
Supp Table6
Supp Table7
Supp Table8