Synchronous and Stochastic Patterns of Gene Activation in the Drosophila Embryo (original) (raw)
. Author manuscript; available in PMC: 2014 Dec 30.
Published in final edited form as: Science. 2009 Jul 24;325(5939):471–473. doi: 10.1126/science.1173976
Abstract
Drosophila embryogenesis is characterized by rapid transitions in gene activity, whereby crudely distributed gradients of regulatory proteins give way to precise on/off patterns of gene expression. To explore the underlying mechanisms, a partially automated, quantitative in situ hybridization method was used to visualize expression profiles of 14 developmental control genes in hundreds of embryos. These studies revealed two distinct patterns of gene activation: synchronous and stochastic. Synchronous genes display essentially uniform expression of nascent transcripts in all cells of an embryonic tissue, whereas stochastic genes display erratic patterns of de novo activation. RNA polymerase II is “pre-loaded” (stalled) in the promoter regions of synchronous genes, but not stochastic genes. Transcriptional synchrony might ensure the orderly deployment of the complex gene regulatory networks that control embryogenesis.
Eukaryotic transcription is an intrinsically stochastic process due to variability in the recruitment and subsequent assembly of the RNA polymerase II (Pol II) complex and associated coactivator complexes such as Mediator, TFIID, and TFIIH (1–4). Consequently, not all cells that receive the same inducing signal would be expected to respond at precisely the same time. Recent studies have shown that many of the developmental control genes governing Drosophila embryogenesis are bound by Pol II before their induction (5, 6). This “pre-loaded” (or stalled) Pol II accelerates the induction of transcription of the Drosophila heat shock genes upon stress. In principle, any cell-to-cell variation in the onset of transcription might be diminished for genes containing stalled Pol II.
The early Drosophila embryo is an ideal system to examine variability in the onset of de novo transcription within a developmental field of coordinately induced cells. However, most previous studies examined relatively few embryos (7–11). To distinguish subtle differences in the patterns of transcriptional induction, we used computational methods to process hundreds of staged embryos in a quantitative and unbiased fashion. This procedure employs in situ hybridization with a battery of fluorescent probes against large intronic regions of the target genes, high-resolution confocal microscopy, and semi-automated image segmentation algorithms [see methods section in the supporting online material (SOM)]. This method can detect most nascent transcripts at the onset of transcription (Fig. 1).
Fig. 1.
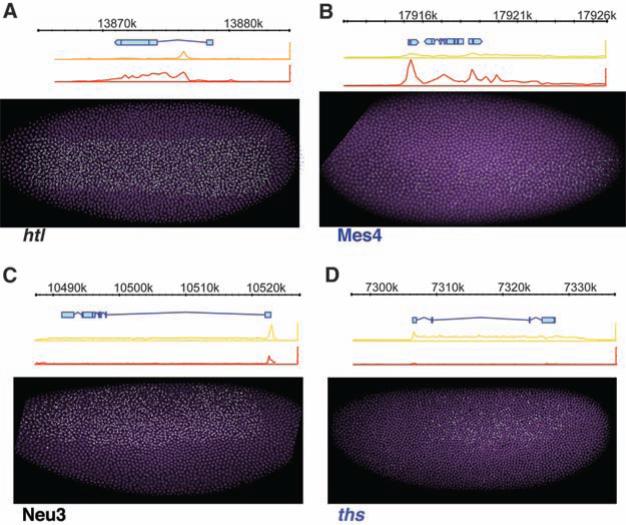
Assaying asynchrony of gene expression. (A to D) Nascent transcripts tagged with fluorescent probes (green) in whole-mount embryos allow for the activation state of each nucleus (purple) to be determined. All embryos are oriented anterior to the left, dorsal side to the top. The diagram above each image shows the gene prediction models (blue) and Pol II ChIP-chip binding data in dorsal-ectoderm (orange), neural-ectoderm (yellow), or mesodermal (red) tissue (37). htl and Mes4 are simultaneously expressed in the mesoderm [(A) and (B)]. Neu3 and ths are simultaneously expressed in the neural-ectoderm [(C) and (D)]. Genes that show a peak Pol II binding in the ChIP-chip data at the promoter in all tissues regulate transcriptional elongation via stalled polymerase [(A) and (C)]. Genes that lack promoter proximal Pol II binding in inactive tissue are nonstalled [(B) and (D)]. Gene names shown in black are stalled; purple are nonstalled.
We began the analysis with six genes that are activated at approximately the same stage (early nuclear cleavage cycle 14) in the presumptive mesoderm. Three of the genes, Mes4 (12) [or NF-Yc (13)], Myocyte Enhancing Factor 2 (Mef2) (14), and heartbroken (hbr) (15) [_or downstream of FGF_ (16) or stumps (17)], lack stalled Pol II in tissues where the genes are inactive but display Pol II binding across the length of the transcription unit in the mesoderm when expressed (see diagrams above embryos in Fig. 1B and fig. S2). At the time of induction, all three genes display stochastic patterns of expression, as judged by the nuclear hybridization “dots” representing de novo transcripts. However, within 30 min after induction, hybridization dots are detected in most mesodermal nuclei of most embryos (fig. S4).
Very different results were obtained with heart-less (htl) (18) (FGF receptor), Mes2 (a SANT-domain transcription factor) (16), and Mdr49 [a membrane adenosine triphosphatase, also called Mes5 (19)], which contain stalled Pol II in tissues where the genes are inactive (top diagrams, orange and red Pol II traces, Fig. 1A and fig. S2). These genes display synchronous patterns of activation, with clear hybridization signals detected in most nuclei of most embryos (Fig. 1A).
Distinct patterns of gene activation, synchronous and stochastic, are also seen for genes expressed in the other primary embryonic tissues, the neurogenic ectoderm and dorsal ectoderm (Fig. 1, C and D, and fig. S2). thisbe (ths, encoding FGF8) (20, 21) lacks stalled Pol II and exhibits stochastic activation within the neurogenic ectoderm (Fig. 1D), whereas Neu3 (12) contains stalled Pol II and exhibits nearly uniform induction profiles in the same region (Fig. 1C). pannier (pnr) (22) and u-shaped (ush) (23) display stochastic and synchronous patterns of induction, respectively, in the dorsal ectoderm (fig. S2).
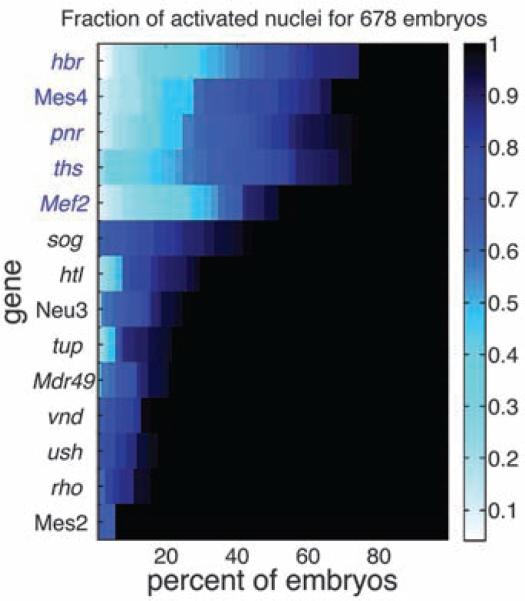
The degree of synchrony in expression for a given gene is inferred from the frequency of early cleavage cycle 14 embryos showing partial expression (summarized in Fig. 2). The population statistics include the analysis of an average of ~50 embryos for each gene. Colored blocks represent embryos in which only a fraction of nuclei in the tissue exhibit nascent transcripts. Black blocks represent embryos where all nuclei exhibit active transcription. The genes are sorted from least synchronous (high frequency of partial activation) to most synchronous. Following this analysis, we see that all of the genes lacking stalled Pol II (Mes4, hbr, pnr, ths, and Mef2) segregate from the synchronous genes, which contain stalled Pol II (sog, htl, Neu3, tup, Mdr49, vnd, ush, rho, and Mes2) [see fig. S2 for embryo stains and chromatin immunoprecipitation (ChIP)–chip results]. All of the nonstalled genes show a higher degree of asynchronous activation than any of the stalled genes. The window of time between the detection of the first nuclei with hybridization signals until the detection of the last-activated nuclei is very short for stalled genes (2 to 3 min or less). In contrast, the variation in activation times for genes lacking stalled Pol II is much larger (15 to 20 min or more), resulting in the observed stochastic expression profiles. Times were inferred from morphological staging and population statistics (see SOM).
Fig. 2.
Asynchronous expression among paused and unpaused ectodermal. Heat map summarizing synchrony results for each gene. The color indicates the fraction of activated nuclei in the region of expression. The x axis shows the proportion of similarly staged embryos with a fractional activation of at least n [0,1]. The results are sorted from top to bottom by the sum along the row, putting the most asynchronous genes at the top and the most synchronous at the bottom.
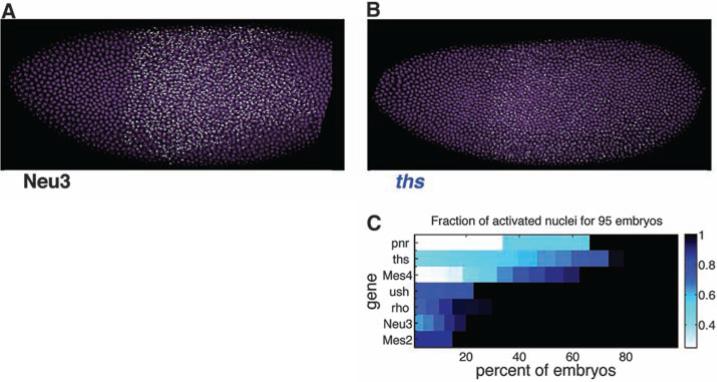
We next examined the activation of seven different genes in embryos containing an ectopic anterior-posterior Dorsal nuclear gradient (24) (Fig. 3). This gradient arises from the localized expression of an activated Toll receptor at the anterior pole of transgenic embryos using the bicoid 3′ untranslated region (UTR) (25). The resulting gradient induces ectopic patterns of gene expression, including the activation of mesodermal genes in the presumptive head. Nonetheless, the trend observed for stalled and nonstalled genes in wild-type (WT) embryos is also seen in these highly abnormal mutants.
Fig. 3.
Cell location and transcription factor gradient do not dramatically affect synchrony. (A and B) Embryos containing an anterior-posterior gradient of Dorsal activity due to toll[10b]-bcd-3′UTR mRNA being expressed in the anterior pole under control of the maternal hsp83 driver (24) were assayed for asynchronies in gene expression. The ectopic activation under control of a differently shaped dorsal gradient still recapitulates the WT observation that Fig. 2.
The stalled Mes2 gene exhibits uniform ec-topic activation in head regions, whereas the non-stalled Mes4 gene displays stochastic induction (Fig. 3C and fig. S3). Similarly, Neu3 (stalled) is uniformly activated in middle-body regions (Fig. 3A), whereas ths (nonstalled) exhibits stochastic activation profiles in the same region (Fig. 3B). The quantitative analysis of 95 different embryos suggests that all three nonstalled genes ( pnr, ths, and Mes4) display stochastic activation by the ectopic Dorsal gradient. In contrast, the four stalled genes (ush, rho, Neu3, and Mes2) all display synchronous activation patterns (Fig. 3C). These results suggest that synchronous induction is an autonomous property of stalled Dorsal target genes and does not depend on unknown factors that are independently localized across the dorsal-ventral (DV) axis.
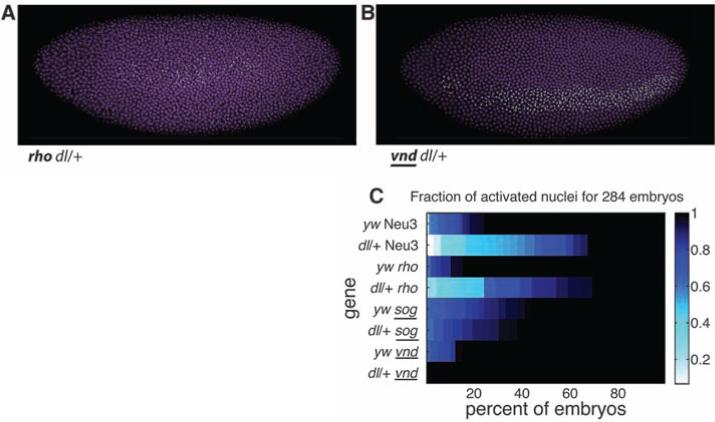
To determine how stalled genes respond to genetic perturbation, we examined the expression of four stalled genes in embryos derived from dorsal heterozgyotes (dl/+). A nuclear gradient of Dorsal establishes the DV patterning of the early Drosophila embryo. Dorsal works in concert with Twist and Snail, sequence-specific transcription factors encoded by immediate early target genes of the Dorsal gradient. Embryos derived from dl/+ females contain half the normal dose of the Dorsal nuclear gradient (26, 27). Two of the dorsal target genes that were examined, vnd (Fig. 4A) and sog (fig. S3), display normal patterns of synchronous induction (summarized in Fig. 4C), whereas the other two genes, rho (Fig. 4B) and Neu3 (fig. S3), display stochastic patterns of activation, whereby nuclei exhibiting nascent transcripts are adjacent to those lacking detectable expression. It is possible that some of the mild patterning defects previously reported in dl/+ embryos arise from these perturbations in synchrony (28).
Fig. 4.
Robustness to perturbation. (A) The neurogenic ectoderm gene rho activates in a more stochastic fashion in Dorsal heterozygotes (dl/+) than in WT embryos [panel (C) and fig. S2]. (B) The neurogenic gene vnd shows no detectable difference in the synchrony of expression in the dl/+ background. (C) Summary of quantification of asynchronous expression for lateral ectoderm genes in WT (yw) and dl/+ embryos. Underlined gene names have confirmed shadow enhancers (29) and exhibit robust synchronous activation in the heterozygote background.
Both of the genes that display normal activation in dl/+ embryos, vnd and sog, contain “shadow enhancers,” secondary enhancers for activation in the presumptive neurogenic ectoderm (29), identified by ChIP-chip assays for the DV regulatory genes Dorsal, Twist, and Snail (30). Shadow enhancers might compensate for fluctuations in Dorsal concentrations by increasing the probability of occupancy of critical Dorsal binding sites (10, 29–33). In contrast, neither of the genes that display stochastic activation in dl/+ embryos (rho and Neu3) appear to contain shadow enhancers (Fig. 4C). However, these results are preliminary, and definitive evidence that shadow enhancers provide an adaptive response to genetic perturbations will require additional study.
Previous visualization studies failed to distinguish synchronous and stochastic modes of gene activation (12–18, 20, 21, 23, 27, 30, 34–36). This finding was made possible by the use of a quantitative method that examines gene expression in many embryos rather than just a few individual embryos. Most DV patterning genes contain stalled Pol II (37), and we predict that most of these genes exhibit synchronous patterns of induction.
Pol II stalling and transcriptional synchrony may help to ensure the orderly unfolding of the complex genetic programs that control development. It is likely that any given gene, or even small sets of genes, can be activated in a stochastic fashion without causing severe patterning defects. However, the reproducible and reliable development of large populations of embryos might be incrementally augmented by the ac quisition of stalled Pol II on critical developmental control genes.
Supplementary Material
Boettiger and Levine 2009 supplement
Acknowledgments
We thank P. Ralph and S. Evans for help with constructing and analyzing the mathematical models of Pol II elongation and initiation that motivated our hypothesis about the synchrony of gene expression. A.N.B. is supported by NSF Graduate Research Fellowship Program. This study was funded by a grant from NIH (GM34431).
References and Notes
- 1.Raj A, Peskin CS, Tranchina D, Vargas DY, Tyagi S. PLoS Biol. 2006;4:e309. doi: 10.1371/journal.pbio.0040309. [DOI] [PMC free article] [PubMed] [Google Scholar]
- 2.Raj A, van Oudenaarden A. Cell. 2008;135:216. doi: 10.1016/j.cell.2008.09.050. [DOI] [PMC free article] [PubMed] [Google Scholar]
- 3.Raser JM, O'Shea EK. Science. 2004;304:1811. doi: 10.1126/science.1098641. published online 27 May 2004 (10.1126/science.1098641) [DOI] [PMC free article] [PubMed] [Google Scholar]
- 4.Raser JM, O'Shea EK. Science. 2005;309:2010. doi: 10.1126/science.1105891. [DOI] [PMC free article] [PubMed] [Google Scholar]
- 5.Hendrix DA, Hong JW, Zeitlinger J, Rokhsar DS, Levine MS. Proc. Natl. Acad. Sci. U.S.A. 2008;105:7762. doi: 10.1073/pnas.0802406105. [DOI] [PMC free article] [PubMed] [Google Scholar]
- 6.Lis JT. Nature. 2007;450:198. doi: 10.1038/nature06324. [DOI] [PubMed] [Google Scholar]
- 7.Bergmann S, et al. PLoS Biol. 2007;5:e46. doi: 10.1371/journal.pbio.0050046. [DOI] [PMC free article] [PubMed] [Google Scholar]
- 8.Coppey M, Boettiger AN, Berezhkovskii AM, Shvartsman SY. Curr. Biol. 2008;18:915. doi: 10.1016/j.cub.2008.05.034. [DOI] [PMC free article] [PubMed] [Google Scholar]
- 9.Gregor T, Bialek W, van Steveninck R. R. d. R., Tank DW, Wieschaus EF. Proc. Natl. Acad. Sci. U.S.A. 2005;102:18403. doi: 10.1073/pnas.0509483102. [DOI] [PMC free article] [PubMed] [Google Scholar]
- 10.Gregor T, Tank DW, Wieschaus EF, Bialek W. Cell. 2007;130:153. doi: 10.1016/j.cell.2007.05.025. [DOI] [PMC free article] [PubMed] [Google Scholar]
- 11.Gregor T, Wieschaus EF, McGregor AP, Bialek W, Tank DW. Cell. 2007;130:141. doi: 10.1016/j.cell.2007.05.026. [DOI] [PMC free article] [PubMed] [Google Scholar]
- 12.Stathopoulos A, Van Drenth M, Erives A, Markstein M, Levine M. Cell. 2002;111:687. doi: 10.1016/s0092-8674(02)01087-5. [DOI] [PubMed] [Google Scholar]
- 13.Maity SN, de Crombrugghe B. Trends Biochem. Sci. 1998;23:174. doi: 10.1016/s0968-0004(98)01201-8. [DOI] [PubMed] [Google Scholar]
- 14.Baylies MK, Michelson AM. Curr. Opin. Genet. Dev. 2001;11:431. doi: 10.1016/s0959-437x(00)00214-8. [DOI] [PubMed] [Google Scholar]
- 15.Michelson AM, Gisselbrecht S, Buff E, Skeath JB. Development. 1998;125:4379. doi: 10.1242/dev.125.22.4379. [DOI] [PubMed] [Google Scholar]
- 16.Zhu MY, Wilson R, Leptin M. Genetics. 2005;170:767. doi: 10.1534/genetics.104.039750. [DOI] [PMC free article] [PubMed] [Google Scholar]
- 17.Imam F, Sutherland D, Huang W, Krasnow MA. Genetics. 1999;152:307. doi: 10.1093/genetics/152.1.307. [DOI] [PMC free article] [PubMed] [Google Scholar]
- 18.Leptin M, Affolter M. Curr. Biol. 2004;14:R480. doi: 10.1016/j.cub.2004.06.016. [DOI] [PubMed] [Google Scholar]
- 19.Ricardo S, Lehmann R. Science. 2009;323:943. doi: 10.1126/science.1166239. [DOI] [PMC free article] [PubMed] [Google Scholar]
- 20.Gryzik T, Muller HA. Curr. Biol. 2004;14:659. doi: 10.1016/j.cub.2004.03.058. [DOI] [PubMed] [Google Scholar]
- 21.Stathopoulos A, Tam B, Ronshaugen M, Frasch M, Levine M. Genes Dev. 2004;18:687. doi: 10.1101/gad.1166404. [DOI] [PMC free article] [PubMed] [Google Scholar]
- 22.Ramain P, Heitzler P, Haenlin M, Simpson P. Development. 1993;119:1277. doi: 10.1242/dev.119.4.1277. [DOI] [PubMed] [Google Scholar]
- 23.Frank LH, Ruschlow C. Development. 1996;122:1343. doi: 10.1242/dev.122.5.1343. [DOI] [PubMed] [Google Scholar]
- 24.Huang AM, Rusch J, Levine M. Genes Dev. 1997;11:1963. doi: 10.1101/gad.11.15.1963. [DOI] [PMC free article] [PubMed] [Google Scholar]
- 25.Macdonald PM, Struhl G. Nature. 1988;336:595. doi: 10.1038/336595a0. [DOI] [PubMed] [Google Scholar]
- 26.Ip YT, Park RE, Kosman D, Yazdanbakhsh K, Levine M. Genes Dev. 1992;6:1518. doi: 10.1101/gad.6.8.1518. [DOI] [PubMed] [Google Scholar]
- 27.Zinzen RP, Senger K, Levine M, Papatsenko D. Curr. Biol. 2006;16:1358. doi: 10.1016/j.cub.2006.05.044. [DOI] [PubMed] [Google Scholar]
- 28.Gonzalez-Crespo S, Levine M. Genes Dev. 1993;7:1703. doi: 10.1101/gad.7.9.1703. [DOI] [PubMed] [Google Scholar]
- 29.Hong J-W, Hendrix DA, Levine MS. Science. 2008;321:1314. doi: 10.1126/science.1160631. [DOI] [PMC free article] [PubMed] [Google Scholar]
- 30.Zeitlinger J, et al. Genes Dev. 2007;21:385. doi: 10.1101/gad.1509607. [DOI] [PMC free article] [PubMed] [Google Scholar]
- 31.Berg HC, Purcell EM. Biophys. J. 1977;20:193. doi: 10.1016/S0006-3495(77)85544-6. [DOI] [PMC free article] [PubMed] [Google Scholar]
- 32.Bialek W, Setayeshgar S. Phys. Rev. Lett. 2008;100:258101. doi: 10.1103/PhysRevLett.100.258101. [DOI] [PubMed] [Google Scholar]
- 33.Tkacik G, Gregor T, Bialek W. PLoS One. 2008;3:e2774. doi: 10.1371/journal.pone.0002774. [DOI] [PMC free article] [PubMed] [Google Scholar]
- 34.Bier E, Jan LY, Jan YN. Genes Dev. 1990;4:190. doi: 10.1101/gad.4.2.190. [DOI] [PubMed] [Google Scholar]
- 35.Francois V, Solloway M, O'Neill JW, Emery J, Bier E. Genes Dev. 1994;8:2602. doi: 10.1101/gad.8.21.2602. [DOI] [PubMed] [Google Scholar]
- 36.Skeath JB, Panganiban GF, Carroll SB. Development. 1994;120:1517. doi: 10.1242/dev.120.6.1517. [DOI] [PubMed] [Google Scholar]
- 37.Zeitlinger J, et al. Nat. Genet. 2007;39:1512. doi: 10.1038/ng.2007.26. [DOI] [PMC free article] [PubMed] [Google Scholar]
Associated Data
This section collects any data citations, data availability statements, or supplementary materials included in this article.
Supplementary Materials
Boettiger and Levine 2009 supplement


