A conserved mechanism of TOR-dependent RCK-mediated mRNA degradation regulates autophagy (original) (raw)
. Author manuscript; available in PMC: 2016 Jan 1.
Published in final edited form as: Nat Cell Biol. 2015 Jun 22;17(7):930–942. doi: 10.1038/ncb3189
Abstract
Autophagy is an essential eukaryotic pathway requiring tight regulation to maintain homeostasis and preclude disease. Using yeast and mammalian cells, we report a conserved mechanism of autophagy regulation by RNA helicase RCK family members in association with the decapping enzyme Dcp2. Under nutrient-replete conditions, Dcp2 undergoes TOR-dependent phosphorylation and associates with RCK members to form a complex with autophagy-related (ATG) mRNA transcripts, leading to decapping, degradation and autophagy suppression. Simultaneous with the induction of ATG mRNA synthesis, starvation reverses the process, facilitating ATG mRNA accumulation and autophagy induction. This conserved post-transcriptional mechanism modulates fungal virulence and the mammalian inflammasome, the latter providing mechanistic insight into autoimmunity reported in a patient with a PIK3CD/p110δ gain-of-function mutation. We propose a dynamic model wherein RCK family members, in conjunction with Dcp2, function in controlling ATG mRNA stability to govern autophagy, which in turn modulates vital cellular processes affecting inflammation and microbial pathogenesis.
Keywords: autophagy, cytokine, fungi, inflammasome, TOR pathway, autoimmunity
INTRODUCTION
Autophagy is a conserved essential eukaryotic catabolic process 1. Cells undergo rapid initiation of autophagy in response to cellular stress. Induction is followed by nucleation of a sequestering compartment, the phagophore, which expands into a double-membrane autophagosome. Although autophagy is cytoprotective, excessive autophagy is deleterious, suggesting a necessity for tightly-governed regulation, exemplified by target of rapamycin (TOR)-mediated post-translational phosphorylation of autophagy-related (Atg) proteins 2 that maintains autophagy at a basal level under growing conditions. Transcription-dependent regulation of autophagy-related genes occurs in both S. cerevisiae 3 and mammalian cells 4. However, less is known about post-transcriptional regulatory mechanisms modulating mRNA steady state levels during autophagic induction and maintenance.
Recent work has shown that some TOR-dependent processes are regulated through control of mRNA stability. Although mechanisms of its regulation remain poorly understood, steps leading to deadenylation-dependent mRNA degradation in eukaryotes are well known 5. mRNA degradation begins with a reversible deadenylation step 5, followed by the irreversible removal of the 5’ cap by the decapping enzyme, Dcp2, that allows the mRNA to be degraded in a 5’-3’ direction by the Xrn1 exoribonuclease 6. Additional decapping accessory proteins include a DExD/H-box RNA helicase compromising the RCK family, known as Dhh1 in S. cerevisiae, Vad1 in the fungal pathogen Cryptococcus neoformans and DDX6 in mammals 7-9. These RCK family members function at the interface of translation and mRNA degradation by recruiting transcripts to the Dcp2 decapping complex 10. Nevertheless, how mRNA post-transcriptional regulation is linked to signal-transduction machinery and autophagy remains the subject of intense investigation.
The post-transcriptional regulation of autophagy is still not fully understood even though the core components have been identified. A recent study pointed out dynamic changes in protein-RNA interactions under conditions of nutrient limitation 11, suggesting that RNA-binding proteins (RBPs) could regulate autophagy. Also, defects in autophagy activity are associated with increased cell death during nitrogen starvation 12. Therefore, to identify regulators of autophagy among RBPs, a comprehensive library of RBP mutants was screened for a cell survival phenotype, which identified the yeast Saccharomyces cerevisae RCK member Dhh1 as a potential autophagy modulator. In addition, an RNA immunoprecipitation screen demonstrated that ATG8 mRNA bound to the decapping complex-containing the RCK yeast cryptococcal member Vad1. Further studies identified a conserved role for RCK members and binding partners in the recruitment of key transcriptionally-controlled autophagy gene mRNAs to the Dcp2 decapping complex in yeast and mammals. TOR (MTOR)-dependent phosphorylation of DCP2 was identified by targeted ion mass spectroscopy and found to play a role in the function of the decapping complex. Genetic manipulation, either by transcriptional modulation of RCK mRNA levels or by DCP2 phosphomimetic or phosphodeficient mutations recapitulated TOR-dependent effects on decapping, resulting in alterations of autophagy. These changes in autophagy were sufficient to modulate the function of fungal virulence and the mammalian inflammasome by human differentiated THP-1 macrophages. This regulatory pathway was then utilized to characterize an autoimmune phenotype in a patient with a PIK3CD/p110δ gain-of-function mutation with elevated MTOR activity 13, linking pathological increases in MTOR-dependent DCP2 phosphorylation to reduced autophagy and increased IL1B production.
RESULTS
Dhh1 and the mRNA decay pathway coordinately repress the autophagy transcriptome in S. cerevisiae
To identify potential regulators of autophagy among RBPs, a comprehensive library of RBP mutants was screened for a cell survival phenotype during nitrogen starvation. The RBP mutants displayed a range of phenotypes, and dhh1Δ cells in particular showed reduced survival compared to wild-type, noticeable after 5 days of treatment, which was further aggravated with prolonged starvation (Fig. 1a), suggesting that Dhh1 might regulate autophagy. Upon nitrogen starvation, autophagy was induced to a higher level in dhh1Δ cells compared to wild type (Fig. 1b) as measured by the Pho8Δ60 assay. This assay measures autophagy-dependent alkaline phosphatase activity of a modified vacuolar alkaline phosphatase precursor that can only be delivered to the vacuole for proteolytic activation via autophagy. Although insufficient autophagy can result in a loss of cell viability, excessive autophagy activity could cause a similar phenotype. The Pho8Δ60 data suggested that the latter may explain the decreased survival in the _dhh1_Δ strain, and that Dhh1 may be a negative regulator of autophagy. Therefore, we extended our analysis using a GFP-Atg8 processing assay. When transported into the vacuole during autophagy, GFP-tagged Atg8 is hydrolyzed to yield free GFP, reflecting the level of autophagy 14. In dhh1Δ cells, autophagy was induced more rapidly and to a higher extent, as indicated by the level of free GFP compared to wild type (Fig. 1c), further suggesting that Dhh1 acts as a repressor of autophagy.
Figure 1. The RCK Member Dhh1 Is a Post-transcriptional Repressor of Autophagy in Yeast.

(A) The dhh1Δ mutation reduces cell survival. Wild-type (WT) and dhh1Δ cells (BY4741) were grown in SMD, starved and dilutions grown on YPD plates for 2 days. Scale, 0.5 cm.
(B) Dhh1 negatively regulates autophagy. WT (WLY176) and dhh1Δ (YAB269) cells were grown in YPD (+N) then starved (−N). Pho8Δ60 activity was normalized to WT cells (set to 100%). Error bars: standard deviation (SD). n=5 independent experiments for (+N); n=3 independent experiments for (−N). Student's t-test, *** p < 0.001.
(C) Autophagy is increased in dhh1Δ cells. WT (WLY176) and dhh1Δ cells expressing GFP-Atg8 were grown in rich medium, then starved. Free GFP intensity was normalized to the loading control. Free GFP was then normalized to the amount in WT cells after 3 h of starvation (set to 1). Average values ± SD of n=3 independent experiments.
(D) Dhh1 represses expression of Atg8. WT (WLY176) and dhh1Δ cells were grown in YPD, then starved.
(E) Dhh1 represses ATG gene expression in nutrient-replete conditions. WT (WLY176) and dhh1Δ cells were grown in YPD. Total RNA was extracted and the mRNA levels were quantified by qRT-PCR. The mRNA level of individual ATG genes was normalized to the corresponding gene in WT cells (set to 1). Error bars: SD. n=5 independent experiments for ATG3, 19, 20, 22, 24; n=6 independent experiments for ATG7 and 8.
(F) Dcp2 negatively regulates autophagy. WT (BY4742) and dcp2-7Δ cells expressing GFP-Atg8 were grown in rich medium until early log-phase. Cells were shifted to 38.5°C for 1 h, then starved. Quantification of free GFP was carried out as in (C). Average values ± SD, n=3 independent experiments.
(G) Dcp2 represses the expression of Atg8. WT and dcp2-7Δ cells were grown as in (F).
(H) Dcp2 represses the expression of ATG genes in nutrient-replete conditions. WT (BY4742) and dcp2-7Δ cells were grown in rich medium until early log phase. Cells were shifted to 38.5°C for 1 h. Total RNA was extracted and analyzed as in (E). Error bars indicate SD, n=3 independent experiments. Student's t-test, * p < 0.05, *** p < 0.001.
We also noticed a higher level of the GFP-Atg8 fusion protein (Fig. 1c) as well as endogenous Atg8 (Fig. 1d) in dhh1Δ cells compared to wild type (Fig. 1c). In nutrient-rich conditions Atg8, as well as its lipidated form, Atg8–PE, is expressed at a very low level in wild-type cells, but the level increases substantially when autophagy is induced. Atg8 is a key autophagy-related protein involved in formation of the phagophore, and previous studies showed that an elevated Atg8 correlates with larger autophagosomes and increased autophagic flux 15. Dhh1 is a DExD/H-box helicase that has a role in the activity of the decapping machinery. Finding that Dhh1 affects the abundance of Atg8 led us to postulate that Dhh1 represses autophagy by regulating mRNA stability of one or more ATG genes. To test this idea, RT-qPCR was used to examine the expression of known S. cerevisiae ATG genes in dhh1Δ cells compared to wild type. In nutrient-replete conditions, the DHH1 deletion caused an accumulation of ATG3, ATG7, ATG8, ATG19, ATG20, ATG22 and SNX4/ATG24 transcripts (Fig. 1e, Supplementary Fig. 1a). Conversely, there was no significant difference in mRNA levels of ATG genes between the dhh1Δ and wild-type cells after starvation (Supplementary Fig. 1b). According to the literature, Dhh1 is a highly abundant protein in S. cerevisiae and is present in large excess over its mRNA substrates 7. Consistent with this observation, mild overexpression of the protein resulted in a modest decrease in autophagy (Supplementary Fig. 1c, d and e). These results suggested a model in which Dhh1 blocks autophagy in nutrient-rich conditions by, at least partly, repressing the expression of a set of ATG genes.
To further confirm the involvement of mRNA decapping in regulating autophagy, we assessed the role of the decapping enzyme Dcp2, using a dcp2-7Δ temperature-sensitive mutant. At the non-permissive temperature, autophagy activity was increased in the dcp2-7Δ cells compared to wild-type cells as measured by both the GFP-Atg8 processing and Pho8Δ60 assays (Fig. 1f, Supplementary Fig. 1f). As in the dhh1Δ cells, enhancement of autophagy in the dcp2-7Δ cells was associated with an accumulation of autophagy-related proteins (Fig. 1g, Supplementary Fig. 1g) and mRNA (Fig. 1h), compared to wild-type cells in nutrient-rich conditions. After nitrogen starvation, the difference in the level of ATG transcripts between the dcp2-7Δ and the wild-type cells was either abolished or strongly reduced for many of the genes (Supplementary Fig. 1h). The level of mRNA induction as well as the number of targets among the ATG genes was much higher in the dcp2-7Δ cells compared to dhh1Δ, a result consistent with the essential function of Dcp2 as a core component of the decapping complex in contrast with a regulatory role of Dhh1. Together, these data support the idea that Dhh1 and the decapping machinery repress autophagy in nutrient-replete conditions by promoting the degradation of ATG transcripts.
Vad1/Dhh1 repression of autophagy regulates the pathogenesis of the yeast C. neoformans
Autophagy is required for the virulence of pathogenic fungi 16. Thus, we tested the significance of decapping and autophagy in the fungal pathogen Cryptococcus neoformans, a leading cause of infectious death globally 17. Deletion of VAD1, the DHH1 homolog in C. neoformans, recapitulated increases in autophagy activity observed in S. cerevisae based on an accumulation of autophagic bodies, the single-membrane vesicle that is released into the vacuole lumen after fusion with the double-membrane autophagosome, in nutrient-replete conditions as well as after starvation of glucose and amino acids or rapamycin treatment (Fig. 2a,b). An increase in autophagic bodies can result from an increase in autophagic flux, or a block in a late step of autophagy, such as degradation within the vacuole 18. To distinguish these possibilities, we carried out an analysis of long-lived protein degradation; short-lived proteins are targeted primarily by the ubiquitin-proteasome system, whereas long-lived proteins are mostly degraded by autophagy. The vad1Δ cells showed an increase in protein turnover in nutrient-rich conditions, similar to that observed after autophagy induction by rapamycin treatment in wild-type cells (Fig. 2c), thus confirming an increase in autophagy flux in the vad1Δ mutant. This was accompanied by increased accumulation of ATG8 mRNA (Supplementary Fig. 2a) and protein, in particular its lipidated form, in the mutant strain vs. wild type during mid-log growth (Fig. 2d). VAD1 deletion also led to an accumulation of many of the ATG gene transcripts in nutrient-rich conditions, similar to that induced after starvation (Supplementary Fig. 2a). These data show that, as in S. cerevisae, Vad1 acts as a repressor of autophagy in C. neoformans.
Figure 2. A Vad1 RCK/p54 Homolog Plays a Role in Repression of Autophagy and Virulence in C. neoformans.
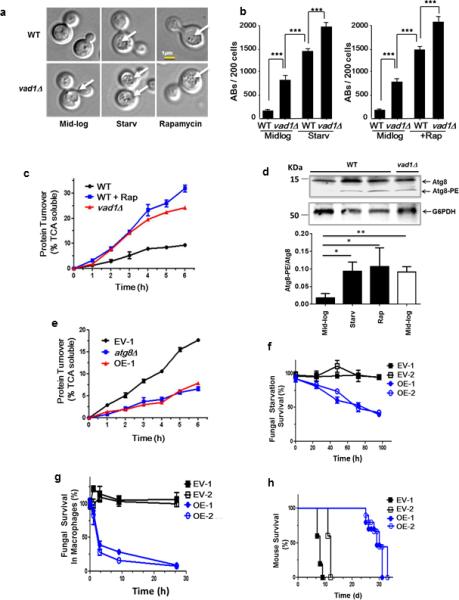
(a, b) Indicated strains were observed in mid-log phase, starvation in phosphate-buffered saline (PBS), pH 7.4 (starv) or in the presence of rapamycin by differential interference contrast microscopy (DIC) for the presence of autophagic bodies (AB, white arrows) and quantified in 200 cells per condition by DIC in n=3 independent experiments. Chi square analysis: *** p < 0.001.
(c) Autophagic flux determined by 35S pulse-labeling of cells followed by precipitation in 10% tricholoroacetic acid (TCA) at indicated times followed by measurement of TCA-soluble peptides by liquid scintillography.. Autophagic flux was determined for the indicated strains in mid-log phase (wild type [WT], Δ_vad1_) or in mid-log cells in the presence of rapamycin (+Rap) for indicated times. Time points n=3 +/− SEM.
(d) Lysate of mid-log phase cells either treated (+) or untreated (−) with rapamycin or after starvation in PBS, pH 7.4 (starv) were subjected to urea electrophoresis and detected on western blot using an anti-Atg8 rabbit antibody. Lower arrow indicates lipidated Atg8 bands. Lower panel represents results of n=3 independent experiments +/− SD. * p < 0.05; ** p < 0.01
(e) Autophagic flux in starved cells was determined as in (a). C. neoformans expressing empty vector strain #1 (EV-1) and VAD1 overexpressing vector, strain #1 (OE-1). Time points n=3 +/− SEM.
(f) Fungal cell survival under starvation conditions. Strains were starved by incubation in PBS, pH 7.4, for the indicated times, followed by live cell determination using an assay of colony-forming units (CFU). C. neoformans expressing empty vector strain #1 and #2 (EV-1 and 2) and VAD1 overexpressing vector (under the ACT1 promoter), strain #1 and 2 (OE-1 and 2). Time points n=3 +/− SE.
(g) Fungal survival in macrophages. Indicated strains were opsonized with 40% mouse serum, phagocytosed using a J774.16 cell line induced by IFNG/IFN-γ, and fungal viability measured by CFU. Time points n=3 +/− SEM.
(h) Mouse mortality after cryptococcal infection. Indicated strains (1 × 10⁶ CFU) were inoculated intravenously into 10 female Swiss-Albino mice for each strain and followed until moribund. n=10 mice per group.
Conversely, higher gene dosing of VAD1 in an overexpressing strain led to a reduction of ATG8 mRNA (Supplementary Fig. 2b), autophagic bodies (Supplementary Fig. 2c), and autophagic flux, the latter to a level similar to that of an autophagy-incompetent atg8Δ mutant (Fig. 2e). VAD1 overexpression also resulted in defects in starvation tolerance (Fig. 2f) as well as a reduction in survival within macrophages (Fig. 2g), a key determinant of virulence for this facultative intracellular pathogen 19. Note that in this situation, we propose that the decrease in C. neoformans viability is due to the decrease in fungal autophagy resulting from Vad1 overexpression, in contrast to the analysis in S. cerevisiae where we examined the null strain (Fig. 1a). However, starvation studies in C. neoformans were conducted using glucose and nitrogen starvation, to better simulate conditions encountered for this pathogen in the infected brain 16. These gene dosing effects of VAD1 were significant to pathogenesis in that independent _VAD1_-overexpressor strains demonstrated attenuated virulence in mice (Fig. 2h). The hypovirulent phenotype was similar to that of an _ATG8_-RNAi-suppressed strain described previously 16. Together, these data demonstrate a significant role in pathogenesis for _VAD1_-mediated suppression of autophagy.
Vad1 controls the degradation of ATG8 transcripts in nutrient-rich conditions
To gain insight into the molecular mechanism by which Vad1/Dhh1 represses autophagy, we examined its regulation of Atg8 in more detail. After inhibition of mRNA synthesis using the mRNA synthetic inhibitor 1,10-phenanthroline, northern blot and quantitative RT-PCR analysis showed that during nutrient-replete conditions, wild-type cryptococcal cells exhibited time-dependent degradation of ATG8 mRNA (Fig. 3a left, upper panel, Supplementary Fig. 2d) with a half-life of 18 +/− 4 min, whereas starvation stabilized the ATG8 transcripts (Fig. 3a, middle left panel). Similar to starvation conditions, deletion of VAD1 resulted in stable mRNA levels of ATG8 for over 60 min (Fig. 3a, right panels; Supplementary Fig. 2d).
Figure 3. Vad1 Plays a Role in Decapping and Degradation of ATG8 in C. neoformans.
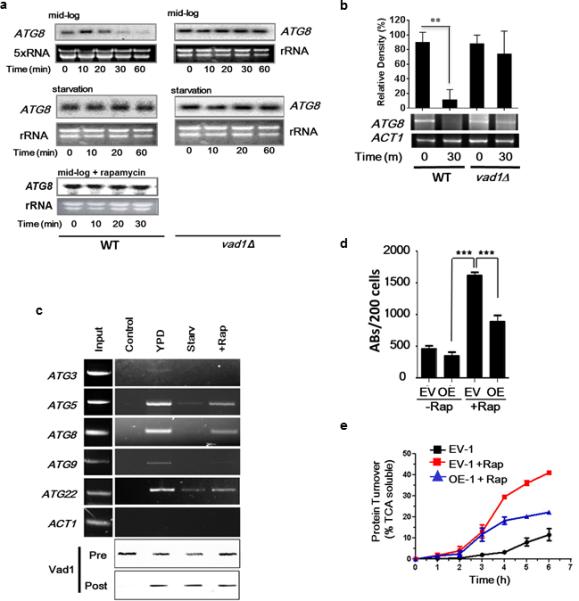
(a) Degradation assays. Indicated cells were grown to mid-log phase in 2% glucose, 2% bactopeptone, 1% yeast extract (YPD), then incubated under starvation conditions (PBS, pH, 7.4) for 1 h or treated with rapamycin followed by transcription inhibition with 1,10-phenanthroline as described in Methods for the indicated times. Northern blots were used to monitor ATG8 transcripts. The designate, ‘5×RNA’ was used to show that 5× the amount of RNA was required to be loaded on the gel to identify the repressed ATG8 transcript under mid-log conditions.
(b) The presence of capped ATG8 transcripts was assayed over 30 min using the indicated strains by PCR amplification of a cDNA product obtained after sequential ligation of a 5’ RNA adapter following treatment with tobacco acid pyrophosphatase as described in Supplemental Methods. Error bars indicate SEM of n=3 independent experiments. Student's t test, ** p<0.01.
(c) Lysate from cells incubated under the indicated conditions, expressing a _c-myc_-tagged Vad1 protein, or untagged Vad1 (control) was immunoprecipitated followed by RT-PCR using primers for the indicated gene transcripts. To normalize RT-PCR reactions, a cross-reactive RCK antibody was used to quantify Vad1 in the lysate prior to (pre) and in the pellet after (post) immunoprecipitation.
(d) Autophagic bodies (ABs) assayed as in Fig. 2A. Results from n=3 independent experiments, 200 cells each, Student's t-test, *** p < 0.001.
(e) Autophagic flux in mid-log cells in the presence or absence of rapamycin was determined by [35S] pulse-labeling of cells followed by precipitation in 10% TCA at the indicated times followed by measurement of TCA soluble peptides by liquid scintillography.. Time points n=3 +/− SEM.
Decapping of mRNA represents a critical first irreversible step in mRNA turnover mediated by members of the DEAD-box family of RNA helicase proteins, which includes Vad1. We used a PCR-based method 20 and confirmed Vad1-dependent decapping of ATG8 mRNA transcripts (Fig. 3b). Together these results support a model in which, during mid-log phase, Vad1 and the decapping machinery degrade ATG8 mRNA, thus keeping autophagy activity at a low level. During nutrient limitation Vad1-mediated mRNA degradation is inhibited, thereby allowing for increased expression of ATG genes and induction of autophagy. Confirming this finding and extending it to other transcriptionally-regulated autophagy genes, RNA immunoprecipitation of a _c-myc_-tagged Vad1 fusion protein demonstrated binding of autophagy-related transcripts, including _ATG_3, ATG5, ATG8, ATG9 and ATG22 under mid-log nutrient-rich conditions (Fig. 3c), whereas under starvation conditions, Vad1 protein-transcript complexes were less prominent. This finding suggests a role for transcript binding to the Vad1 complex under nutrient-replete conditions and dissociation under starvation conditions. Since RCK family members form complexes with decapping enzymes such as Dcp2 21, dissociation of target mRNA from this complex would be expected to result in a loss of decapping and attenuated degradation, as seen in the _vad1_Δ mutant. Further studies demonstrated a role for the 3’UTR of ATG8 in this process as expression levels of a GFP-ATG8 fusion gene substituted with an unrelated 3’UTR resulted in GFP-Atg8 protein accumulation (Supplementary Fig. 2e). ATG8 3’UTR replacement alone resulted in a diffuse cytoplasmic accumulation of GFP-Atg8, whereas, under the same conditions, VAD1 deletion resulted in both protein accumulation and autophagic body formation, suggesting regulation of multiple steps in the autophagic process by Vad1, in agreement with the observation that several ATG genes are regulated in a Vad1-dependent manner. Together, these data are consistent with Vad1 playing an important role in coordinate repression of autophagy-related mRNA transcripts under nutrient-replete conditions.
Vad1-mediated repression of autophagy is regulated by TOR-dependent phosphorylation of the decapping enzyme Dcp2
To identify a pathway(s) inhibiting Vad1-mediated autophagy repression upon starvation, we evaluated the relationship between TOR and Vad1. We found that inactivation of TOR with rapamycin resulted in a similar reduction of transcript binding by Vad1 as seen with starvation, although to a lesser extent (Fig. 3c). In addition, degradation of ATG8 transcripts was inhibited after rapamycin treatment (Fig. 3a, left bottom panel), similar to that exhibited during starvation. Furthermore, overexpression of VAD1 resulted in inhibition of TOR-dependent induction of autophagic bodies and autophagic flux (Fig. 3d, e). These data thus suggest an epistatic relationship between induction of autophagy following TOR inactivation and Vad1-dependent transcript degradation.
Since Dcp2 in S. cerevisiae was found to modulate autophagy (Fig. 1), we investigated whether this function was conserved in C. neoformans and if Dcp2 was a phosphorylation target of TOR. Work by us (data not shown) and others 22 failed to show TOR-dependent phosphorylation of Vad1. However, previous whole proteome work in S. cerevisiae identified TOR-dependent phosphorylation of Dcp2, which had not reached false discovery rate (FDR) statistical significance because of the large number of comparisons inherent in such studies 22. Thus, to assess the role of this phosphorylation in autophagy, Dcp2-3XFLAG wild-type, phosphomimetic (S -> D) and phosphodeficient (S -> A) double mutants were constructed in homologous sites at Ser614 and Ser617 and expressed in C. neoformans. In these studies, Dcp2 phosphoserine levels decreased after starvation as well as in the phosphodeficient mutant (Fig. 4A). Residual phosphoserine in the phosphodeficient mutant suggests the presence of additional starvation-related phosphorylation sites in Dcp2. A functional role for Dcp2 phosphorylation was demonstrated by measuring ATG8 transcript degradation by qPCR. As shown in Fig. 4b, expression of the double-phosphodeficient Dcp2 resulted in competition with endogenous Dcp2 and retardation of degradation in nutrient-rich conditions, but there was essentially no effect by the phosphomimetic mutant since endogenous Dcp2 is phosphorylated under these conditions as shown in Fig. 4a. However, expression of the phosphomimetic Dcp2 under starvation conditions or following rapamycin treatment (Fig. 4b middle and right panels) accelerated ATG8 degradation as it competed with endogenous dephophorylated Dcp2; in this case there was little effect of the phosphodeficient Dcp2 since the endogenous protein is also dephosphorylated under these conditions. This was associated with analogous effects on decapping (Supplementary Fig. 3b). Residual rates of degradation and decapping persisted in YPD after expression of the phosphodeficient Dcp2, likely due to incomplete competition with endogenous Dcp2.
Figure 4. TOR-dependent Phosphorylation of Dcp2 Modulates Recruitment of ATG8 Transcripts to the Decapping Complex and Autophagic Body Formation in C. neoformans.
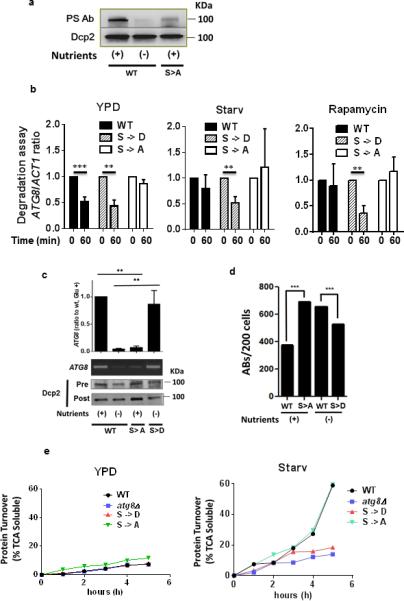
(a) C. neoformans cells expressing a WT 3xFLAG-Dcp2 fusion protein or an equivalent fusion protein containing S->A mutations at position 614 and 617 were grown in nutrient-rich medium (WT, S->A) or the strain expressing WT Dcp2 was subjected to starvation in PBS, pH 7.4 (−). Cells were harvested and the Dcp2 fusion protein immunoprecipitated and assayed using a phosphoserine or 3xFLAG antibody, as loading control, respectively.
(b) Degradation assay: C. neoformans cells expressing either WT Dcp2 or an equivalent protein containing either S->D mutations or S->A mutations at positions 614 and 617 were assayed for ATG8 and ACT1 transcripts by qPCR at the indicated times after 1,10-phenanthroline addition in the indicated conditions as in Fig. 3A. Results of n=3 independent experiments +/− SD, Student's t-test, ** p < 0.01; *** p < 0.001.
(c) Lysates from a Vad1-c-myc-expressing strain were treated as in Fig. 3D to assess ATG8 target transcript binding to Vad1. Cells contained plasmid expressing either WT 3xFLAG-Dcp2 or Dcp2 fusions containing S ->A phosphodeficient or S->D phosphomimetic mutations at positions 614 and 617. Results from n=3 independent experiments +/− SD. Student's t-test, ** p < 0.01.
(d) Yeast cells expressing the indicated Dcp2 as in Fig. 4C were assessed for autophagic body formation by DIC microscopy and quantified in n=200 cells. Chi square: ***, p< 0.001
(e) Autophagic flux in YPD or in starved cells was determined by [35S] pulse-labeling of cells followed by precipitation in 10% TCA at the indicated times followed by measurement of TCA soluble peptides by liquid scintillography. Data represents one of 2 experiments.
Because ATG transcript binding to the decapping complex was dependent on TOR activity (Fig. 3c), we examined the effect of TOR Dcp2 phosphorylation on ATG8 transcript binding under conditions which demonstrated alterations in mRNA-decapping activity (Fig. 4b and Supplementary Fig. 3b). As observed previously, in nutrient-replete conditions (nutrient +), wild-type cells displayed binding of ATG8 mRNA, whereas binding was lost upon starvation (Fig. 4c). Cells expressing the Dcp2 phosphodeficient mutation showed a reduction of Vad1-dependent binding of ATG8 transcript in mid-log cells. Conversely, cells expressing the phosphomimetic Dcp2 maintained binding of ATG8 mRNA even under starvation conditions. These effects correlated with autophagy activity based on changes in autophagic body accumulation (Fig. 4d) and autophagy flux (Fig. 4e). Flux was not as elevated in the phosphomimetic mutant in YPD compared to elevations due to rapamycin or after starvation, most likely due to incomplete competition of the phosphomimetic mutant with endogenous Dcp2. Mutation of either the S614 or the S617 site produced detectable changes in ATG8 degradation (Supplementary Fig. 3c) and decapping (Supplementary Fig. 3d) as well as ATG5 decapping (Supplementary Fig. 4a and b), although the effects were predominant after mutation of the S617 site. These data suggest that TOR-dependent phosphorylation of Dcp2 under nutrient-rich conditions is associated with increased recruitment of mRNA transcripts by the Dcp2-Vad1 decapping complex, resulting in mRNA degradation and autophagy inhibition. Upon starvation, TOR inhibition results in dephosphorylation of Dcp2, leading to a release of ATG mRNA from Vad1 and subsequent translation of ATG transcripts.
In addition to a role in mRNA decapping, in vitro studies have suggested that RCK homologs such as Dhh1 and Vad1 may undergo translational repression whereby mRNAs that have exited translation may accumulate within discrete cytoplasmic foci, referred to as processing (P)-bodies 23, 24. Thus, to further assess for a role for translational suppression in autophagy, we monitored co-localization of ATG5 and ATG8 transcripts with P-bodies to estimate translational suppression during growth and starvation. As shown in Supplementary Fig. 5a, ATG8 and ATG5 transcripts were repressed under mid-log growth conditions and showed accumulation during starvation conditions. However, less than 5% of visible transcripts co-localized with P-bodies under either condition, suggesting very minor levels of translational suppression for these key autophagy transcripts. To determine the translational status of these transcripts, polysome analysis on sucrose gradients was performed. Consistent with earlier work in S. cerevisiae, starvation led to a reduction in polysomes in wild-type cells when overall synthetic needs are reduced 25. However, unlike growth-induced transcripts that are transported from polysomes during mid-log growth to untranslated mRNP fractions upon starvation 23, the autophagic ATG5 and ATG8 transcripts were predominantly localized to ribosomes and polysomes, consistent with a preponderance of active translation initiation and extension and consistent with their absence within P-bodies, demonstrated in Supplementary Fig. 5a.
Vad1/Dhh1-mediated repression of autophagy is conserved in mammalian cells
To extend the relationship between Vad1/Dhh1 and autophagy, we assessed the role of the mammalian homolog DDX6 in key autophagic processes. Two independent sets of mouse C57/BL6 embryonic stem (ES) cells were assessed that contained heterozygote gene trap insertions within intron 2 (DDX6+/− #1) and intron 1 (DDX6+/− #2) (Supplementary Fig. 6a) 26. The insertion in DDX6+/− #1 resulted in degradation and a 50% reduction in DDX6 steady state transcript levels (Fig. 5a). DDX6 transcript level was also decreased in DDX6+/− #2 (18% reduction; Fig. 5a) but was found on RT-PCR followed by sequencing to contain a fragment of the gene trap construct (data not shown). As a measure of residual DDX6 activity in the ES cells, decapping activity was assessed by PCR using specific DDX6 primers, which demonstrated a 50% reduction in decapping in DDX6+/− #1 and an almost complete absence in DDX6+/− #2 (Supplementary Fig. 6b) accompanied by reductions in LC3 (the mammalian ATG8 homolog) mRNA degradation relative to the wild type (Supplementary Fig. 6c). The greater reductions observed with DDX6+/− #2 is likely due to dominant negative interactions of the native protein expressed from the wild-type gene copy and the aberrantly spliced copy of DDX6 that included the gene trap fragment. Defective decapping activity in the two DDX6 ES cell lines were associated with increased steady state levels of LC3 transcripts (Fig. 5b), formation of LC3-containing autophagosomes (Fig. 5c,d), increased LC3-II formation relative to both LC3-I and actin (Fig. 5e), and reduced levels of SQSTM1/p62 (Fig. 5e), an autophagy receptor whose degradation is a marker of autophagic flux in mammalian cells 18. These data indicate that, analogous to its function in yeast, DDX6 suppresses autophagy in mammalian cells.
Figure 5. Mammalian DDX6 Is a Suppressor of Autophagy in Mouse Primary Embryonic Stem Cells and Human HeLa Cells.
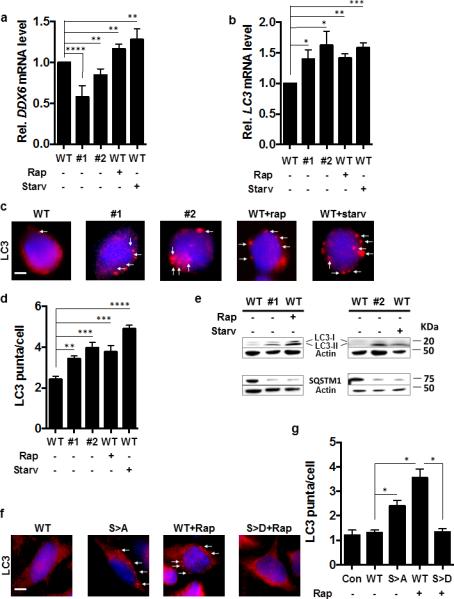
(a, b) RCK and LC3 transcript levels of the indicated C57/BL6 mouse embryonic stem (ES) cell strains in nutrient-rich media or after treatment with rapamycin (Rap +) or subjected to starvation (Starv +). N=3 independent experiments +/− SD. Student's t-test, * p < 0.05, ** p < 0.01, *** p < 0.001.
(c) LC3 puncta formation in ES cells visualized by fluorescence microscopy using an anti-LC3 antibody (red fluorescence, white arrows) of the indicated strains under nutrient-rich conditions or after addition of rapamycin (Rap +) or incubation under starvation conditions (Starv +) with 4',6-diamidino-2-phenylindole used for nuclear localization (blue fluorescence). Scale bar = 2 μm
(d) Quantification of (c). Results of n=3 independent experiments, 100 cells per experiment +/− SD. Student's t-test, ** p < 0.01, *** p < 0.001.
(e) Indicated ES strains incubated under nutrient-rich conditions assayed for LC3-I/-II and SQSTM1 by western blot.
(f) LC3 puncta in HeLa cells assayed by fluorescence microscopy (red fluorescence, white arrows) in the indicated strains in nutrient-rich conditions or after addition of rapamycin (Rap +) with 4',6-diamidino-2-phenylindole used for nuclear localization (blue fluorescence). Scale bar = 2 μm
(g) Quantification of LC3 puncta in HeLa cells 100 cells per experiment from (f). n=3 independent experiment +/− SD. Student's t-test; *, p< 0.05; **, p< 0.005, ***, p< 0.001
In contrast, overexpression of DDX6 in HeLa cells significantly suppressed rapamycin-induced LC3 mRNA transcription, LC3 lipidation and autophagic flux (Fig. 6a,d,e,h). As in the ES cells, DDX6 suppression resulted in accumulation of LC3 transcripts, inhibition of LC3 decapping, and increased LC3-labeled autophagosomes (Fig. 6b, c, f, g). DDX6 suppression also increased formation of LC3-II relative to actin but we were not able to induce SQSTM1 degradation after DDX6 suppression (data not shown), which may be due to species-related differences in autophagy induction or the transformed nature of the HeLa cell line.
Figure 6. DDX6 is a Suppressor of Autophagy in HeLa cells.
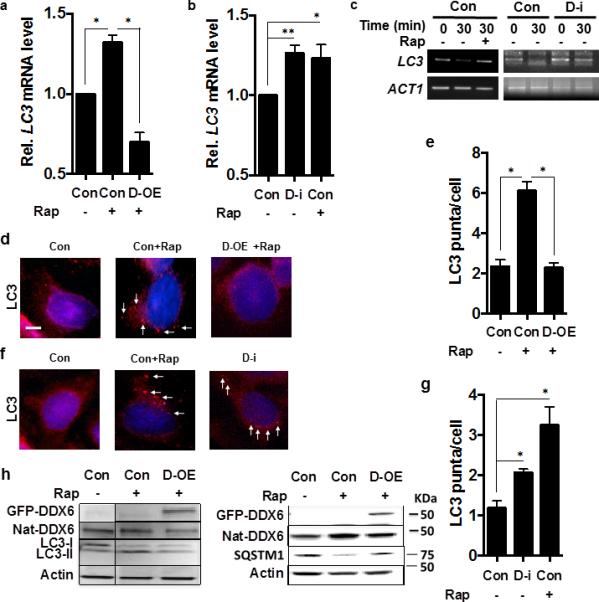
(a-b) LC3 transcript levels in HeLa cells in nutrient-rich media, transformed with empty vector (con) or empty vector + rapamycin (Con+Rap) or with a plasmid expressing human DDX6 in the presence of rapamcyin (D-OE + Rap) or treated with non-targeted siRNA (Con), or _DDX6_-directed siRNA (D-i), or non-targeted siRNA in the presence of rapamycin (Con+Rap). N=3 independent experiments +/− SD, Student t-tes; * p <0.05, ** p <0.01.
(c) The presence of capped LC3 transcripts was assayed in HeLa cells subjected to _DDX6_-directed siRNA (DDX6-i) or non-targeted siRNA (Con) under the indicated conditions at the indicated times after transcriptional suppression by the specific PCR method detailed in Methods.
(d-e) HeLa cells subjected to conditions in Fig. 3a and examined by fluorescence microscopy for LC3 puncta formation using an LC3-II antibody (red fluorescence, white arrows; 4',6-diamidino-2-phenylindole used for nuclear localization (blue fluorescence) and quantified in n=3 independent experiments of 100 cells each +/− SD. Scale bar = 2 μm. Student's t-test, * p < 0.05.
(f-g) HeLa cells subjected to conditions in Fig. 3b, and examined by fluorescence microscopy for LC3 puncta formation using anLC3-II antibody (red fluorescence, white arrows; 4',6-diamidino-2-phenylindole used for nuclear localization (blue fluorescence) and quantified in n=3 independent experiments of 100 cells each +/− SD; Student's t-test; * p < 0.05.
(h) HeLa cells in conditions equivalent to Fig. 3a were assayed for the indicated proteins including cells containing plasmids expressing GFP-DDX6 and native DDX6 (Nat-DDX6) by western blot according to Methods.
In addition, we showed that the regulation of the mammalian pathway relies on the phosphorylation of the DCP2 protein by MTOR. Since the smaller mammalian DCP2 protein does not contain a C terminus homologous to the yeast phosphorylation site, high-density mass spectrometry (MS/MS; 97% coverage) was used to identify Ser249 as a phosphorylated site under nutrient-rich conditions (Supplementary Fig. 7a) that was not present after rapamcyin treatment. Targeted ion mass spectroscopy was used to quantify a 10-fold reduction in phosphorylation at Ser249 after rapamycin treatment (Supplementary Fig. 7b). Although not homologoous to yeast, the regions surrounding Ser249 are highly conserved between human, mouse and rat (data not shown). DCP2 also appeared to be a direct target of MTOR phosphorylation as evidenced by in vitro phosphorylation data using a pSer249 antigen-purified antibody (Supplementary Fig. 7c-e). Consensus sites are not highly conserved in MTOR targets 27, making assignment based on sequence less reliable. Again, similar to the result in yeast and fungus, expression of a DCP2S249A phosphodeficient mutant resulted in accumulation of autophagosomes under normal growth conditions whereas the S249D phosphomimetic resulted in reduced autophagosome formation in HeLa cells under autophagy-inducing conditions (Fig. 5f,g). These data thus strongly suggest that DCP2 is a target of MTOR.
DCP2-dependent decapping modulates autophagy-dependent innate immune responses
Autophagy plays several roles in immunity 28, 29, including modulation of the inflammatory response. For example, initial induction of autophagy occurs following stimuli eliciting inflammasome activation, resulting in activation of CASP1/caspase-1 and secretion of the proinflammatory cytokines IL1B and IL18, but maturation of the nascent autophagosome tempers the inflammatory response by engulfing and eventually destroying the inflammasome 30. We thus examined the role of mRNA decapping in the autophagic regulation of IL1B in differentiated THP-1 macrophages following lipopolysaccharide (LPS) stimulation. LPS treatment led to inhibition of LC3 decapping (Fig. 7a), resulting in reduced LC3 transcript degradation (Fig. 7b) and increased steady state levels of LC3 (data not shown). In addition, compared to wild-type DCP2, the S249D phosphomimetic mutant displayed lower levels of LC3 transcripts and protein, whereas the S249A mutant showed the opposite result (Fig. 7c, d). Furthermore, these changes in LC3 transcript and protein correlated inversely with levels of IL1B, with higher levels of the cytokine seen when autophagy was inhibited (Fig. 7e).
Figure 7. The DDX6 Binding Partner DCP2 Regulates LC3 and IL1B Levels During Inflammasome Stimulation in Macrophages and in a Patient with a PIK3CD/p110δ Gain-of-Function Mutation.
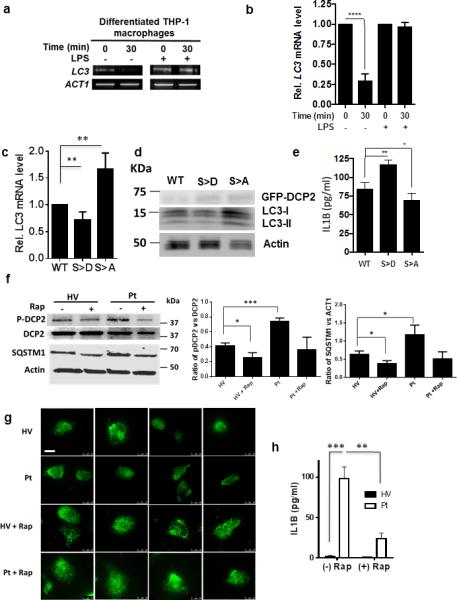
(a, b) The presence of capped LC3 transcripts was assayed in THP-1-differentiated macrophages cells by PCR amplification.
(c, d, e) THP-1-differentiated macrophages were transfected with either a plasmid containing DCP2 WT or DCP2 S249A, or DCP2 S249D, treated with LPS, and then analyzed for LC3-I/-II levels by qPCR and western blotting as well as IL1B secretion by ELISA. Statistical analysis was determined from n=3 (b, e) or n=6 (c) independent experiments +/− SD.
(f, g, h) PBMCs from patient with a PIK3CD/p110δ gain-of-function mutation (Pt) or an age-matched healthy volunteer (HV) with (+) or without (−) treatment with 200 nM rapamycin was assayed for phosphorylated DCP2 (P-DCP2) using an anti-pS249-DCP2 (F, top panel), SQSTM1 (F, bottom panel), LC3-containing autophagic vacuoles (g, white arrows) or IL1B by ELISA (H). Results of b, c, e, f (middle and right panel) and H the result of n=3 independent experiments +/− SD. Student t-test: 1 p = 0.05; *, p< 0.01; ***, p< 0.001, ****, p< 0.0001. Scale bar = 10 μm
To establish the significance of this regulatory pathway connecting MTOR to IL1B in human disease, we tested whether phospho-DCP2 levels were increased in PBMCs of a patient from a recently described cohort with gain-of-function mutations in PIK3CD encoding the PI3K delta subunit (p100δ) that conveys MTOR overactivity leading to lymphoproliferation and autoimmune cytopenias 13. Using an immunopurified p249-DCP2 antibody, an age-matched healthy volunteer demonstrated steady state P-DCP2 levels in PBMCs that were reduced after treatment with rapamycin. Interestingly, P-DCP2 levels were elevated in a patient with the PIK3CD/p110δ mutation (Fig. 7f) with resultant reductions in autophagic vacuoles (Fig. 7g) and autophagic flux, the latter demonstrated by accumulation of SQSTM1 (Fig. 7f). This alteration in autophagic flux was accompanied by high levels of IL1B in the patient, reduced after ex vivo treatment with rapamycin (Fig. 7h).
In sum, these results uncover the role of DDX6/Vad1/Dhh1 and the mRNA decay machinery in the repression of autophagy and strongly support a conserved function of this pathway in eukaryotic cells, playing a role in cell survival, infectivity and the immune response, applicable to human disease.
DISCUSSION
We propose a conserved pathway where a DExD/H-box RNA helicase in the RCK family, in association with the decapping enzyme Dcp2, negatively regulates autophagy through modulation of ATG mRNA stability in a TOR-dependent manner (Fig. 8). In our model we predict that during nutrient replete-conditions RCK family members such as Dhh1, Vad1 and DDX6 recruit ATG mRNA to the Dcp2 decapping complex, leading to mRNA decapping followed by degradation and autophagy suppression. This is consistent with RCK members acting via an mRNA chaperone activity, rather than by induction of Dcp2 enzymatic activity. Along these lines, previous in vitro studies demonstrated a physical association of the RCK family member Dhh1 with Dcp2, but did not demonstrate Dcp2-enhancing activity 31. The decapping activity thus acts as a coordinated, TOR-dependent process, synchronous with previously described mechanisms that inhibit transcriptional synthesis, dependent on such factors as Rim15, Gln3 and Msn2/4 3, 15, 32-34. Starvation-dependent dephosphorylation reverses the process, facilitating the induction of autophagy in concert with mRNA synthesis. The present data showing significant steady state levels of _ATG_-related transcripts after RCK suppression in yeast also suggest that significant mRNA synthesis of these transcripts occurs even under ‘repressive’ conditions; this may allow a more rapid induction of ATG transcripts in response to cellular stress, by simultaneously inducing mRNA synthesis and inhibiting its degradation, much akin to previously-described ‘futile cycles’ involving metabolic components 35. Combining a post-transcriptional inductive mechanism with increases in transcriptional synthesis in response to transcription factors such as Gln3 and TFEB 3, 4, thus facilitates a rapid autophagic induction. Environmental stresses, including glucose deprivation, can modulate mRNA stability 24, 36. We identified RCK family members, which are recognized for facilitating mRNA decapping and decay 10, as possessing a conserved functional role linking environmental conditions to autophagy induction. Analysis of protein-mRNA complexes, identified ATG8 as a prominent gene whose fate was likely determined by RNA binding and function, further supporting our model 37, 38. Data in C. neoformans as well as in mammalian systems show a more highly penetrant phenotype under both vegetative conditions and following TOR suppression, suggesting that evolutionary pressures have placed a higher dependence on post-transcriptional regulation and support the need to conduct such cross-species studies when considering conserved regulatory mechanisms.
Figure 8. A TOR-Mediated RCK-Dependent Pathway Negatively Regulates Autophagy Through mRNA Decapping and Degradation.
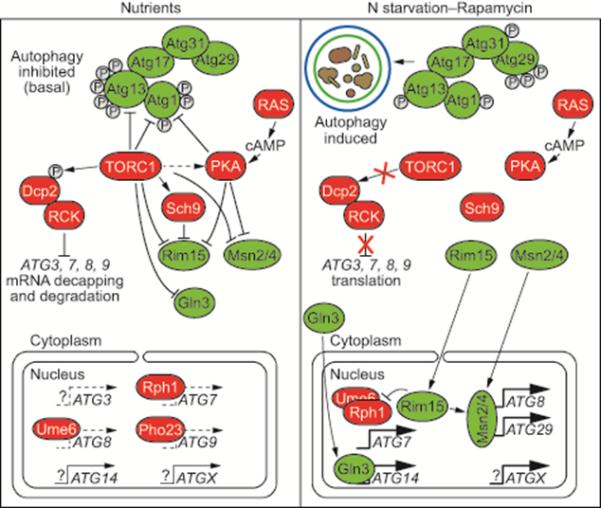
Under normal growth conditions (i.e., nutrient-replete), DEAD-box RNA helicases in the RCK family recruit ATG mRNA to the Dcp2 decapping complex, whose actions lead to cytoplasmic 5’-3’ mRNA degradation. TOR-associated phosphorylation of Dcp2 is required for transcript decapping and subsequent degradation. This process occurs simultaneously with transcript synthesis inhibition, facilitated by inactivation of positive transcription factors, such as Rim15, Msn2/4 and Gln3. Environmental stress, such as nutrient deficiency or rapamycin treatment, inactivates TOR, thereby preventing Dcp2 phosphorylation and causing RCK dissociation from ATG mRNA in a coordinate fashion. This facilitates accumulation of ATG transcripts and autophagy induction and acts in concert with transcriptional synthetic induction by positive ATG transcription factors.
A reversible TOR-dependent Dcp2 serine phosphorylation was an important component linking RCK member recruitment and ATG target transcript decapping/degradation. TOR is a key global regulator that controls protein translation through its interactions with RPS6KB1/p70S6 kinase 1 and EIF4EBP1/4E-BP1 39. In mammalian systems, the transition from rapid growth to growth arrest induced by MTOR inhibition results in translational arrest of synthetic machinery including ribosomal and translational initiation factors 40. TOR promotes the synthesis of most genes in vegetative conditions, but selectively represses a small subset by mechanisms including transcriptional suppression 41. TOR had previously been linked to stress-responsive mRNA stability programs, but the mechanism of this regulation was unclear 42. Along with mRNA stability regulation, it would appear that these post-transcriptional mechanisms may be an important component of stress response in eukaryotes. For the transcripts studied in the present paper, we did not find large amounts of translational suppression. However, Dhh1-mediated translational suppression has been predominantly studied using transcripts highly expressed under growth conditions that require translational suppression upon transfer to starvation conditions to rapidly shut down unneeded translational synthesis from pre-formed mRNA. In this process, mRNA transcripts are rapidly shunted from the polysome to RNP particles including P-bodies 23. However, autophagy transcripts are repressed under growth conditions and are activated in yeast predominantly under nutrient stress, which may reduce the need for translational suppression under initial growth conditions because steady state levels of transcripts are already quite low. Indeed, protein translational suppression of ATG genes did not feature predominantly in a recent whole genome ribosomal profiling study 40. In addition, we did not study the transition from starvation back to nutrient-rich growth where translational suppression could figure more predominantly. Sequence-specific factors that differentiate stress transcripts such as ATG genes vs those of the cellular synthetic machinery are the subject of active investigation.
The present data also demonstrated that RCK family members significantly affected cellular processes, including pathogen virulence and host immunity. In C. neoformans, Vad1 overexpression reduced autophagy sufficiently to affect the ability of the fungus to survive within macrophages, an important property for this facultative intracellular pathogen 19,43. A number of ATG transcripts are induced during macrophage residence 44 and suppression of autophagy transcripts such as ATG8 results in severely attenuated fungal virulence 16. Thus, the present data demonstrate a significant pathway of TOR signaling, connecting macrophage survival, autophagy and microbial virulence.
We also demonstrated that key aspects of MTOR-dependent DCP2-DDX6-dependent decapping of the autophagy-related transcript LC3 modulated rates of LPS-induced IL1B levels produced by the inflammasome 45. Blocking autophagy potentiates inflammasome activity, measured by IL1B production, and stimulating autophagy limits it 30. This effect was mimicked in the present studies by mutations in DCP2, phenocopying by expression of an MTOR-associated phosphomimetic mutation (resulting in increased LC3 degradation), and a phosphodeficient mutation (resulting in a reduction in LC3 degradation), respectively. These data show that manipulation of autophagy by the MTOR-associated phosphorylation status of DCP2 can consequentially affect the human inflammatory response, and likely plays a role in MTOR-dependent modulation of inflammatory states exemplified by patients with dominant-activating mutations in PIK3CD/p110δ 13. In summary, this post-transcriptional mechanism of autophagy regulation is an important pathway for promoting cell survival as well as pathogen virulence and host inflammatory response.
Methods
S. cerevisiae strains and media
Gene disruptions were performed using a standard method (Longtine et al., 1998). Yeast cells were grown in YPD [1% yeast extract, 2% peptone, and 2% glucose (all wt/vol)], YPgal [1% yeast extract, 2% peptone, and 2% galactose (all wt/vol)] or synthetic minimal medium (SMD; 0.67% yeast nitrogen base, 2% glucose, supplemented with the appropriate amino acids and vitamins). Autophagy was induced in starvation medium (SD-N; 0.17% yeast nitrogen base without amino acids, containing 2% glucose or SGal-N containing 2% galactose). The yeast strains used in this study are listed in Supplementary Table 1. Protein extraction, immunoblot, GFP-Atg8 processing, and alkaline phosphatase (Pho8Δ60) assays were performed as described previously 3, 14. Antisera to Atg8 (1:2,000), Atg1 (1:3,000), Atg9 (1:5,000), Pgk1 (1:50,000; a generous gift from Dr. Jeremy Thorner, University of California, Berkeley), monoclonal YFP (1:5,000; JL-8, Clontech ) a commercial antibody that reacts with PA (1:20,000; anti-PA, no longer available) were used for western blotting.
RNA and RT-qPCR
Total RNA was extracted using the RNeasy mini kit (Qiagen). To eliminate genomic DNA contamination, an additional DNase treatment was performed according to the RNeasy kit instructions with the RNase-free DNase set (Qiagen). One microgram of total RNA was reverse-transcribed into cDNA in a 20-μL reaction mixture using the High-capacity cDNA Reverse Transcription kit (Applied Biosystems). The cDNA levels were then analyzed using the Eppendorf Realplex4 with the gene-specific primers listed in Supplementary Table 2. Each sample was tested in a 96-well plate (Applied Biosystems). The reaction mix (15 μL final volume) consisted of 7.5 μL of Power SYBR Green master mix (Applied Biosystems), 0.5 μL of each primer (333.3 nM final concentration), 1.5 μL of H2O, and 5 μL of a 1:5 dilution of the cDNA preparation. The thermocycling program consisted of one hold at 95°C for 10 min, followed by 40 cycles of 15 s at 95°C and 1 min at 60°C. After completion of these cycles, melting-curve data were then collected to verify PCR specificity, contamination and the absence of primer dimers. The transcript abundance in samples was determined using a comparative threshold cycle method. The relative abundance of reference mRNAs in each sample was determined as described 46 and used to normalize for differences of total RNA amount according to the method described by Vandesompele et al. (2002) 47. For the comparison between wild-type and dhh1Δ the mRNAs of ALG9, TAF10 and TFC1 were used as references for the growing condition samples and the mRNAs of TAF10 and TFC1 were used as references for the starved samples. Because the expression of TAF10 and TFC1 was affected by the dcp2-7Δ mutation, ALG9 was used as the only internal reference in the comparison between wild type and dcp2-7Δ for both the growing and starvation conditions samples.
RNA binding-protein screen
Wild type and RBP mutant cells were grown in YPD medium until mid-log phase. The cells were then washed twice in SD-N and resuspended in SD-N. The optical density of each culture was adjusted to 0.8-0.9 and the cells were grown at 30°C for the time indicated in Fig. 1a. Immediately after the shift to starvation (day 0) or after 5, 10 and 15 days the same volume of each culture was collected and serial dilutions were spotted on YPD plates; the cells were grown at 30°C for 2 days before being imaged.
Cryptococcus neoformans strains and media
All experiments were conducted in a genetic background of C. neoformans strain serotype A H99 (ATCC 208821), a kind gift of J. Perfect (Duke Univ.). A complete list used in this study is described in Supplementary Table 3. Escherichia coli DH10B (Invitrogen) was the host strain for recovery and amplification of plasmids. The fungal strains were grown in YPD medium (2% glucose, 1% yeast extract, 2% Bacto-peptone) or on YPD agar medium (YPD and 2% agar) or in YNB plus glucose (yeast nitrogen base without amino acids and ammonium sulfate + 2% glucose). Asparagine minimum selective media (ASN) for transformant selection was previously described 48. Starvation medium was sterile phosphate-buffered saline (PBS), pH 7.4, unless otherwise noted.
Generation of VAD1 overexpression strains
A VAD1 gene fragment was generated by PCR amplification from an H99 cDNA mass-excised library with a pair of primers VAD1-S-Mun1 VAD1-A-Mun1, and then inserted into an EcoRI restriction site downstream from an ACT1 promoter of a pORA-KUTAP cryptococcal shuttle vector described previously 16, The construct was linearized with Sce1, and then introduced into H99FOA, a recipient strain. Stable transformants were selected on ASN minimal medium. The overexpression of VAD1 was confirmed by northern blots probed with isotope-tagged VAD1 cDNA sequence, and transformants were selected for equivalent copy number to the empty vector controls as described 49.
Generation of an N-terminal green-fluorescent-tagged Atg8 expression strain
A fragment of the ATG8 promoter region was PCR-amplified using primers ATG8-PRO-Bgl II and ATG8PRO-BlgIINedIPstR and cloned into a pORA C. neoformans shuttle vector previously described 50 to produce vector pORA-ATG8PRO. A fragment of a C. neoformans codon-optimized green fluorescent protein gene was then PCR amplified and cloned into pORA-ATG8PRO into a PstI compatible site, then the ATG8 codon region was amplified from C. neoformans genomic DNA and cloned into pORA-ATG8PRO:GFP via NdeI compatible sites, leaving the original TEF1/EF1α 3’-UTR to yield pATG8-PCG-EF1. Finally, a fragment of the ATG8 3’-UTR was PCR amplified and cloned into pATG8-PCG-EF1, using compatible NdeI sites, replacing the TEF1 3-UTR with the ATG8 3’-UTR to yield pATG8-PCG-Native. All inserted regions were confirmed by sequencing.
_Construction of an atg8_Δ mutant strain
To make the deletion construct, 2,500 base pair (bp) genomic fragments of the ATG8 gene were PCR amplified using primers ATG8-62-S-Xba1/ATG8-572A-R1 and ATG8-1541-S-BglII/ATG8-1866-A-XhoI as well as a 1.3-kb fragment of the URA5 gene using primers URA5-S-R1/URA5-A-BglII and the 3 fragments ligated simultaneously after digestion using compatible sites (see Supplementary Table 4 for sequence information). The final disruption allele with a 1.3-kb URA5 marker flanked on either side by a 500-bp DNA sequence homologous to genomic regions of the ATG8 gene was PCR-amplified and purified by spin column (Invitrogen) and introduced into H99FOA cells via a biolistic approach 50. Transformants were screened for potential deletion mutants by a PCR approach using one set of primers, designed to detect disruption events, including a primer just outside of the transforming vector and an opposing primer based on the URA5 sequence. The specific 2.6-kb disruption of the ATG8 gene in candidate mutants was verified by using a set of primers outside the sequences of the knockout construct and by Southern blot analysis.
Production of Dcp2 phosphomimetic- and phosphodeficient-expressing strains
Homologous sites in C. neoformans Dcp2 were determined from sites homologous to the rapamycin-sensitive sites described for Dcp2 from S. cerevisiae 22. Two EMBOSS global alignment programs 51, needle and stretcher, were used with default parameters to align the SAC sequence against the CRY sequence. The two programs aligned our site of interest (“SNKS”) to two different regions; stretcher aligned “SNKS” of SAC to “SQSS” of CRY with the “S” positions at 614 and 617, and needle aligned our site of interest (“SNKS”) to “ASFG” of CRY with the “S” position at 84. The phosphorylation site predictions were done using six different web server tools (NetPhos 2.0 - 52, DISPHOS - 53, NetPhosK 1.0 -, MotifScan - http://myhits.isb-sib.ch/cgi-bin/motif_scan, ScanProsite - 54, KinasePhos 2.0 - 55. Three (DISPHOS, NetPhosK, KinasePhos) out of the six tools predicted significant phosphorylation sites at both positions 614 and 617. NetPhos predicted a significant phosphorylation site at 617 alone. None of the six tools predicted any phosphorylation site at position 847.
DNA, RNA preparation and blotting
Primers used in the C. neoformans study are described in Supplementary Table 4. DNA extraction was conducted according to a previously published protocol 56. RNA was isolated and northern blots performed as previously described 8. DNA probes were labeled with [α-32P]-ATP for both Southern and northern blots using the RadPrime DNA Labeling System (Invitrogen) according to the manufacturer's protocol. Transcript levels of indicated genes were monitored by northern blot analysis hybridized with a PCR-amplified fragment of the indicated genes using primers listed in Supplementary Table 4.
RNA degradation assays
The method of Panepinto et al. (2005) was used 8. Briefly, cultures were grown to the log phase, at a final density of 107 cells/ml in yeast-peptone-dextrose medium at 30°C with vigorous shaking. Starvation was induced by incubating mid-log phase cells in PBS, pH 7.4, for 1 h and cells were harvested. Transcription was suppressed by addition of 1,10-phenanthroline (200 μg/ml in ethanol, Sigma). At the indicated time points, cells were harvested by 5 min of centrifugation at 5,000 rpm in a tabletop centrifuge at room temperature and immediately frozen in a −80 freezer for later use. Total RNA was extracted with the RNeasy®Mini Kit (QIAGEN). The degradation of ATG8 mRNA was detected by a standard northern blot protocol 8.
Capped RNA analysis
RNA Ligase Mediated Rapid Amplification of cDNA ENDs (RLM-RACE) analysis was performed with total RNA isolated from the indicated strains at the indicated times after transcription suppression by 1,10-phenanthroline by using the FirstChoice RLM-RACE kit according to the manufacturer's (Applied Biosystems) protocol 20. PCR amplification was performed by using the gene specific primers ATG8-A for ATG8, ATG5-A for ATG5, and ACT1-A for ACT1 (Supplementary Table 4) and two universal primers 5' RACE Outer Primer and 5' RACE Inner Primer (supplied by the manufacturer). The actin gene, ACT1, served as loading control. This analysis was performed in 3 independent experiments, and ATG8/ACT1 ratios were calculated for the indicated strains by densitometry (UN-SCAN-IT gel 6.1, Silk Scientific Corporation).
RNA and Protein Immunoprecipitation
RNA Immunoprecipitation was performed by an adaptation of a previously described method 57 using strains expressing _c-myc_-Vad1 or 3XFLAG-Dcp2. Briefly, protein G-Sepharose (Sigma) was washed 3 times with 50 mM Tris-HCl (pH 8.0), 150 mM NaCl, 0.1% NP40, and either 30 μg of anti-myc monoclonal antibodies (Sigma) or anti-FLAG monoclonal (Sigma) was added and incubated for 1 h at 4°C. The Sepharose-bound monoclonal antibody was washed 5 times in the same buffer at 4°C. For immunoprecipitation, cells were grown to mid-log phase in YPD at 30°C. Cells were harvested by centrifugation and the cells were washed twice in 25 mM HEPES-KOH (pH 7.5), 150 mM KCl, 2 mM MgCl2. Cells were resuspended in the above buffer containing 20 mM vanadyl ribonucleoside complexes (Sigma), 200 units/ml RNaseOUT (Sigma), 0.1% Nonidet P-40, 1 mM DTT, with protease inhibitor cocktail. Glass beads were added and the samples vortexed for 1 min. The supernatant fractions were removed and centrifuged for 10 min at 3,000 × gmax. Extracts were incubated with either anti-myc antibodies, or 3XFLAG-Dcp2 coupled to protein G-Sepharose for 1 h at 4°C. Beads were washed 7 times in 25 mM HEPES-KOH (pH 7.5), 150 mM KCl, 2 mM MgCl2, and were eluted in 50 mM Tris·HCl (pH 8.0), 100 mM NaCl, 10 mM EDTA, 1% SDS for 10 min at 65°C. A portion of each eluate was digested with proteinase K for 1 h at room temperature and then extracted with phenol/chloroform and ethanol precipitated to isolate RNA. RNA was analyzed by RT-PCR using primers listed in Supplementary Table 4 and detected on ethidium bromide-labeled gels. Quantities of Vad1 in the lysate prior to immunoprecipitation as well as that in pellets after immunoprecipiation were estimated on western blots using a DDX6/Vad1 cross-reactive antibody (Bethyl).
Fluorescent in situ Hybridization (FISH)
FISH was adapted for C. neoformans based on Zenklusen et al. 58 and Inacio et al. 59. Briefly, all strains were grown aerobically under continuous shaking in YPD broth (2% glucose, 1% yeast extract, 2% Bacto-peptone) at 30°C and either harvested during mid-log phase (OD 0.2-0.5) or subjected to starvation by incubating mid-log phase cells in phosphate buffered saline, pH 7.4 for 3 h. Cells were harvested by centrifugation for 5 min at 10,000 rpm. Cells were washed once with 1× PBS and fixed for 4 h with 4% w/v paraformaldehyde in PBS at 4°C. After fixation, cells were washed twice with PBS, resuspended in one volume of PBS and one volume of cold absolute ethanol and stored at −20°C until use. All probes were labelled at the ATG5 or ATG8 ORF and terminator with the fluorochrome Cy3 (Supplementary Table 5; Affymetrix). Approximately 106 fixed yeast cells were hybridized in 20 μl of hybridization buffer (0.9 M NaCl, 0.01% w/v SDS, 20 mM Tris-HCl, pH 7.2 and 20% formamide), with 5 ng of Cy3-labelled probe and incubated at 46°C for 16 h. After incubation, cells were pelleted by centrifugation and resuspended in 1 ml of prewarmed washing buffer (20 mM Tris-HCl, pH 8.0, 0.01% w/v SDS, 5 mM EDTA, 225 mM NaCl) for 30 min at 46°C. The suspension was then centrifuged and the pellet fraction resuspended in 50 μl of 1×PBS, placed on ice and analyzed within 3 h. The slides were then mounted in ProLong Gold antifade reagent (Invitrogen) and observed using a Leica DMI 6000B microscope with a Hamamatsu camera using LAS AF6000 ver 2.1.2 software (Leica).
Polysome fractionation
The method of Blewett and Goldstrohm 60 was used. Briefly, yeast were grown to mid-log phase (an O.D.600 between 0.6-0.8) in YPD. Half of each culture (500 mL) was rapidly harvested by centrifugation at 30°C, the media poured off, then cells were washed with PBS and collected by centrifugation at 30°C. The remaining 500 mL of culture was washed with PBS, and then incubated in PBS buffer 1 h for starvation conditions. Cell pellets were flash frozen by immersion in liquid nitrogen, frozen cell pellets were transferred to a mortar filled with liquid nitrogen and surrounded by dry ice. Yeast were lysed via mortar and pestle under cryogenic conditions, and lysed yeast powder was transferred to 15-mL conical tubes and stored in dry ice until all samples were collected. 500 μl of ice-cold lysis buffer (20 mM HEPES, pH 7.3, 5 mM MgCl2, 150 mM KCl, 40 U/mL Rnasin Plus [Promega]) was added to each sample, and lysates were thawed on ice. Insoluble debris was pelleted at 4°C for 10 min at 1400 × g, and the supernatant fraction was transferred to ice-cold 1.5-ml tubes. A 1/200 dilution of each lysate was made and quantified using a DeNovix DS-11 spectrophotometer. Based on A260 readings, 15 A260 units of each lysate was layered on top of 7%-47% w/v sucrose gradients, and polysomes separated for 2.5 h at 38,000 rpm in a SW41 rotor at 4°C. Gradients were then fractionated into 1 mL fractions using a Brandel tube piercer, Foxy Jr. fraction collector, and Teledyne Isco chart recorder. Sucrose fractions were stored at −80°C until RNA was extracted. RNA was extracted from 500 μl of each fraction using the Maxwell 16 instrument (Promega), and SimplyRNA kit (Promega).
Autophagic flux measurements
The method of Schlumpberger et al. (1997) 61 was used to measure protein turnover of radiolabeled proteins after serial tricholoroacetic acid precipitation. Briefly, mid-log phase yeast cells grown in YNB without amino acids and ammonium sulfate containing 2% glucose were labeled with fresh 35S-labeled methionine for 1 h at 30°C, then washed 3× with cold YNB containing 20 mg/L-methionine and 20 mg/L-cysteine and incubated in either YNB without amino acids and ammonium sulfate containing 1 mg/ml cysteine, 1 mg/ml methionine (starvation) or YPD containing 1 mg/ml each of methionine and cysteine (rich medium) at 30°C. At the indicated times, cell aliquots were transferred to microcentrifuge tubes, the cells lysed and protein precipitated with 10% final volume trichloroacetic acid at 95°C for 5 min followed by centrifugation at 12,000 g and radiation measured in the supernatant and pellet fractions by liquid scintillation.
Mouse virulence studies
Virulence studies were conducted using a previously described intravenous mouse meningoencephalitis model with 10 Swiss Albino female mice (6-8 wks old) per group on cryptococcal strains expressing plasmids in equivalent copy number determined by uncut Southern blot 62. Episomal expression of plasmids in C. neoformans have statistically insignificant differences in virulence from wild-type parental strains 16. Fungal viability was confirmed by growth of inocula on YPD agar. All experimental procedures involving animals were conducted under guidelines of the National Institutes of Health and protocols approved by the Institutional Animal Care Committees (IACUC) of the Intramural NIH/NIAID. Statistical comparison of survival times was made by a log-rank comparison using GraphPad Prism 5. No statistical method was used to determine sample size and investigators were not blinded to allocation during experiments and outcome assessment.
Identification of autophagy-related genes
Homologs of autophagy-related genes in C. neoformans were identified as described 16 and additional ones identified by use of a bidirectional best hits (BBH) method 63. Briefly, the autophagy-related genes of S. cerevisiae were used to perform an all-vs-all BLASTP similarity search 64 against the C. neoformans genome. The resulting hits were analyzed for the BBH using a custom PHP script.
Mammalian cells and cell culture
HeLa cells (ATCC® CCL-2™) were cultured in ATCC-formulated Eagle's minimum essential medium supplemented with 10% fetal bovine serum (FBS) and 1% penicillin-streptomycin solution. Embryonic stem (ES) cell RCK gene trap insertion was carried out as described 26 (Supplementary Fig. 2). Briefly, a retroviral gene-trap vector containing the 5’ selectable/reporter gene βGeo (βGal and Neo fusion) downstream of a splice acceptor sequence was introduced into wild-type C57BL/6J embryonic stem cells. Insertion of the gene-trap cassette into an intron located at the 5’ end of the target gene DDX6 produces incorrect splicing such that downstream exons are not properly expressed, thereby resulting in gene inactivation 26. Inverse PCR was used to determine the insert location in the DDX6 gene in the RCK gene trap clone ES cells (Supplementary Fig. 2). ES cell recombinant clones of the C57BL/6 background carrying the gene trap cassette between exons 1 and 2 of the DDX6 locus (Clone IST11384H1, Mouse Accession NM_00110826), referred to as DDX6+/− #2 in this manuscript, or exons 2 and 3 of the RCK/DDX6 locus (Clone IST12067C10), Mouse Accession NM_00110826), referred to as DDX6+/− #1 in this manuscript, were generated by the Texas A&M Institute for Genomic Medicine (http://www.tigm.org). ES cells were cultured on mouse embryonic fibroblasts (PMEF-N; Millipore), which acted as feeder cells, for maintaining the ES cell culture. In preparation for experiments, ES cells were separated from the feeder cells and plated onto gelatin-coated cell culture dishes. ES cells were then split an additional time and plated again onto gelatin-coated cell culture dishes to assure no feeder cells remained. ES cells were cultured in Knockout™ DMEM with glucose and sodium pyruvate (Life Technologies) containing 15% ES grade FBS (Atlanta Biologicals), 1% penicillin-streptomycin solution, 2 mM glutamine, 0.1 mM non-essential amino acids, and 1000 U/ml leukemia inhibitory factor of mouse origin (Santa Cruz). Wild-type C57BL/6J ES cells were a kind gift provided by Kevin Francis (NICHD, NIH, Bethesda, MD) and were used as controls in all ES cell experiments. THP-1 cells were obtained from American Type Culture Collection. THP-1 cells were maintained in RPMI-1640 medium containing 10% (vol/vol) FBS, 1% penicillin-streptomycin-amphotericin B and 50 mM 2-mercaptoethanol. THP-1 cells were differentiated into macrophages via 50 nM PMA treatment for 3 h. Differentiated THP-1 cells were seeded into 6-well plates at 2.0×10⁶ cells/well and treated with 200 ng/ml LPS overnight, when indicated.
Mammalian DNA and RNA preparation
DNA extraction and RNA extraction was accomplished using the DNeasy and RNeasy Mini Kits according to the manufacturer's (Qiagen) protocols. Primers used in this study are described in Supplementary Table 5.
Mammalian RNA interference
HeLa cells were transfected with small interfering RNA molecules specifically targeting RCK using the Amaxa® Cell Line Nucleofector® Kit R in conjunction with the Nucleofector™ System (Lonzo). Cells were cultured for 48 h before all experiments to achieve optimal results. Following sample collection, knockdown efficiency was determined using PCR methods to examine RCK transcript levels and western blotting to establish protein levels.
Mammalian Plasmids and transfection
Plasmids pT7-EGFP-C1-HsRCK (Plasmid 25033) and pT7-EGFP-C1-HsDCP2 (Plasmid 25031) were created by the laboratory of Elisa Izaurralde and obtained from Addgene (Addgene.org). pT7-EGFP-C1-HsDCP2 was used to express a site-directed mutagenesis HsDCP2 by a standard method. The plasmid as a template was amplified in a mutagenesis reaction with two overlapped primers containing the target mutations, DCP2-S249D-S AGATTTGGCGATTCCTCAGACGATGACAATGGATTTTCCTCAAC AND DCP2-S249D-A TCTAAACCGCTAAGGAGTCTGCTACTGTTACCTAAAAGGAGTTG FOR THE PHOSPHOMIMETIC MUTATION (PT7-EGFP-C1-HSDCP2-S249D); DCP2-S249A-S GATTTGGCGATTCCTCAGACGCTGACAATGGATTTTCCTCAA AND DCP2-S249A-ACTAAACCGCTAAGGAGTCTGCGACTGTTACCTAAAAGGAGTT for the phosphodeficient mutation (pT7-EGFP-C1-HsDCP2- S249A). The PCR products were digested with Dpn1 (Invitrogen) to eliminate template plasmid and purified with a PCR Purification Kit (Qiagen), and then transformed into competent E. coli (Bioline). Individual transformants were picked and cultured in LB broth with ampicillin. The plasmids containing HsDCP2 with the target mutagenesis were harvested with a Miniprep Kit (Qiagen) and verified by DNA sequencing. HeLa cells were transfected using X-tremeGene 9 DNA Transfection Reagent (Roche) using a 5:2 ratio of transfection reagent to plasmid DNA and cultured for 48 h before all experimentation. Following sample collection, transfection efficiency and protein levels were determined using fluorescence microscopy and western blotting.
HeLa and ES cell Autophagy induction
Cells were treated with control medium, medium containing 5 μM rapamycin, or GIBCO® Hank's balanced salt solution (Life Technologies) for 2 h to examine autophagy unless otherwise stated. In experiments where LC3 conversion from cytosolic LC3-I to the lipidated LC3-II form was examined using western blotting, cells were also treated with 100 nM bafilomycin A1 (Sigma) at the initiation of the experiment 65. In experiments where SQSTM1 degradation was examined for autophagosome maturation, no lysosomal inhibitors were added to the cells. All samples were processed immediately for analysis or stored at −80°C until a later date.
THP-1 cell autophagic induction and IL1B level measurements
pT7-EGFP-C1 (empty vector), pT7-EGFP-C1-HsDCP2 (wild-type), pT7-EGFP-C1-HsDCP2-S249D (phosphomimetic mutant), and pT7-EGFP-C1-HsDCP2-S249A (phosphodeficient mutant) were transformed using nucleofection into non-differentiated THP-1 monocytes (0.5 μg plasmid per 2.5×10⁶ cells) using Human Monocyte Nucleofection Kit (Lonza) as instructed in the “Efficient non-viral transfection of THP-1 cells” paper. 6 h following nucleofection, THP-1 cells were differentiated into macrophages via 50 nM PMA treatment for 3 h. Differentiated THP-1 cells were seeded into 12-well plates and treated with 20 ng/ml LPS overnight. The next morning, the supernatant fractions were harvested for IL1B ELISA quantification and the cells were lysed for LC3, GFP and actin immunoblotting. IL1B measurement was performed as instructed in the e-Bioscience human IL1B ELISA kit.
Mammalian RNA degradation assays
To inhibit transcription, cells were treated with 5 μg/ml actinomycin D (Sigma) and 20 μg/ml 5,6-dichlorobenzimidazole 1-β-D-ribofuranoside (DBR) (Sigma) in control media or media containing 5 μM rapamycin 66. Controls cells were untreated and collected at initiation of treatment (time 0 min). After 30 min, samples were collected and RNA was extracted for analysis using PCR methods.
Capped RNAs analysis in mammalian cells
Using the FirstChoice RLM-RACE Kit (Life Technologies), the presence of capped LC3 transcripts was assayed in mammalian cells by PCR amplification of a cDNA product obtained from sequential ligation of a 5’ RNA adapter to full-length capped mRNA following treatment with tobacco acid pyrophosphatase. Samples were processed according to the manufacturer's protocol and analyzed accordingly.
Western blotting and immunoprecipitation
Cells were lysed using cOmplete Lysis-M (Roche) with the addition of PhosSTOP Phosphate Inhibitor Cocktail (Roche) and protein concentration was determined using a colorimetric assay. 50 μg of each sample was ran on 4-20% or 7.5% Mini-Protean® TGX™ precast gels (Bio-Rad) and proteins were transferred onto 0.2-μm PVDF or 0.45-μM nitrocellulose membranes (Bio-Rad). Membranes were immunoblotted with rabbit anti-DDX6 antibody (A300-461A, Bethyl), rabbit anti-DCP2 antibody (A302-597A, Bethyl), mouse anti-GFP antibody (clones 7.1 and 13.1, Roche), rabbit anti-SQSTM1/p62 antibody (A302-857A), mouse anti-LC3 antibody (NB600-1384, Novus) and mouse anti-actin (MAB1501, Millipore). Membranes were then probed with horseradish peroxidase-conjugated anti-rabbit secondary antibodies (Bethyl) or anti-mouse secondary antibodies (Jackson) and proteins were visualized using Clarity™ Western ECL Substrate (Bio-Rad). For immunoprecipitation, 1 mg of total protein from GFP-DCP2-expressing HeLa cells lysate was precipitated using mouse ant-GFP antibody (Roche) attached to Dynabeads® Protein G (Invitrogen) cross-linked by bis(sulfosuccinimidyl) suberate (BS3) (Invitrogen) for 2 h at room temperature. Samples were then washed 3 times, prepared for gel electrophoresis and run on gels as described above. Lysate input was used as a control and immunoblotted accordingly to demonstrate equal loading.
Targeted ion tandem mass spectrometry
GFP-DCP2 was immunoprecipitated from samples as described, and gels were then fixed and stained with Coomassie Brilliant Blue. The band corresponding to the molecular weight of GFP-DCP2 was excised and sent to William S. Lane at the FAS Center for Systems Biology of the Harvard Mass Spectrometry and Proteomics Resource Laboratory (http://labs.mcb.harvard.edu/microchem/) for peptide phosphorylation analysis. Samples were analyzed in detail as previously described 67.
Analysis of MTOR-dependent DCP2 phosphorylation
Affinity purified rabbit anti DCP2-pSer249 antisera was produced by a commercial vendor (GenScript) using standard methods. Briefly, a synthetic DCP2_pSer249 phosphopeptide (SSD(pSer)DNGFSSTGSTC) was utilized to immunize rabbits and produce polyclonal serum and purified by affinity chromatography using the synthetic phosphorylated peptide. Serum was positive at a greater than 1:128,000 dilution by ELISA against the phosphorylated peptide and negative at 1:1000 against the corresponding non-phosphorylated peptide. Recombinant mammalian DCP2 was prepared from a E. coli vector pHI902 expression system as described 68. Briefly, primers pMAL-c-BamHI-Dcp2F: 5’ AGGCCTGGATCCATGGAGACCAAACGGGTGGAGATTCC and pMal-c Sal1-DCP2 R GCTTGCGATATCGTCGACTCAAAGGTCCAAGATTTTCAT were used to PCR amplify a 1200-bp fragment, inserted into the pH902 vector, expressed in E. coli strain and purified over an amylose-agarose affinity matrix.
The MTOR kinase assay of Ikenoue et al.69 was used to test for in vitro phosphorylation of DCP2 recombinant protein. Briefly, MTOR was immunoprecipitated from CHAPS-solubilized HeLa cells using an anti-MTOR antibody (Abcam), washed, then incubated with 100 ng of DCP2-MBP and 250 μM ATP in kinase buffer containing 10 mM MgCl2 at 30°C for 20 min and phosphorylated product detected by western blot using the anti-DCP2-pSer249 antibody described above and an anti-rabbit HRP antibody and developed using the manufacturer's directions.
Analysis of LC3 puncta in mammalian cells
Cells were grown on Lab-Tek™ II Chamber Slide™ System slides. After experimentation, cells were fixed using formalin, permeabilized using 0.5% BSA, 0.2% saponin in a 1×PBS solution, and blocked with 0.5% BSA, in a 1×PBS solution. Samples were probed with rabbit anti-LC3B antibody (L10382, Invitrogen) and a fluorescence conjugated secondary anti-rabbit antibody was then used for visualization. DAPI was used for nuclear counterstaining. LC3 puncta in cells were observed using a Leica EL6000 microscope and analyzed using Leica software. A minimum of 100 cells was examined for the presence of LC3 puncta in each condition of the individual experiments.
Analysis of inflammasome regulation in a patient with a PIK3CD/p110δ mutation
For western blots of p-DCP2 and SQSTM1 2×10⁶ PBMCs/ml in 3 ml of RPMI from both the control and the patient were loaded into 6-well plates in the presence or absence of 200 nM rapamycin overnight at 37°C with 5% CO2. Cells were harvested the following morning and lysed for western blot analysis. About 25 μg of total protein were loaded into each well of a 4-20% SDS-PAGE gel. Following gel electrophoresis, proteins were transferred to a nitrocellulose membrane and probed with either primary antibodies or both primary and secondary antibodies and developed according to the manufacturer's directions (GenScript). For autophagy body visualization 5×10⁴ PBMC cells in 800 μl of RPMI from an age-matched healthy volunteer or the patient were loaded into each well in a 8-chamber glass slide. Cells were incubated at 37°C with 5% CO2 for 1 h for monocyte attachment followed by removal of the supernatant fraction and replacement with fresh RPMI in the presence or absence of 200 nM rapamycin. Cells were incubated at 37°C with 5% CO2 overnight. The following morning, cells were washed with PBS and fixed in 3% formalin for 15 min and permeabilized with permeabilization buffer (eBioscience, 00-5523-00) for 15 min at room temperature. After blocking with 10% anti-goat serum in 5% BSA for 2 h at room temperature, cells were probed with rabbit anti-human LC3 primary antibodies and Alexa Flour 488-labeled goat anti-rabbit secondary antibodies. Following staining, cells were mounted with ProLong antifade medium and observed under a Leica confocal microscope. IL1B assay: 70000 cells in RPMI medium were loaded into each well of a 96-well plate. Cells were treated either with 200 ng/ml rapamycin or PBS control for 16 h in a 37°C incubator with 5% CO2. Triplicates were made for each condition. On the next day, cells and media mixtures were transferred to microcentrifuge tubes and supernatant fractions harvested by centrifugation at 8000 rpm for 5 min. The amount of IL1B cytokines in each supernatant fraction was measured according to the instructions of a human IL1B Elisa kit (eBioscience, 88-7010-88).
Patient informed consent and Institutional Review Board (IRB) approval
The National Institute of Allergy and Infectious Diseases (NIAID) IRB approved the study under NIAID Protocol #93-I-0119. All subjects provided written informed consent directly.
Statistics
In the fungal studies,differences in autophagic body formation were determined by Chi-square testing using GraphPad Prism 6. Transcriptional differences were compared in at least 3 independent experiments using unpaired Student's t-test using GraphPad Prism 6. Slopes of ATG8 degradation were determined by differences in slopes by t-test using N-2 degrees of freedom and GraphPad Prism 5. In the mammalian studies statistical significance in transcript levels, band density of PCR products from capped RNA analysis assay, and LC3 puncta were determined by unpaired t-tests of at least 3 independent experiments using GraphPad Prism 6. Differences with a P-value <0.05 were considered significant.
Supplementary Material
1
2
3
4
5
6
7
8
9
Acknowledgements
The authors thank John Kim (University of Michigan, National Institutes of Health grant GM088565) for providing the RBP knockout library. This work was funded, in part, by the Intramural Research Program of the NIH, NIAID, NICHD and by National Institutes of Health grant GM053396 (to D.J.K.).
Footnotes
Author's Contributions
GH: experimental work, project planning, data analysis, writing; TM: experimental work, project planning, data analysis, writing; AB: experimental work, project planning, data analysis, writing YDP: experimental work, project planning, data analysis, writing; JQ: experimental work, data analysis, writing; AV: experimental work, data analysis, writing; NZ: experimental work, data analysis, writing; SRW: experimental work, data analysis, writing; NHB: experimental work, data analysis, writing;TGM: experimental work, data analysis, writing; RJM: data analysis, project planning, writing; JHK: data analysis, project planning, writing, editing; GU: experimental work, data analysis, protocol preparation, writing, editing; DJK: project planning, data analysis, writing, editing; PRW: project planning, data analysis, writing, editing.
REFERENCES
- 1.Feng Y, He D, Yao Z, Klionsky DJ. The machinery of macroautophagy. Cell Res. 2014;24:24–41. doi: 10.1038/cr.2013.168. [DOI] [PMC free article] [PubMed] [Google Scholar]
- 2.Kamada Y, et al. Tor-mediated induction of autophagy via an Apg1 protein kinase complex. J Cell Biol. 2000;150:1507–13. doi: 10.1083/jcb.150.6.1507. [DOI] [PMC free article] [PubMed] [Google Scholar]
- 3.Yorimitsu T, Zaman S, Broach JR, Klionsky DJ. Protein kinase A and Sch9 cooperatively regulate induction of autophagy in Saccharomyces cerevisiae. Mol Biol Cell. 2007;18:4180–9. doi: 10.1091/mbc.E07-05-0485. [DOI] [PMC free article] [PubMed] [Google Scholar]
- 4.Settembre C, et al. TFEB links autophagy to lysosomal biogenesis. Science. 2011;332:1429–33. doi: 10.1126/science.1204592. [DOI] [PMC free article] [PubMed] [Google Scholar]
- 5.Garneau NL, Wilusz J, Wilusz CJ. The highways and byways of mRNA decay. Nat Rev Mol Cell Biol. 2007;8:113–26. doi: 10.1038/nrm2104. [DOI] [PubMed] [Google Scholar]
- 6.Nagarajan VK, Jones CI, Newbury SF, Green PJ. XRN 5′-->3′ exoribonucleases: structure, mechanisms and functions. Biochim Biophys Acta. 2013;1829:590–603. doi: 10.1016/j.bbagrm.2013.03.005. [DOI] [PMC free article] [PubMed] [Google Scholar]
- 7.Sharif H, et al. Structural analysis of the yeast Dhh1-Pat1 complex reveals how Dhh1 engages Pat1, Edc3 and RNA in mutually exclusive interactions. Nucleic Acids Res. 2013;41:8377–90. doi: 10.1093/nar/gkt600. [DOI] [PMC free article] [PubMed] [Google Scholar]
- 8.Panepinto J, et al. The DEAD-box RNA helicase Vad1 regulates multiple virulence-associated genes in Cryptococcus neoformans. J Clin Invest. 2005;115:632–641. doi: 10.1172/JCI200523048. [DOI] [PMC free article] [PubMed] [Google Scholar]
- 9.Weston A, Sommerville J. Xp54 and related (DDX6-like) RNA helicases: roles in messenger RNP assembly, translation regulation and RNA degradation. Nucleic Acids Res. 2006;34:3082–94. doi: 10.1093/nar/gkl409. [DOI] [PMC free article] [PubMed] [Google Scholar]
- 10.Presnyak V, Coller J. The DHH1/RCKp54 family of helicases: an ancient family of proteins that promote translational silencing. Biochim Biophys Acta. 2013;1829:817–23. doi: 10.1016/j.bbagrm.2013.03.006. [DOI] [PMC free article] [PubMed] [Google Scholar]
- 11.Freeberg MA, et al. Pervasive and dynamic protein binding sites of the mRNA transcriptome in Saccharomyces cerevisiae. Genome Biol. 2013;14:R13. doi: 10.1186/gb-2013-14-2-r13. [DOI] [PMC free article] [PubMed] [Google Scholar]
- 12.Tsukada M, Ohsumi Y. Isolation and characterization of autophagy-defective mutants of Saccharomyces cerevisiae. FEBS Lett. 1993;333:169–74. doi: 10.1016/0014-5793(93)80398-e. [DOI] [PubMed] [Google Scholar]
- 13.Lucas CL, et al. Dominant-activating germline mutations in the gene encoding the PI(3)K catalytic subunit p110delta result in T cell senescence and human immunodeficiency. Nat Immunol. 2014;15:88–97. doi: 10.1038/ni.2771. [DOI] [PMC free article] [PubMed] [Google Scholar]
- 14.Shintani T, Klionsky DJ. Autophagy in health and disease: a double-edged sword. Science. 2004;306:990–995. doi: 10.1126/science.1099993. [DOI] [PMC free article] [PubMed] [Google Scholar]
- 15.Bartholomew CR, et al. Ume6 transcription factor is part of a signaling cascade that regulates autophagy. Proc Natl Acad Sci U S A. 2012;109:11206–10. doi: 10.1073/pnas.1200313109. [DOI] [PMC free article] [PubMed] [Google Scholar]
- 16.Hu G, et al. PI3K signaling of autophagy is required for starvation tolerance and virulenceof Cryptococcus neoformans. J Clin Invest. 2008;118:1186–97. doi: 10.1172/JCI32053. [DOI] [PMC free article] [PubMed] [Google Scholar]
- 17.Park BJ, et al. Estimation of the current global burden of cryptococcal meningitis among persons living with HIV/AIDS. Aids. 2009;23:525–30. doi: 10.1097/QAD.0b013e328322ffac. [DOI] [PubMed] [Google Scholar]
- 18.Klionsky DJ, et al. Guidelines for the use and interpretation of assays for monitoring autophagy. Autophagy. 2012;8:445–544. doi: 10.4161/auto.19496. [DOI] [PMC free article] [PubMed] [Google Scholar]
- 19.Feldmesser M, Kress Y, Novikoff P, Casadevall A. Cryptococcus neoformans is a facultative intracellular pathogen in murine pulmonary infection. Infect Immun. 2000;68:4225–37. doi: 10.1128/iai.68.7.4225-4237.2000. [DOI] [PMC free article] [PubMed] [Google Scholar]
- 20.Goeres DC, et al. Components of the Arabidopsis mRNA decapping complex are required for early seedling development. Plant Cell. 2007;19:1549–64. doi: 10.1105/tpc.106.047621. [DOI] [PMC free article] [PubMed] [Google Scholar]
- 21.Dunckley T, Parker R. The DCP2 protein is required for mRNA decapping in Saccharomyces cerevisiae and contains a functional MutT motif. EMBO J. 1999;18:5411–22. doi: 10.1093/emboj/18.19.5411. [DOI] [PMC free article] [PubMed] [Google Scholar]
- 22.Huber A, et al. Characterization of the rapamycin-sensitive phosphoproteome reveals that Sch9 is a central coordinator of protein synthesis. Genes Dev. 2009;23:1929–43. doi: 10.1101/gad.532109. [DOI] [PMC free article] [PubMed] [Google Scholar]
- 23.Coller J, Parker R. General translational repression by activators of mRNA decapping. Cell. 2005;122:875–86. doi: 10.1016/j.cell.2005.07.012. [DOI] [PMC free article] [PubMed] [Google Scholar]
- 24.Teixeira D, Sheth U, Valencia-Sanchez MA, Brengues M, Parker R. Processing bodies require RNA for assembly and contain nontranslating mRNAs. RNA. 2005;11:371–82. doi: 10.1261/rna.7258505. [DOI] [PMC free article] [PubMed] [Google Scholar]
- 25.Ashe MP, De Long SK, Sachs AB. Glucose depletion rapidly inhibits translation initiation in yeast. Mol Biol Cell. 2000;11:833–48. doi: 10.1091/mbc.11.3.833. [DOI] [PMC free article] [PubMed] [Google Scholar]
- 26.Gray RS, et al. The planar cell polarity effector Fuz is essential for targeted membrane trafficking, ciliogenesis and mouse embryonic development. Nat Cell Biol. 2009;11:1225–32. doi: 10.1038/ncb1966. [DOI] [PMC free article] [PubMed] [Google Scholar]
- 27.Hsu PP, et al. The mTOR-regulated phosphoproteome reveals a mechanism of mTORC1-mediated inhibition of growth factor signaling. Science. 2011;332:1317–22. doi: 10.1126/science.1199498. [DOI] [PMC free article] [PubMed] [Google Scholar]
- 28.Deretic V. Autophagy: an emerging immunological paradigm. J Immunol. 2012;189:15–20. doi: 10.4049/jimmunol.1102108. [DOI] [PMC free article] [PubMed] [Google Scholar]
- 29.Levine B, Mizushima N, Virgin HW. Autophagy in immunity and inflammation. Nature. 2011;469:323–35. doi: 10.1038/nature09782. [DOI] [PMC free article] [PubMed] [Google Scholar]
- 30.Shi CS, et al. Activation of autophagy by inflammatory signals limits IL-1beta production by targeting ubiquitinated inflammasomes for destruction. Nat Immunol. 2012;13:255–63. doi: 10.1038/ni.2215. [DOI] [PMC free article] [PubMed] [Google Scholar]
- 31.Nissan T, Rajyaguru P, She M, Song H, Parker R. Decapping activators in Saccharomyces cerevisiae act by multiple mechanisms. Mol Cell. 2010;39:773–83. doi: 10.1016/j.molcel.2010.08.025. [DOI] [PMC free article] [PubMed] [Google Scholar]
- 32.Yang Z, Geng J, Yen WL, Wang K, Klionsky DJ. Positive or negative roles of different cyclin-dependent kinase Pho85-cyclin complexes orchestrate induction of autophagy in Saccharomyces cerevisiae. Mol Cell. 2010;38:250–64. doi: 10.1016/j.molcel.2010.02.033. [DOI] [PMC free article] [PubMed] [Google Scholar]
- 33.Chan TF, Bertram PG, Ai W, Zheng XF. Regulation of APG14 expression by the GATA-type transcription factor Gln3p. J Biol Chem. 2001;276:6463–7. doi: 10.1074/jbc.M008162200. [DOI] [PubMed] [Google Scholar]
- 34.Fullgrabe J, Klionsky DJ, Joseph B. The return of the nucleus: transcriptional and epigenetic control of autophagy. Nat Rev Mol Cell Biol. 2014;15:65–74. doi: 10.1038/nrm3716. [DOI] [PubMed] [Google Scholar]
- 35.Shulman GI, Ladenson PW, Wolfe MH, Ridgway EC, Wolfe RR. Substrate cycling between gluconeogenesis and glycolysis in euthyroid, hypothyroid, and hyperthyroid man. J Clin Invest. 1985;76:757–64. doi: 10.1172/JCI112032. [DOI] [PMC free article] [PubMed] [Google Scholar]
- 36.Yoon JH, Choi EJ, Parker R. Dcp2 phosphorylation by Ste20 modulates stress granule assembly and mRNA decay in Saccharomyces cerevisiae. J Cell Biol. 2010;189:813–27. doi: 10.1083/jcb.200912019. [DOI] [PMC free article] [PubMed] [Google Scholar]
- 37.Hogan DJ, Riordan DP, Gerber AP, Herschlag D, Brown PO. Diverse RNA-binding proteins interact with functionally related sets of RNAs, suggesting an extensive regulatory system. PLoS Biol. 2008;6:e255. doi: 10.1371/journal.pbio.0060255. [DOI] [PMC free article] [PubMed] [Google Scholar]
- 38.Riordan DP, Herschlag D, Brown PO. Identification of RNA recognition elements in the Saccharomyces cerevisiae transcriptome. Nucleic Acids Res. 2011;39:1501–9. doi: 10.1093/nar/gkq920. [DOI] [PMC free article] [PubMed] [Google Scholar]
- 39.Hay N, Sonenberg N. Upstream and downstream of mTOR. Genes Dev. 2004;18:1926–45. doi: 10.1101/gad.1212704. [DOI] [PubMed] [Google Scholar]
- 40.Thoreen CC, et al. A unifying model for mTORC1-mediated regulation of mRNA translation. Nature. 2012;485:109–13. doi: 10.1038/nature11083. [DOI] [PMC free article] [PubMed] [Google Scholar]
- 41.Hardwick J, Kuruvilla F, Tong J, Shamji A, Schreiber S. Rapamycin-modulated transcription defines the subset of nutrient-sensitive signaling pathways directly controlled by the Tor proteins. Proc Natl Acad Sci USA. 1999;96:14866–70. doi: 10.1073/pnas.96.26.14866. [DOI] [PMC free article] [PubMed] [Google Scholar]
- 42.Romero-Santacreu L, Moreno J, Perez-Ortin JE, Alepuz P. Specific and global regulation of mRNA stability during osmotic stress in Saccharomyces cerevisiae. RNA. 2009;15:1110–20. doi: 10.1261/rna.1435709. [DOI] [PMC free article] [PubMed] [Google Scholar]
- 43.Osterholzer JJ, et al. Role of dendritic cells and alveolar macrophages in regulating early host defense against pulmonary infection with Cryptococcus neoformans. Infect Immun. 2009;77:3749–58. doi: 10.1128/IAI.00454-09. [DOI] [PMC free article] [PubMed] [Google Scholar]
- 44.Fan W, Kraus P, Boily M, Heitman J. Cryptococcus neoformans gene expression during murine macrophage infection. Eukaryot Cell. 2005;4:1420–33. doi: 10.1128/EC.4.8.1420-1433.2005. [DOI] [PMC free article] [PubMed] [Google Scholar]
- 45.Schroder K, Tschopp J. The inflammasomes. Cell. 2010;140:821–32. doi: 10.1016/j.cell.2010.01.040. [DOI] [PubMed] [Google Scholar]
- 46.Teste MA, Duquenne M, Francois JM, Parrou JL. Validation of reference genes for quantitative expression analysis by real-time RT-PCR in Saccharomyces cerevisiae. BMC Mol Biol. 2009;10:99. doi: 10.1186/1471-2199-10-99. [DOI] [PMC free article] [PubMed] [Google Scholar]
- 47.Vandesompele J, et al. Accurate normalization of real-time quantitative RT-PCR data by geometric averaging of multiple internal control genes. Genome Biol. 2002;3:RESEARCH0034. doi: 10.1186/gb-2002-3-7-research0034. [DOI] [PMC free article] [PubMed] [Google Scholar]
- 48.Zhu X, Gibbons J, Zhang S, Williamson PR. Copper-mediated reversal of defective laccase in a Deltavph1 avirulent mutant of Cryptococcus neoformans. Mol Microbiol. 2003;47:1007–14. doi: 10.1046/j.1365-2958.2003.03340.x. [DOI] [PubMed] [Google Scholar]
- 49.Panepinto JC, et al. Overexpression of TUF1 restores respiratory growth and fluconazole sensitivity to a Cryptococcus neoformans vad1Delta mutant. Microbiology. 2010;156:2558–65. doi: 10.1099/mic.0.035923-0. [DOI] [PMC free article] [PubMed] [Google Scholar]
- 50.Liu X, Hu G, Panepinto J, Williamson P. Role of a VPS41 homolog in starvation response and virulence of Cryptococcus neoformans. Mol Microbiol. 2006;61:1132–46. doi: 10.1111/j.1365-2958.2006.05299.x. [DOI] [PubMed] [Google Scholar]
- 51.Rice P, Longden I, Bleasby A. EMBOSS: the European Molecular Biology Open Software Suite. Trends Genet. 2000;16:276–7. doi: 10.1016/s0168-9525(00)02024-2. [DOI] [PubMed] [Google Scholar]
- 52.Blom N, Sicheritz-Ponten T, Gupta R, Gammeltoft S, Brunak S. Prediction of post-translational glycosylation and phosphorylation of proteins from the amino acid sequence. Proteomics. 2004;4:1633–49. doi: 10.1002/pmic.200300771. [DOI] [PubMed] [Google Scholar]
- 53.Iakoucheva LM, et al. The importance of intrinsic disorder for protein phosphorylation. Nucleic Acids Res. 2004;32:1037–49. doi: 10.1093/nar/gkh253. [DOI] [PMC free article] [PubMed] [Google Scholar]
- 54.de Castro E, et al. ScanProsite: detection of PROSITE signature matches and ProRule-associated functional and structural residues in proteins. Nucleic Acids Res. 2006;34:W362–5. doi: 10.1093/nar/gkl124. [DOI] [PMC free article] [PubMed] [Google Scholar]
- 55.Wong YH, et al. KinasePhos 2.0: a web server for identifying protein kinase-specific phosphorylation sites based on sequences and coupling patterns. Nucleic Acids Res. 2007;35:W588–94. doi: 10.1093/nar/gkm322. [DOI] [PMC free article] [PubMed] [Google Scholar]
- 56.Casadevall A, Perfect J. Cryptococcus neoformans. ASM Press; Wash D.C.: 1998. [Google Scholar]
- 57.Takizawa PA, Vale RD. The myosin motor, Myo4p, binds Ash1 mRNA via the adapter protein, She3p. Proc Natl Acad Sci U S A. 2000;97:5273–8. doi: 10.1073/pnas.080585897. [DOI] [PMC free article] [PubMed] [Google Scholar]
- 58.Zenklusen D, Larson DR, Singer RH. Single-RNA counting reveals alternative modes of gene expression in yeast. Nat Struct Mol Biol. 2008;15:1263–71. doi: 10.1038/nsmb.1514. [DOI] [PMC free article] [PubMed] [Google Scholar]
- 59.Inacio J, da Luz Martins M. Microscopic detection of yeasts using fluorescence in situ hybridization. Methods Mol Biol. 2013;968:71–82. doi: 10.1007/978-1-62703-257-5_5. [DOI] [PubMed] [Google Scholar]
- 60.Blewett NH, Goldstrohm AC. A eukaryotic translation initiation factor 4E-binding protein promotes mRNA decapping and is required for PUF repression. Mol Cell Biol. 2012;32:4181–94. doi: 10.1128/MCB.00483-12. [DOI] [PMC free article] [PubMed] [Google Scholar]
- 61.Schlumpberger M, et al. AUT1, a gene essential for autophagocytosis in the yeast Saccharomyces cerevisiae. J Bacteriol. 1997;179:1068–76. doi: 10.1128/jb.179.4.1068-1076.1997. [DOI] [PMC free article] [PubMed] [Google Scholar]
- 62.Salas SD, Bennett JE, Kwon-Chung KJ, Perfect JR, Williamson PR. Effect of the laccase gene CNLAC1, on virulence of Cryptococcus neoformans. J Exp Med. 1996;184:377–86. doi: 10.1084/jem.184.2.377. [DOI] [PMC free article] [PubMed] [Google Scholar]
- 63.Overbeek R, Fonstein M, D'Souza M, Pusch GD, Maltsev N. The use of gene clusters to infer functional coupling. Proc Natl Acad Sci U S A. 1999;96:2896–901. doi: 10.1073/pnas.96.6.2896. [DOI] [PMC free article] [PubMed] [Google Scholar]
- 64.Altschul SF, et al. Gapped BLAST and PSI-BLAST: a new generation of protein database search programs. Nucleic Acids Res. 1997;25:3389–402. doi: 10.1093/nar/25.17.3389. [DOI] [PMC free article] [PubMed] [Google Scholar]
- 65.Kabeya Y, et al. LC3, a mammalian homologue of yeast Apg8p, is localized in autophagosome membranes after processing. EMBO J. 2000;19:5720–8. doi: 10.1093/emboj/19.21.5720. [DOI] [PMC free article] [PubMed] [Google Scholar]
- 66.Li Y, Song M, Kiledjian M. Differential utilization of decapping enzymes in mammalian mRNA decay pathways. RNA. 2011;17:419–28. doi: 10.1261/rna.2439811. [DOI] [PMC free article] [PubMed] [Google Scholar]
- 67.Paquette N, et al. Serine/threonine acetylation of TGFbeta-activated kinase (TAK1) by Yersinia pestis YopJ inhibits innate immune signaling. Proc Natl Acad Sci U S A. 2012;109:12710–5. doi: 10.1073/pnas.1008203109. [DOI] [PMC free article] [PubMed] [Google Scholar]
- 68.Nallamsetty S, Waugh DS. A generic protocol for the expression and purification of recombinant proteins in Escherichia coli using a combinatorial His6-maltose binding protein fusion tag. Nat Protoc. 2007;2:383–91. doi: 10.1038/nprot.2007.50. [DOI] [PubMed] [Google Scholar]
- 69.Ikenoue T, Hong S, Inoki K. Monitoring mammalian target of rapamycin (mTOR) activity. Methods Enzymol. 2009;452:165–80. doi: 10.1016/S0076-6879(08)03611-2. [DOI] [PubMed] [Google Scholar]
Associated Data
This section collects any data citations, data availability statements, or supplementary materials included in this article.
Supplementary Materials
1
2
3
4
5
6
7
8
9